Analysis of Portfolio Outcomes and Hypothesis Testing Report
VerifiedAdded on 2020/06/04
|26
|9312
|28
Report
AI Summary
This report provides a detailed analysis of UK stock market portfolios, focusing on hypothesis testing and the efficient market hypothesis. It begins with an introduction to the efficient market hypothesis and the random walk hypothesis, followed by the calculation of average monthly logarithmic returns for two portfolios, Portfolio A and Portfolio B. The report includes descriptive statistical analysis, graphical representations, and the development and application of a T-test to compare the returns of the two portfolios. The findings indicate a significant mean difference between the returns generated by the two portfolios. The report also compares the results with previous research and provides an appendix with supporting data and analysis, including regression statistics for several companies. The analysis also touches upon the Bayer-Monsanto merger deal.

Hypothesis testing and
essay
essay
Paraphrase This Document
Need a fresh take? Get an instant paraphrase of this document with our AI Paraphraser

TABLE OF CONTENTS
PART A...........................................................................................................................................1
INTRODUCTION...........................................................................................................................1
(A) Efficient market hypothesis and Random Walk hypothesis................................................1
INTERPRETATION OF PORTFOLIO OUTCOMES...................................................................2
(B) Calculation of average monthly logarithmic return of portfolio A and B............................2
c. Development of Hypothesis....................................................................................................7
D Application of T test................................................................................................................7
E. Discussion of findings............................................................................................................8
F Comparison of results with previous research.........................................................................8
REFERENCES................................................................................................................................9
APPENDIX....................................................................................................................................10
PART B..........................................................................................................................................16
INTRODUCTION:........................................................................................................................16
Study on Bayer- Monsanto merger deal:..................................................................................16
CONCLUSION..............................................................................................................................21
REFERENCES..............................................................................................................................23
APPENDIX....................................................................................................................................24
PART A
INTRODUCTION
Analysing the changes and variation took place in the stock market of UK which brings
information among investors and stakeholder for the purpose of investment decisions. In the
present report, there will be discussion based on various portfolio which will be compared with
the FTSE 100 index determining various outcomes through test like, regression and T-test
analysis. Further, this report will also reflect consist of recommendations based on Monsanto
investors as per currency decisions and reforms undertaken by Bayer. Along with this, there will
be analysis on the portfolios of various industries which will be analysed as per examining their
efficiency in performing operations in the capital market. Thus, the efficient portfolio has been
suggested to the investors in making appropriate investment in organisations.
(A) Efficient market hypothesis and Random Walk hypothesis
Efficient Market Hypothesis:
To identify the efficiency of market in context with share value which always reflect the
full information. This determination helps in analysing the efficiency of market on the basis of
intrinsic value of share which were being adjusted instantaneously and rationally to the
announcement of new information (Hamid & et.al., 2017). However, as per considering the
framework of FAMA, which has categorised the s market in 3 segmentations such as:
Weak form efficient: This is the market which represents all historical data as well as
forecasted price movements in application of various statistical tools. It represents the
extra returns made on portfolios (Emenike, 2017). It includes analysis relevant with rate
of return, trading volumes, sequence of past prices etc.
Semi-strong form efficient: This market is consisting of all information which
determines the current stock prices which reflects all historical information which are
publicly available such as annual financial disclosures, dividend pay outs, merger plans
etc.
Strong form efficient market: This is the market which has the strong data based on
which it becomes tough to bit the market (Malhotra, Tandon & Tandon, 2015). It
comprises of current stock value as well as historical data which are along with publicly
available information regarding operations.
Random walk hypothesis:
⊘ This is a preview!⊘
Do you want full access?
Subscribe today to unlock all pages.
Trusted by 1+ million students worldwide

This theory determines that the stock market prices of portfolio will as per the stock
market price which evolve the changes in prices randomly which is unclear and cannot be
predicted (Beskos & et.al., 2015). Considering the opinion of various authors which insist
various disputes in several areas such as:
The ensured collective rational will not perform individually.
There has been limits on the benefits based on allocative efficiency.
Market rationality will never be implied through market efficiency (Sakai & Hukushima,
2016).
INTERPRETATION OF PORTFOLIO OUTCOMES
(B) Calculation of average monthly logarithmic return of portfolio A and B
As per analysing the average monthly returns on the portfolios there will be analysis as
listed in the Appendix A with consideration of following justification such as:
Appendix A
Interpretation:
Considering the above graph on which it can be said that there has been randomly
selected organisation in the portfolios which has reflected the outcomes. Looking through the
data set it can be said that there has been rise in the level of portfolio returns in the beginning as
the companies were performing well during that period. similarly, as per analysing the constant
Paraphrase This Document
Need a fresh take? Get an instant paraphrase of this document with our AI Paraphraser
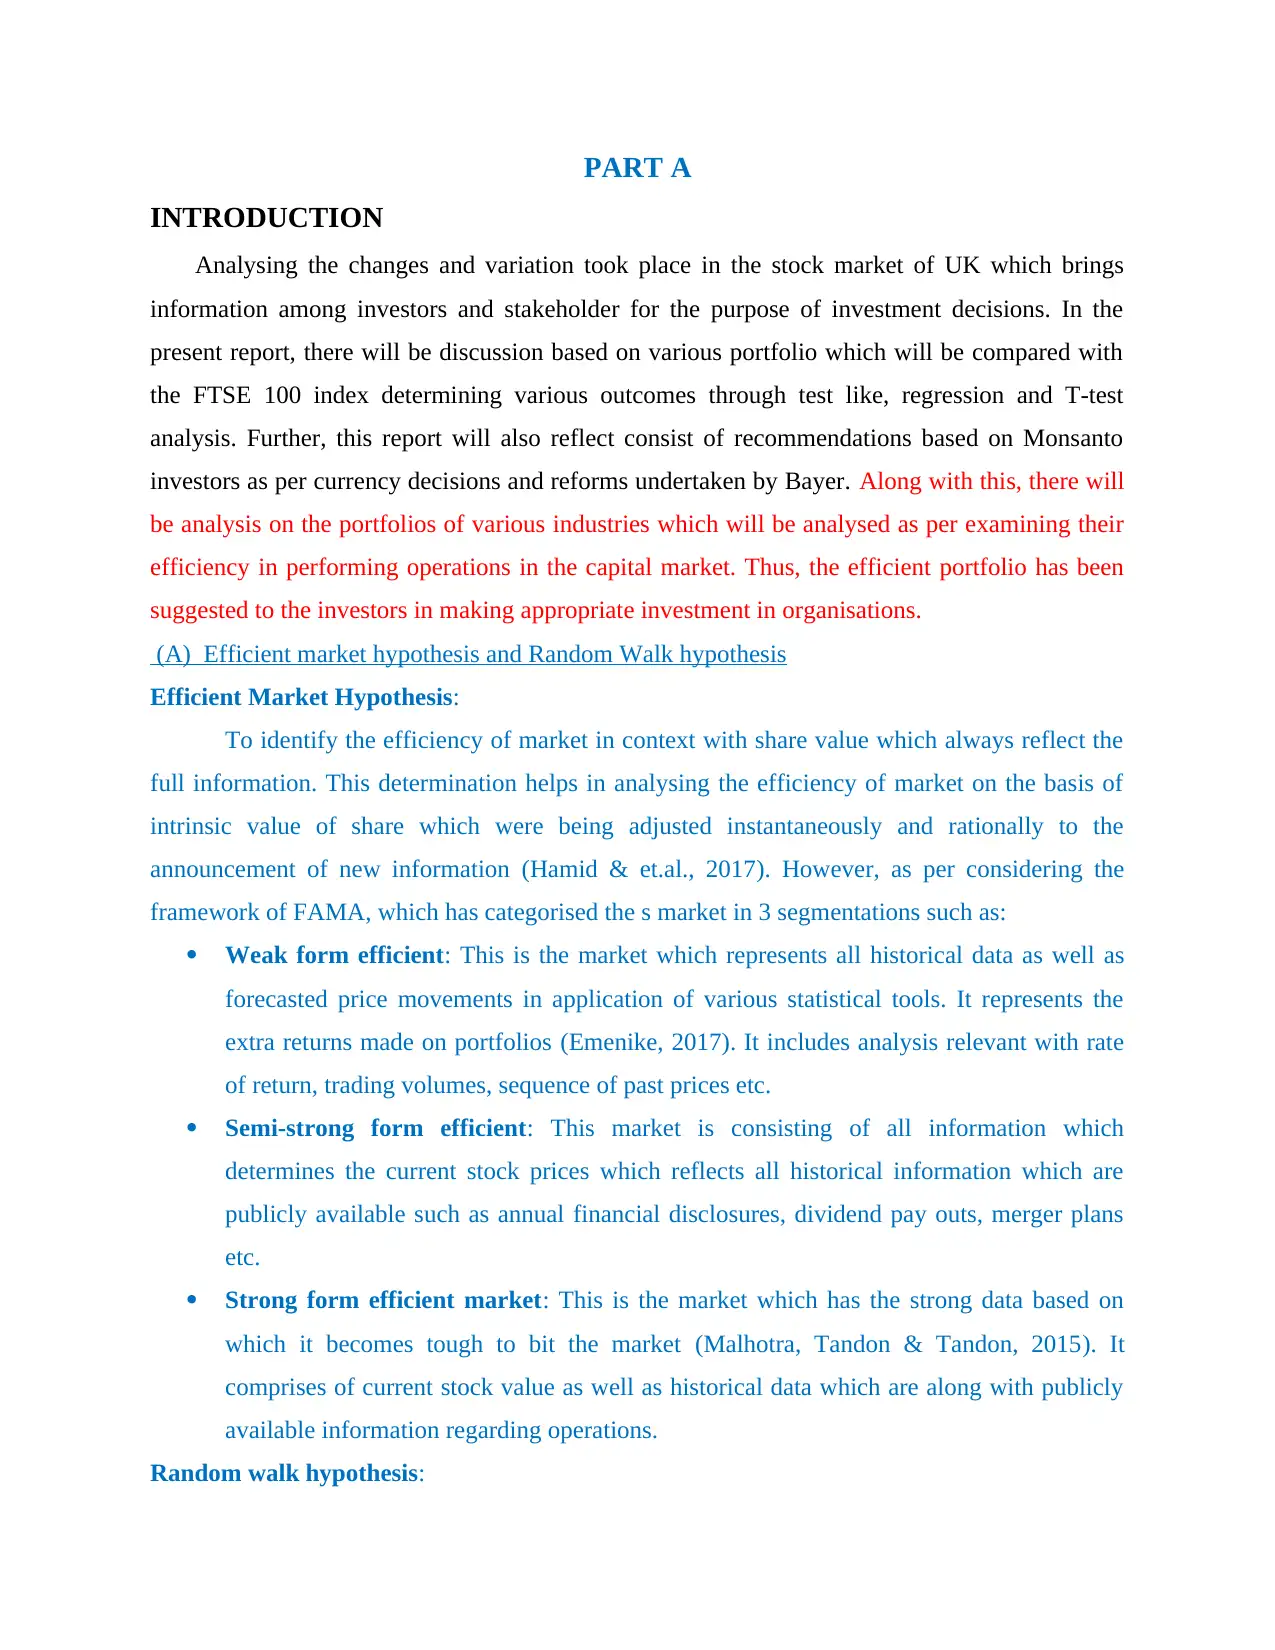
outcomes determined after such peek return on which it can be said that firm has managed their
resources in that manner which brings it a constant return.
Ascertaining the graphical determination on the basis of Portfolio B presentation it can be
said that there are various obstacles which in turn has the outcomes as rise in the level of returns
payable by the companies. Thus, it reflected the three phase such as rise in return, constant
returns for the long period as well as huge downfall. Thus, making investment in this portfolio
will bring a huge risk in connection with having the inapproprioate and inadequate management
of all the operations. the outcomes are unstable and which is not being recommended for
planning the investment in these firms. It can be said that efficiency of this portfolio is not up to
the mark as well as have better performance.
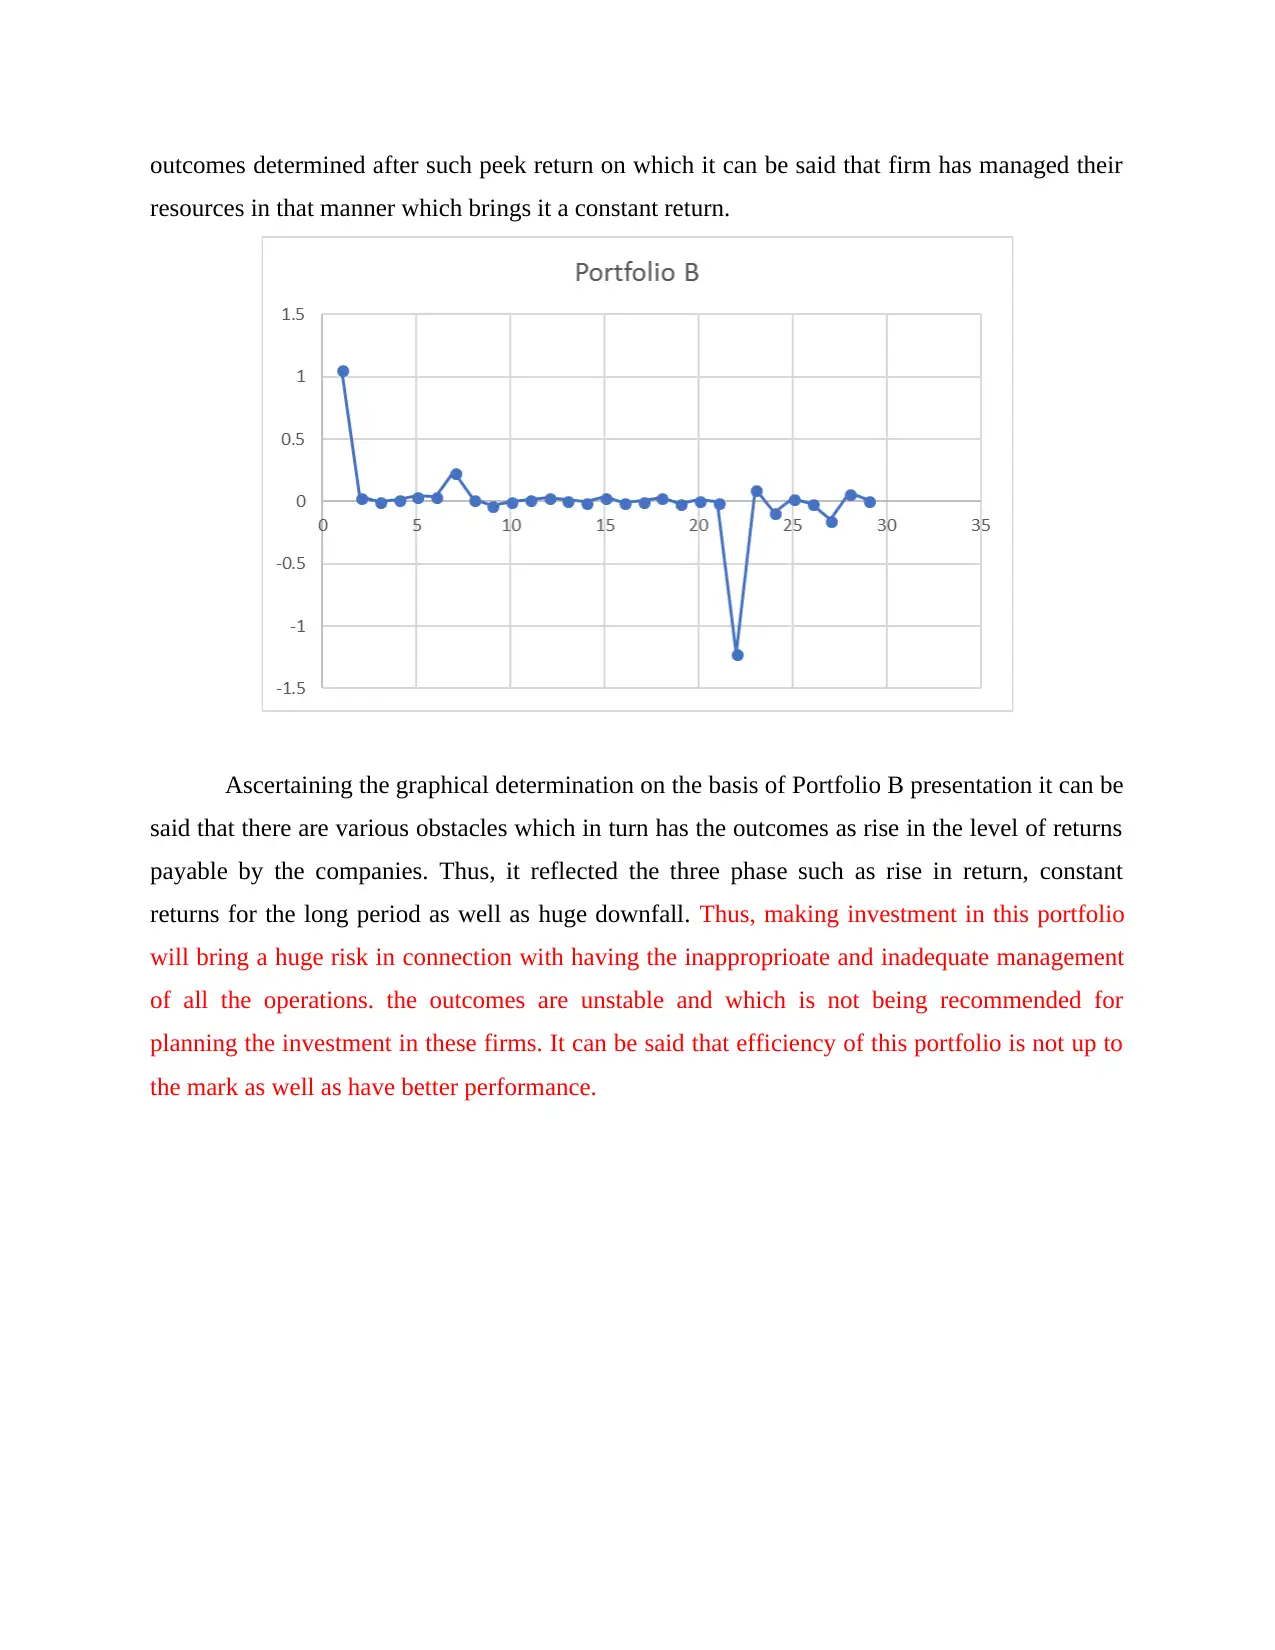
On the basis of above listed outcomes it can be said that the portfolios have appropriate
growth in the period of 2.6 years. However, as per comparing the outcomes on which Portfolio A
has reflected the effective outcomes than Portfolio B. there has a negative fall in the outcomes of
Portfolio B which is not a favourable sign as per making the investing decisions in those
companies. Moreover, it will be suggested to the professionals of such organisation is that they
must have control over their resources and develop effective dividend policies which will be
attractive and effective for them in bringing optimum returns.
Descriptive analysis:
⊘ This is a preview!⊘
Do you want full access?
Subscribe today to unlock all pages.
Trusted by 1+ million students worldwide
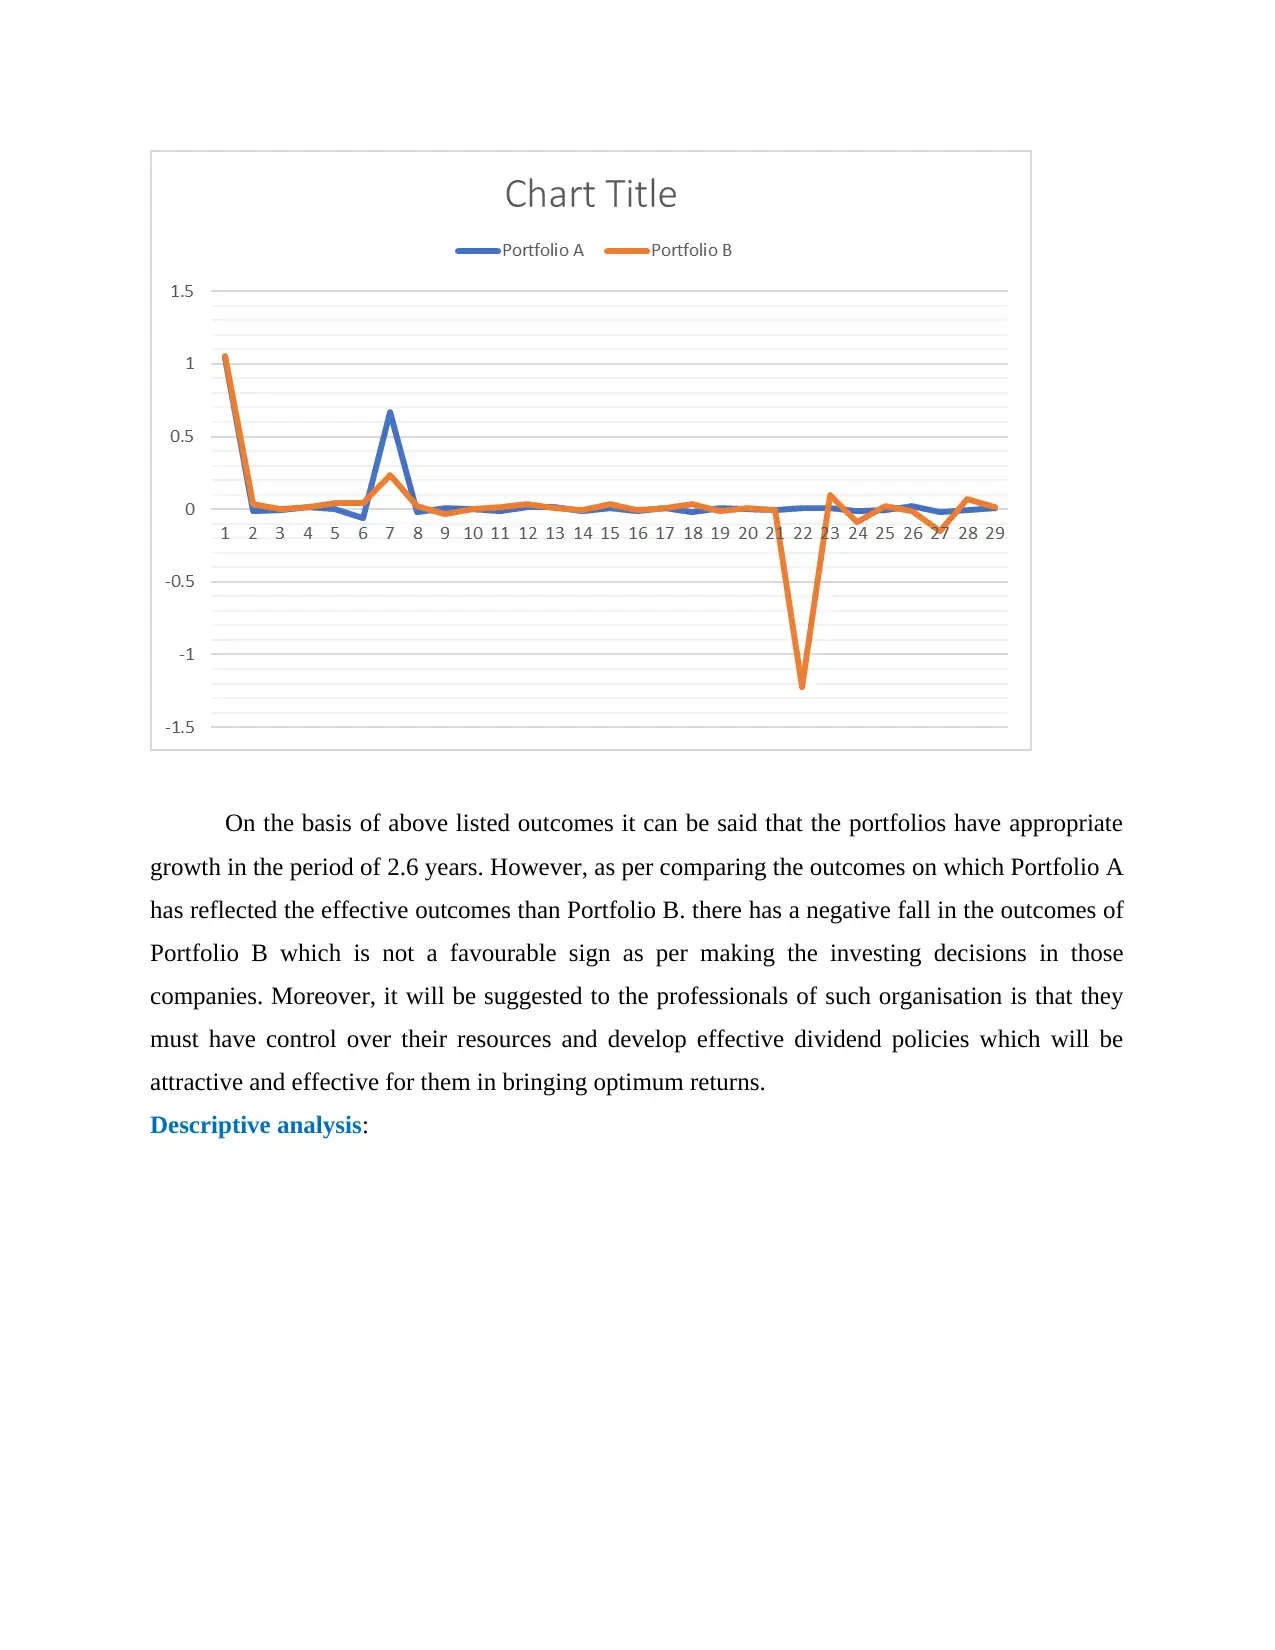
Interpretation: as per analysing the descriptive statistics on the portfolio on which
various outcomes has been determined and demonstrated. The mean value of Portfolio A is
0.0565 while Portfolio B has 0.0094.s It states that Portfolio A will be most profitable and
efficiency for in bringing fruitful returns to the investors. Considering the standard deviation
which states the adequate outcomes in Portfolio A it is 0.22669while in Portfolio B it is 0.311.
NMC Health
Appendix B
Rentokil
Appendix C
Paraphrase This Document
Need a fresh take? Get an instant paraphrase of this document with our AI Paraphraser
ITRK
Appendix D
DCC
Appendix E
FRES
Appendix D
DCC
Appendix E
FRES
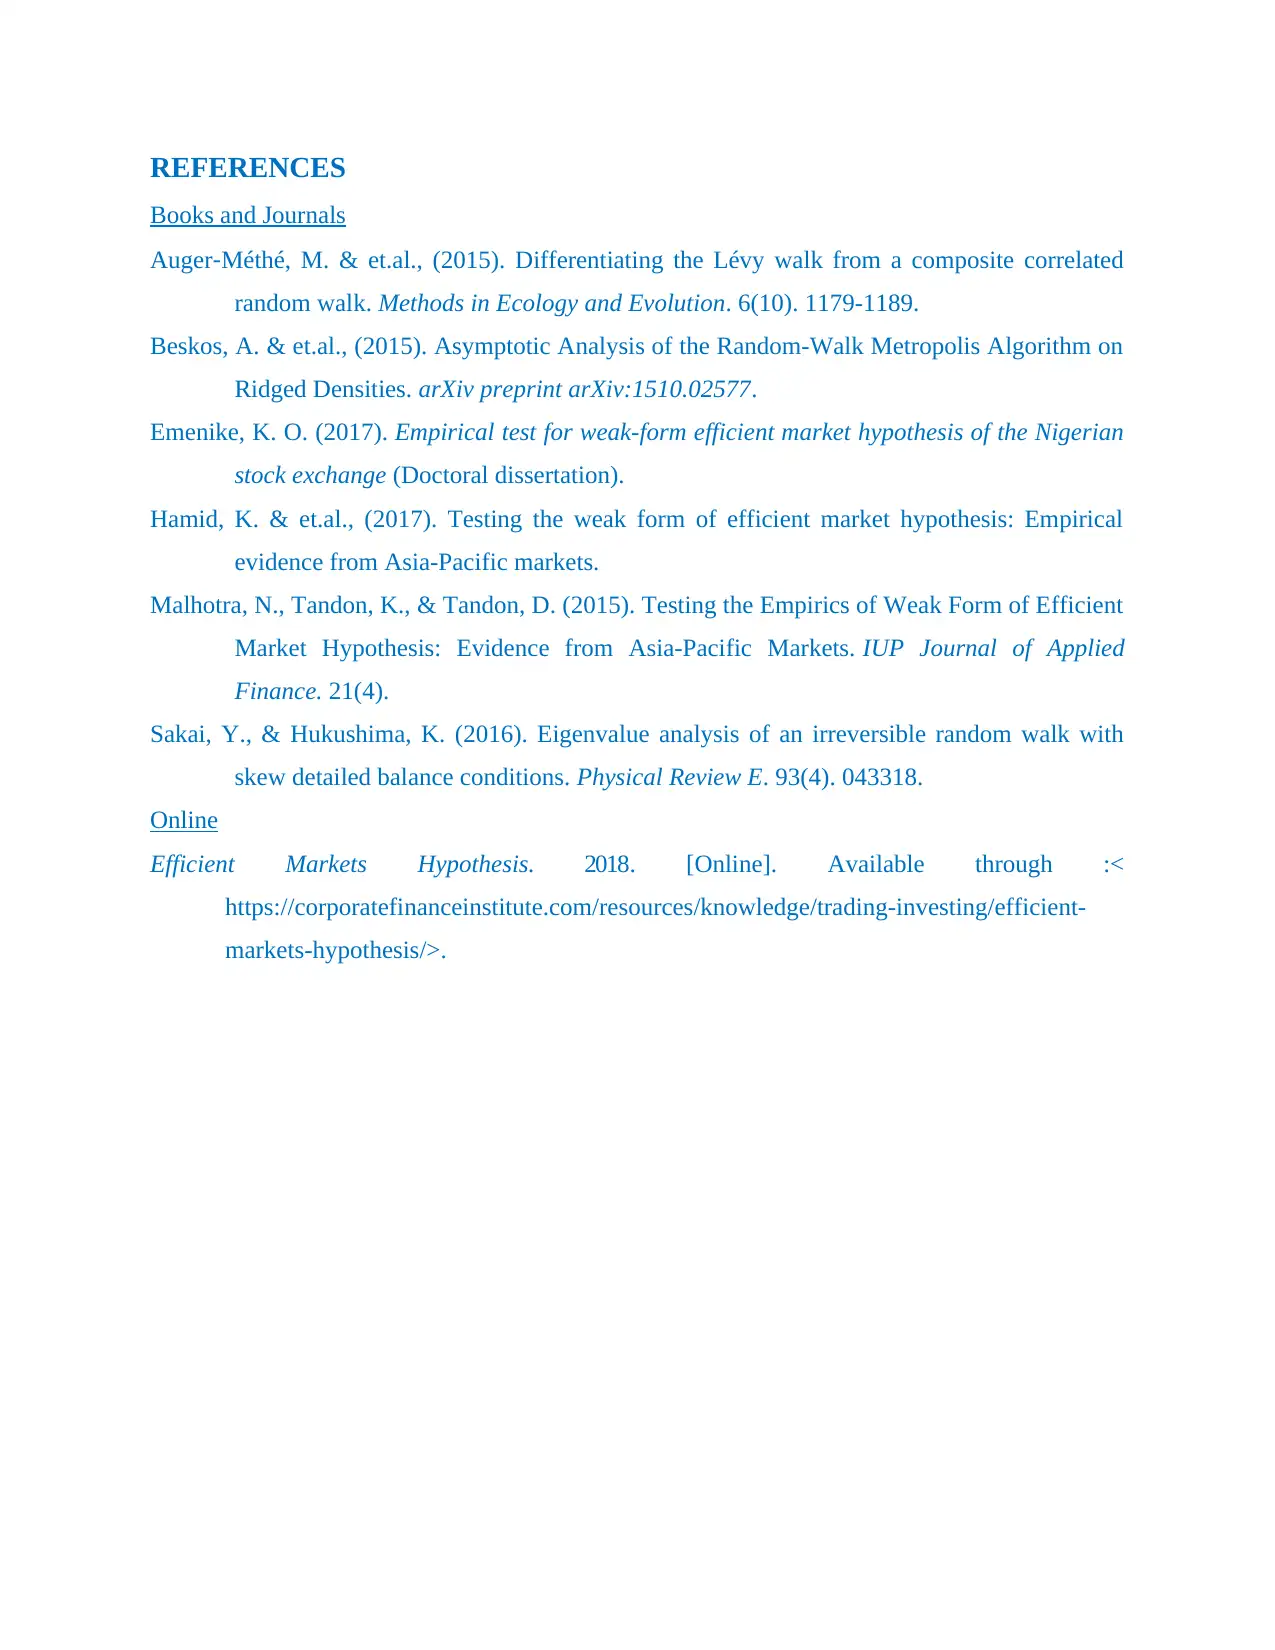
Appendix F
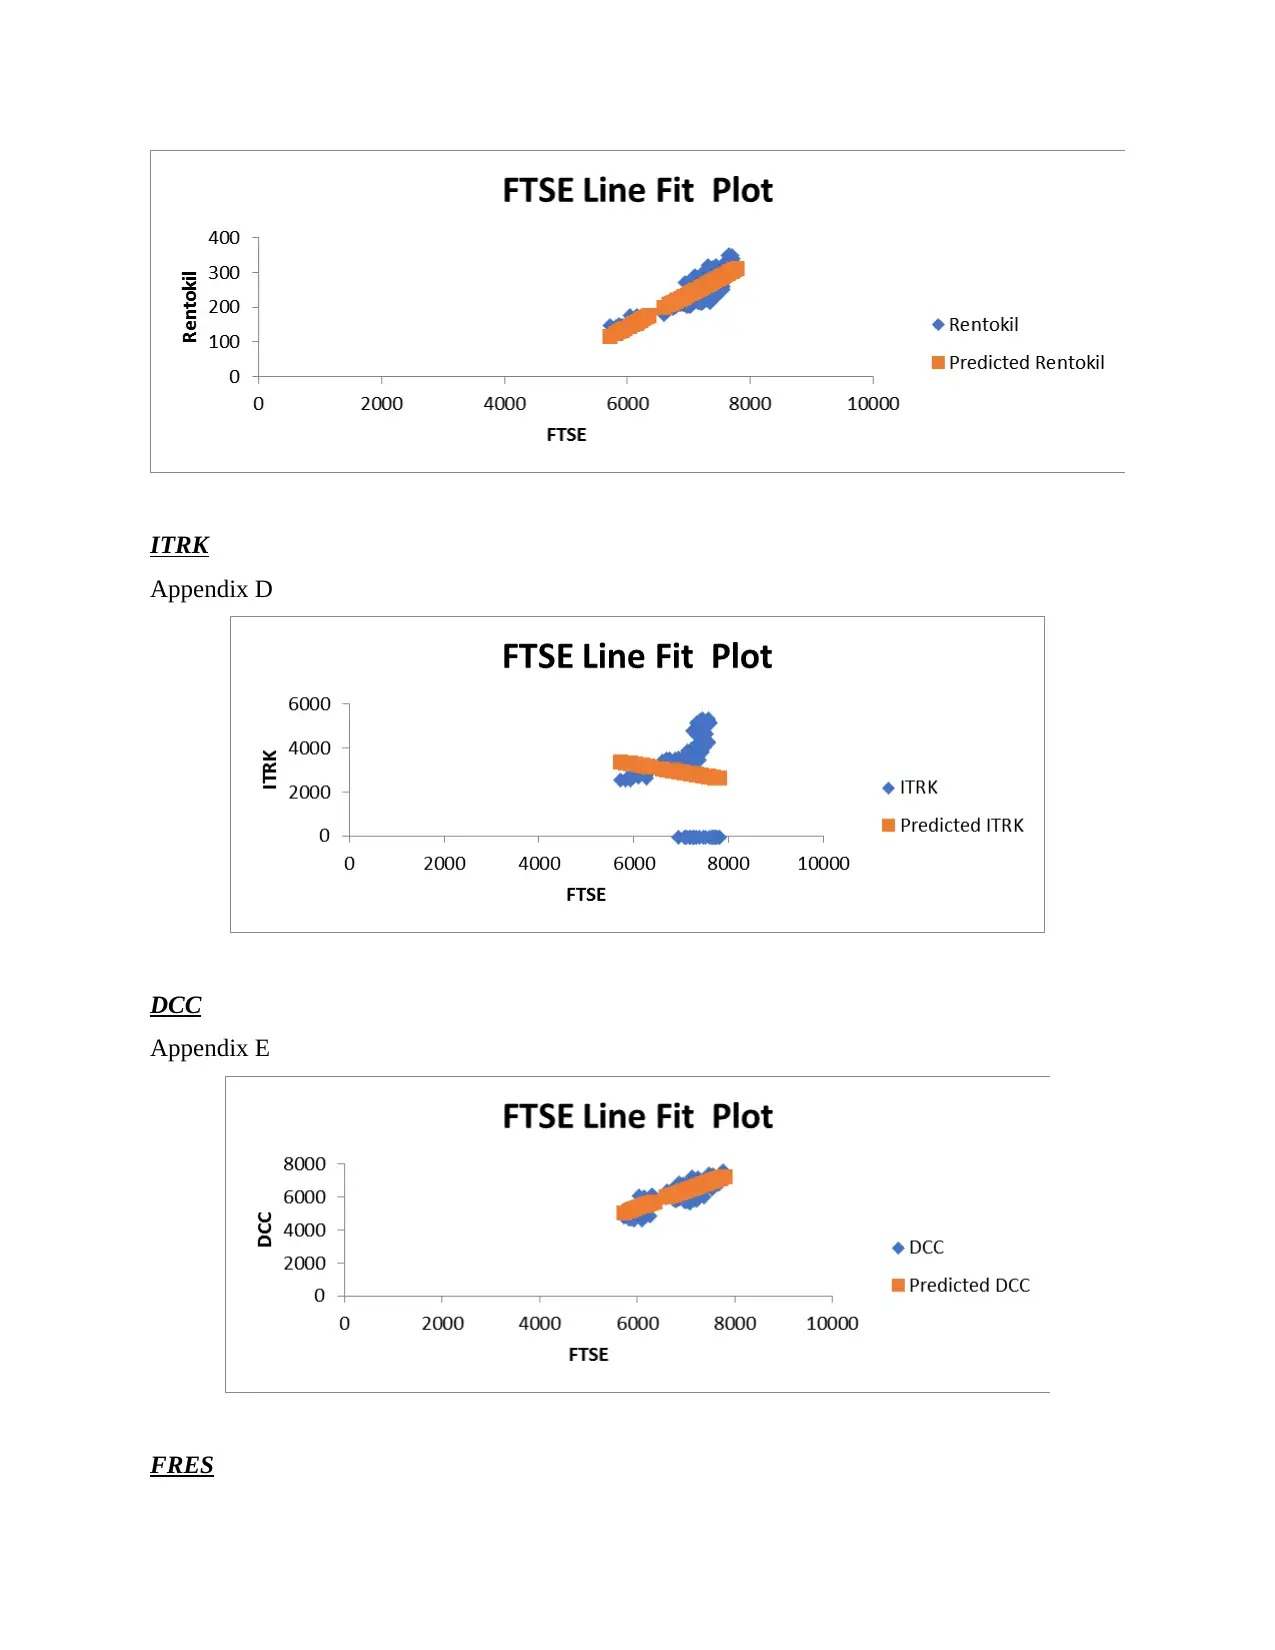
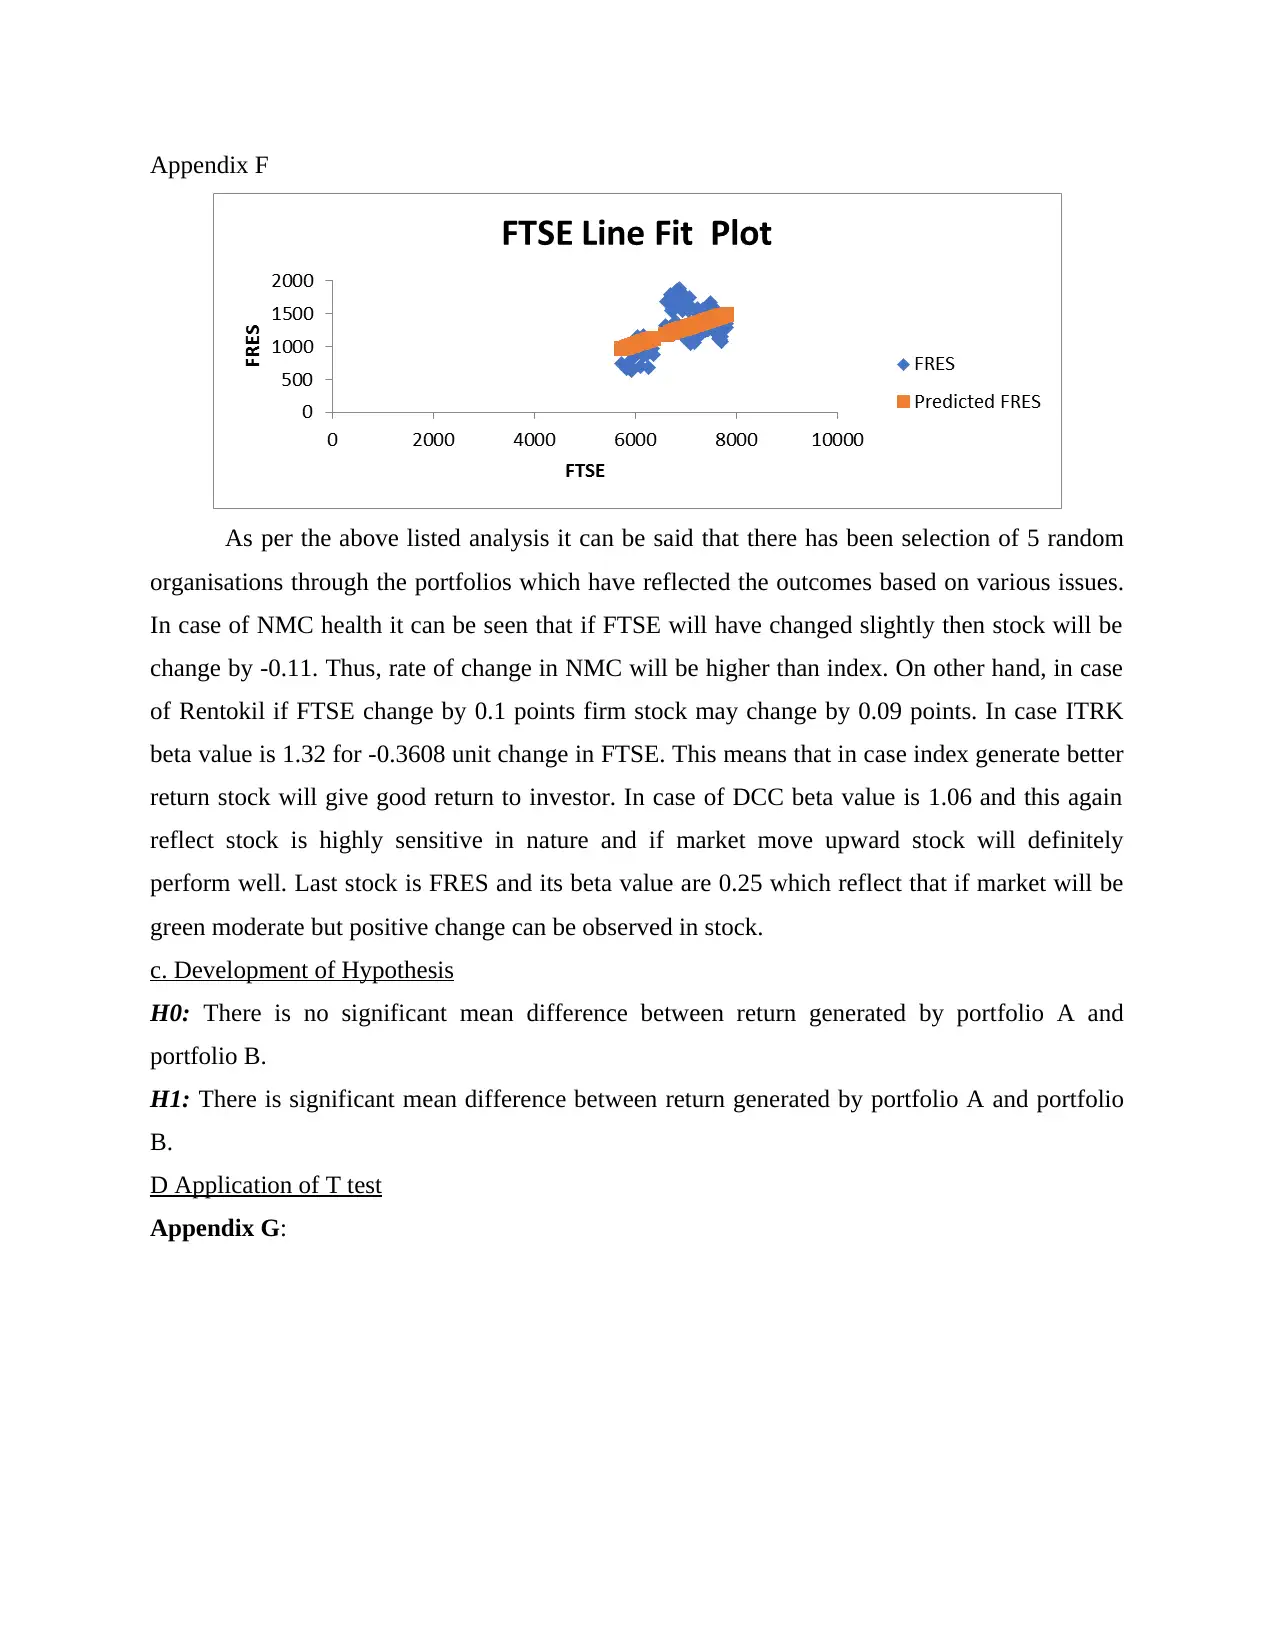
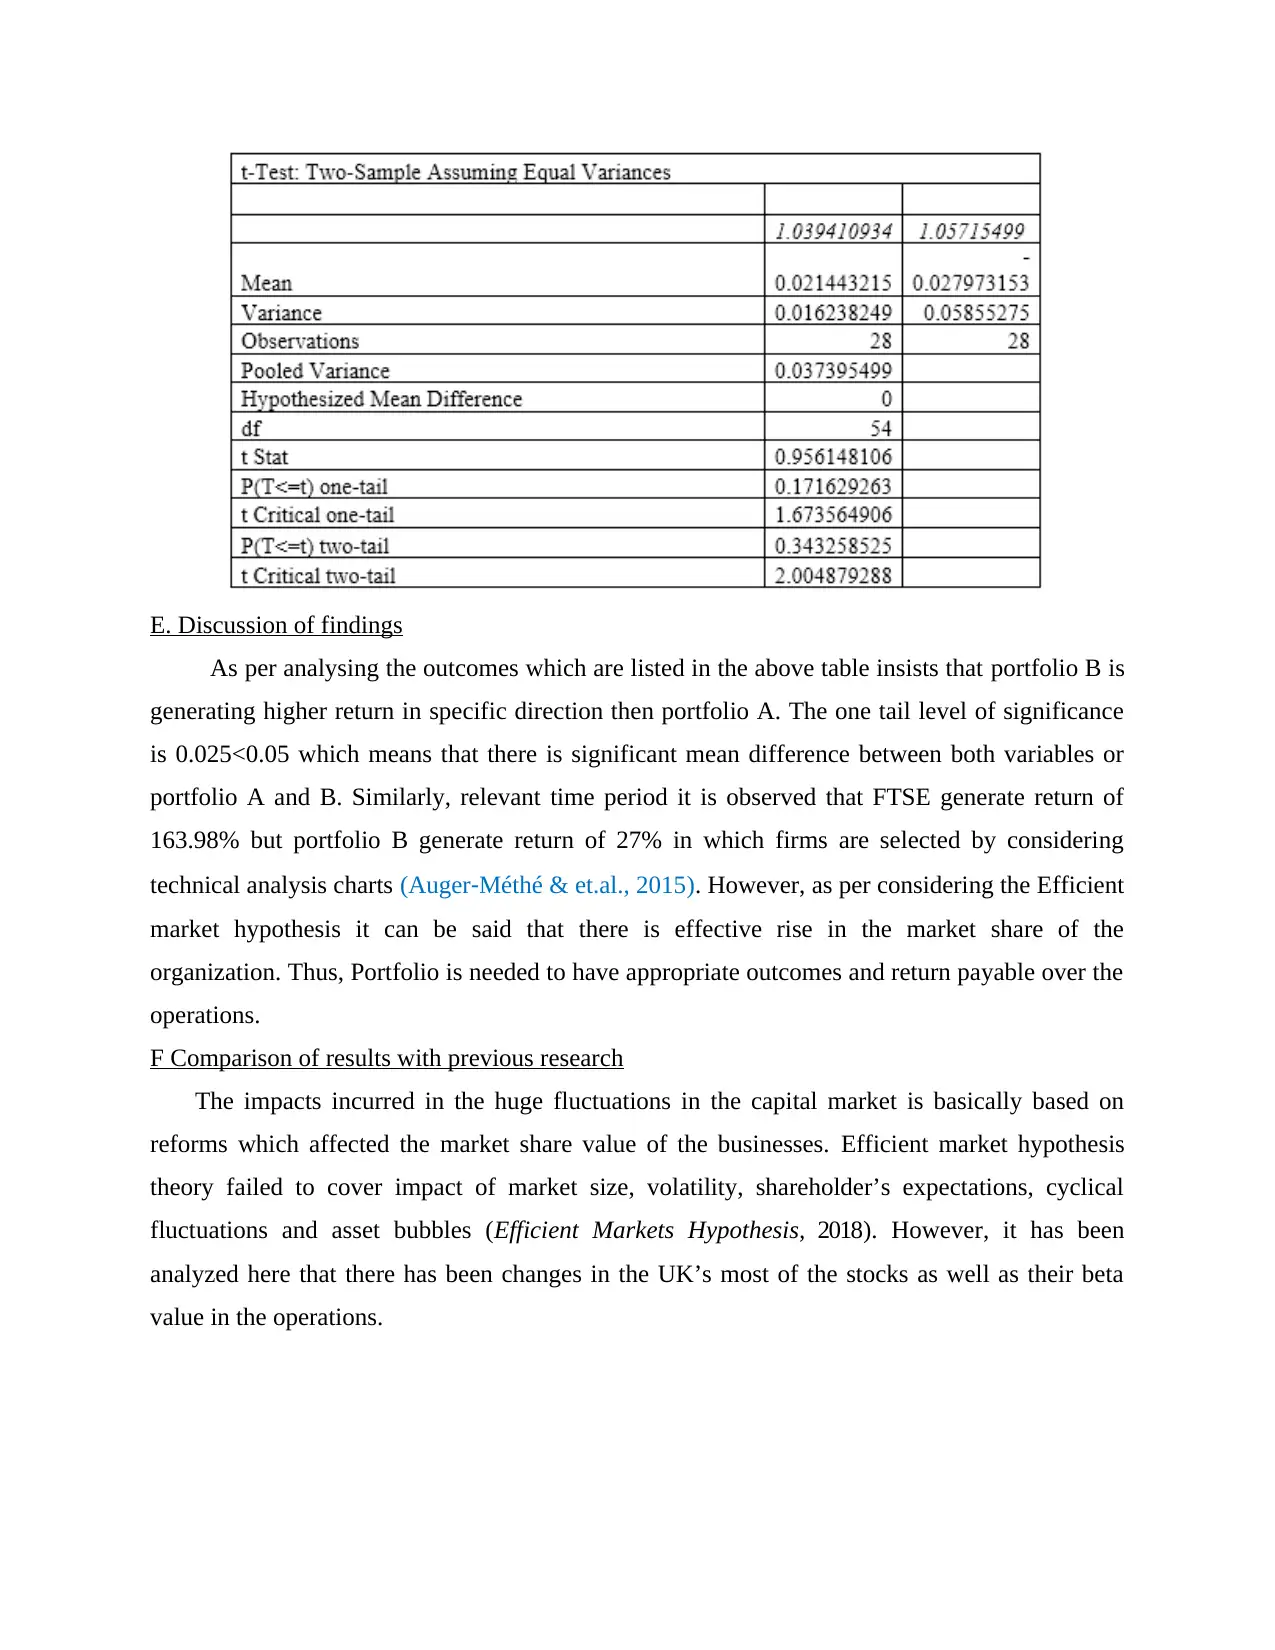
As per the above listed analysis it can be said that there has been selection of 5 random
organisations through the portfolios which have reflected the outcomes based on various issues.
In case of NMC health it can be seen that if FTSE will have changed slightly then stock will be
change by -0.11. Thus, rate of change in NMC will be higher than index. On other hand, in case
of Rentokil if FTSE change by 0.1 points firm stock may change by 0.09 points. In case ITRK
beta value is 1.32 for -0.3608 unit change in FTSE. This means that in case index generate better
return stock will give good return to investor. In case of DCC beta value is 1.06 and this again
reflect stock is highly sensitive in nature and if market move upward stock will definitely
perform well. Last stock is FRES and its beta value are 0.25 which reflect that if market will be
green moderate but positive change can be observed in stock.
c. Development of Hypothesis
H0: There is no significant mean difference between return generated by portfolio A and
portfolio B.
H1: There is significant mean difference between return generated by portfolio A and portfolio
B.
D Application of T test
Appendix G:
⊘ This is a preview!⊘
Do you want full access?
Subscribe today to unlock all pages.
Trusted by 1+ million students worldwide
E. Discussion of findings
As per analysing the outcomes which are listed in the above table insists that portfolio B is
generating higher return in specific direction then portfolio A. The one tail level of significance
is 0.025<0.05 which means that there is significant mean difference between both variables or
portfolio A and B. Similarly, relevant time period it is observed that FTSE generate return of
163.98% but portfolio B generate return of 27% in which firms are selected by considering
technical analysis charts (Auger‐Méthé & et.al., 2015). However, as per considering the Efficient
market hypothesis it can be said that there is effective rise in the market share of the
organization. Thus, Portfolio is needed to have appropriate outcomes and return payable over the
operations.
F Comparison of results with previous research
The impacts incurred in the huge fluctuations in the capital market is basically based on
reforms which affected the market share value of the businesses. Efficient market hypothesis
theory failed to cover impact of market size, volatility, shareholder’s expectations, cyclical
fluctuations and asset bubbles (Efficient Markets Hypothesis, 2018). However, it has been
analyzed here that there has been changes in the UK’s most of the stocks as well as their beta
value in the operations.
Paraphrase This Document
Need a fresh take? Get an instant paraphrase of this document with our AI Paraphraser
REFERENCES
Books and Journals
Auger‐Méthé, M. & et.al., (2015). Differentiating the Lévy walk from a composite correlated
random walk. Methods in Ecology and Evolution. 6(10). 1179-1189.
Beskos, A. & et.al., (2015). Asymptotic Analysis of the Random-Walk Metropolis Algorithm on
Ridged Densities. arXiv preprint arXiv:1510.02577.
Emenike, K. O. (2017). Empirical test for weak-form efficient market hypothesis of the Nigerian
stock exchange (Doctoral dissertation).
Hamid, K. & et.al., (2017). Testing the weak form of efficient market hypothesis: Empirical
evidence from Asia-Pacific markets.
Malhotra, N., Tandon, K., & Tandon, D. (2015). Testing the Empirics of Weak Form of Efficient
Market Hypothesis: Evidence from Asia-Pacific Markets. IUP Journal of Applied
Finance. 21(4).
Sakai, Y., & Hukushima, K. (2016). Eigenvalue analysis of an irreversible random walk with
skew detailed balance conditions. Physical Review E. 93(4). 043318.
Online
Efficient Markets Hypothesis. 2018. [Online]. Available through :<
https://corporatefinanceinstitute.com/resources/knowledge/trading-investing/efficient-
markets-hypothesis/>.
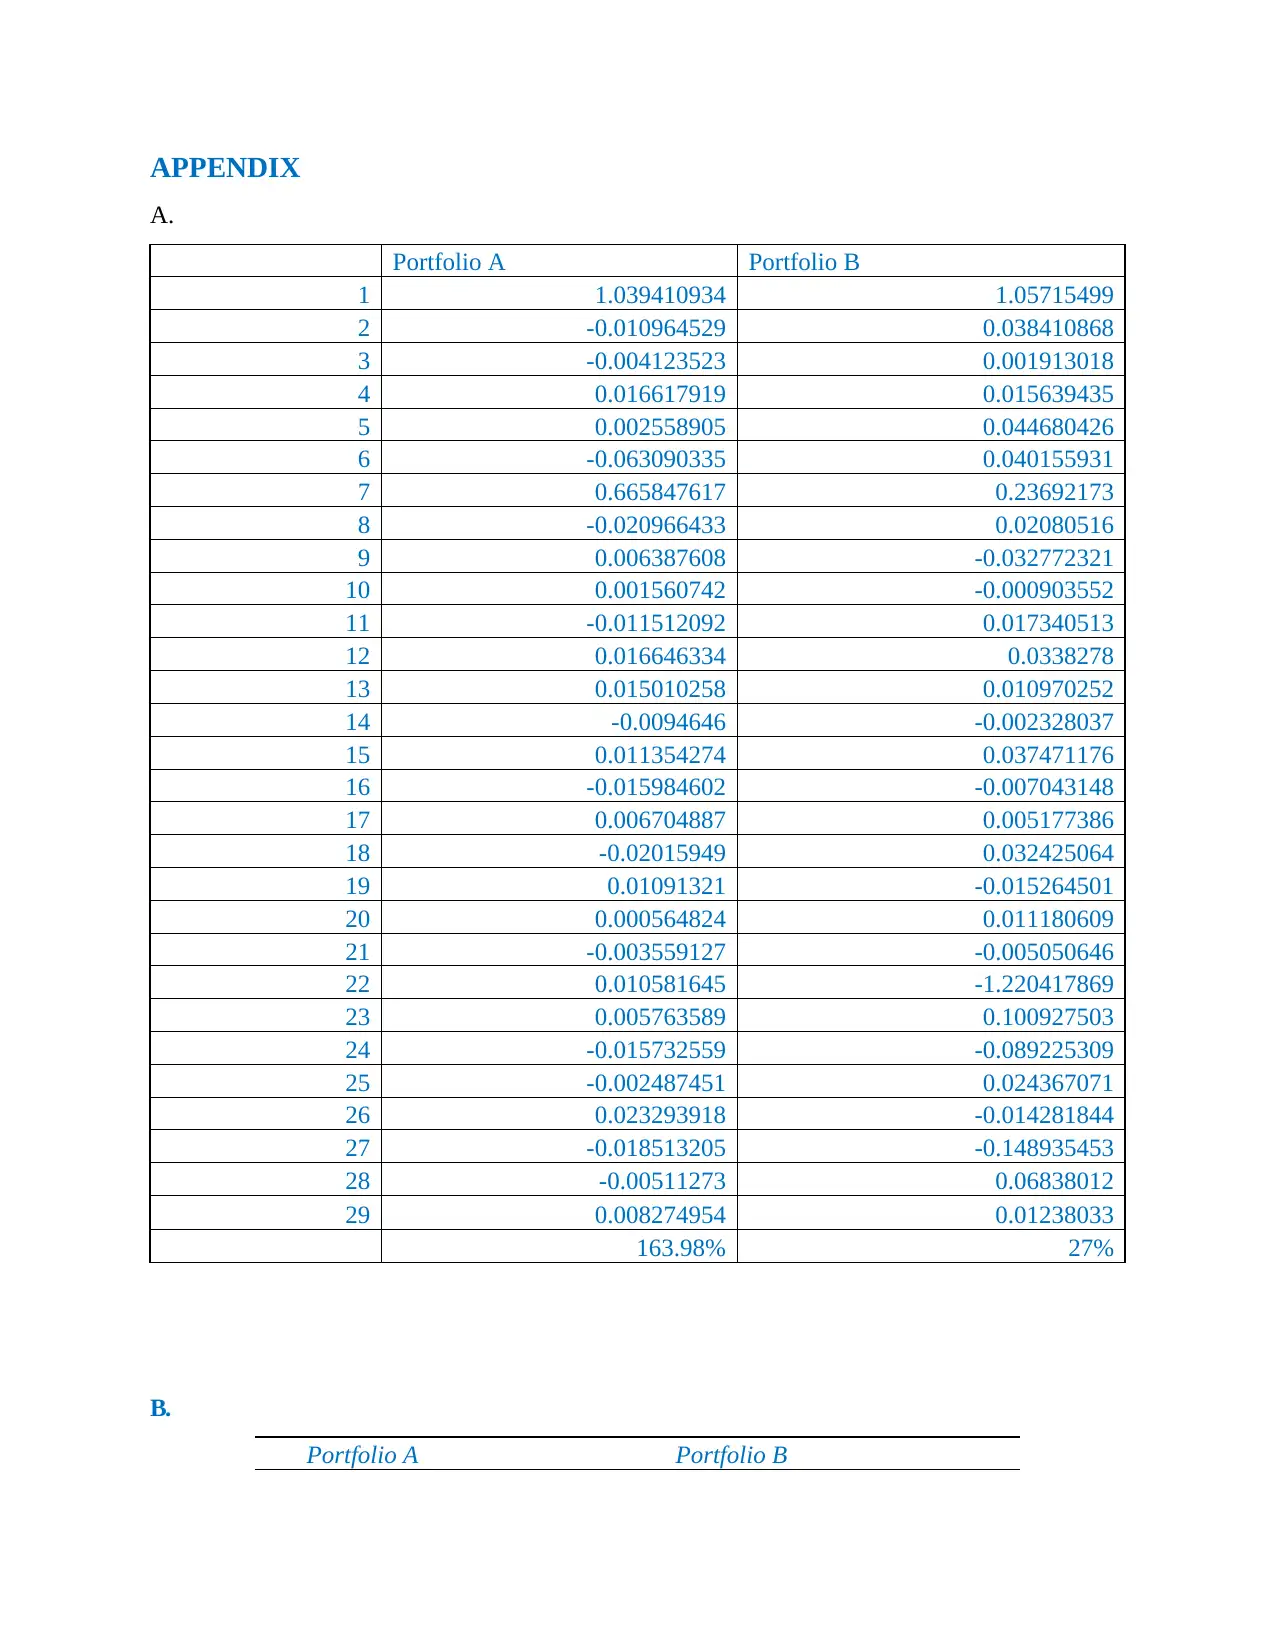
APPENDIX
A.
Portfolio A Portfolio B
1 1.039410934 1.05715499
2 -0.010964529 0.038410868
3 -0.004123523 0.001913018
4 0.016617919 0.015639435
5 0.002558905 0.044680426
6 -0.063090335 0.040155931
7 0.665847617 0.23692173
8 -0.020966433 0.02080516
9 0.006387608 -0.032772321
10 0.001560742 -0.000903552
11 -0.011512092 0.017340513
12 0.016646334 0.0338278
13 0.015010258 0.010970252
14 -0.0094646 -0.002328037
15 0.011354274 0.037471176
16 -0.015984602 -0.007043148
17 0.006704887 0.005177386
18 -0.02015949 0.032425064
19 0.01091321 -0.015264501
20 0.000564824 0.011180609
21 -0.003559127 -0.005050646
22 0.010581645 -1.220417869
23 0.005763589 0.100927503
24 -0.015732559 -0.089225309
25 -0.002487451 0.024367071
26 0.023293918 -0.014281844
27 -0.018513205 -0.148935453
28 -0.00511273 0.06838012
29 0.008274954 0.01238033
163.98% 27%
B.
Portfolio A Portfolio B
⊘ This is a preview!⊘
Do you want full access?
Subscribe today to unlock all pages.
Trusted by 1+ million students worldwide
1 out of 26
Related Documents


Your All-in-One AI-Powered Toolkit for Academic Success.
+13062052269
info@desklib.com
Available 24*7 on WhatsApp / Email
![[object Object]](/_next/static/media/star-bottom.7253800d.svg)
Unlock your academic potential
Copyright © 2020–2026 A2Z Services. All Rights Reserved. Developed and managed by ZUCOL.