Data Analysis of Vaccination Programs: UK, US, and Israel (2021)

Verified

Added on  2022/12/14

|11
|603
|113
Report
AI Summary
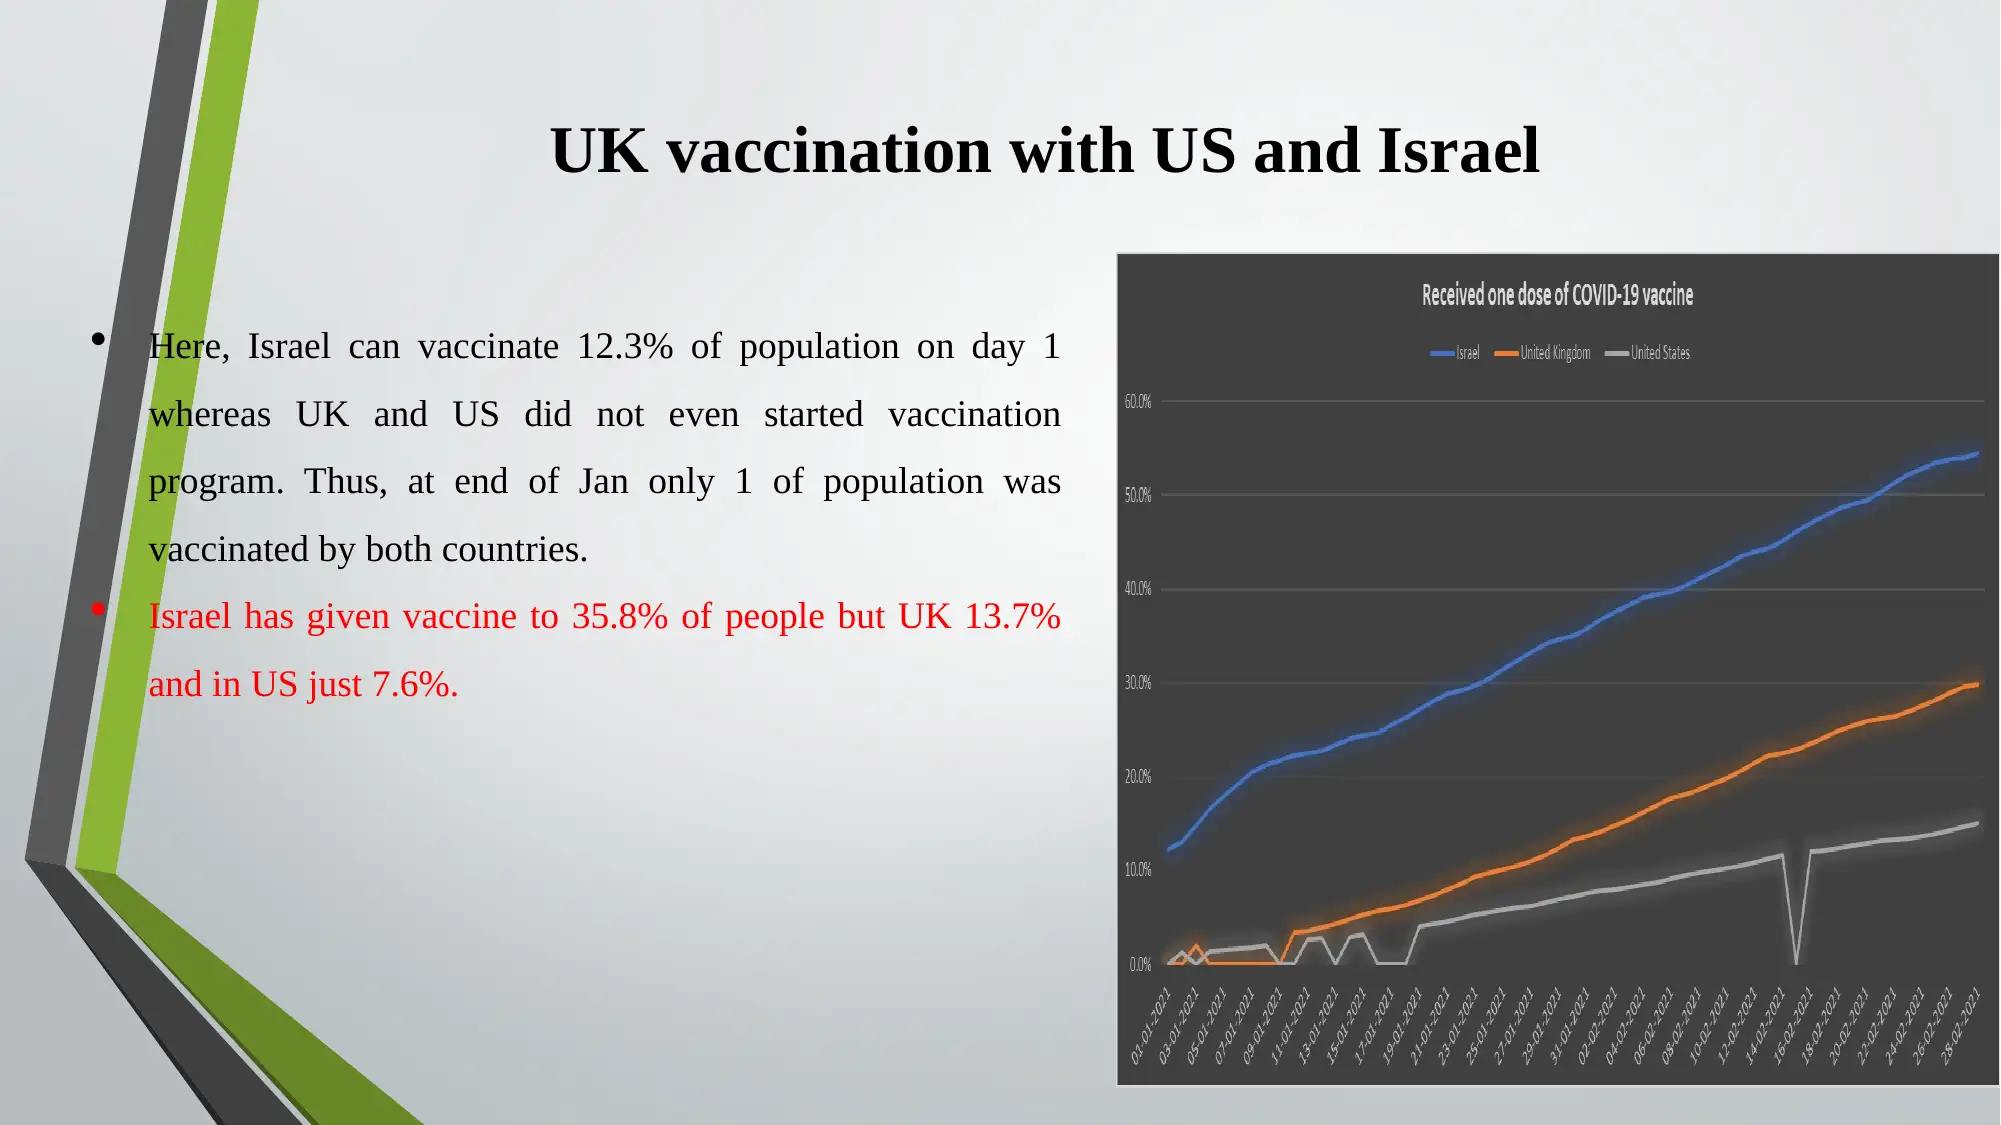
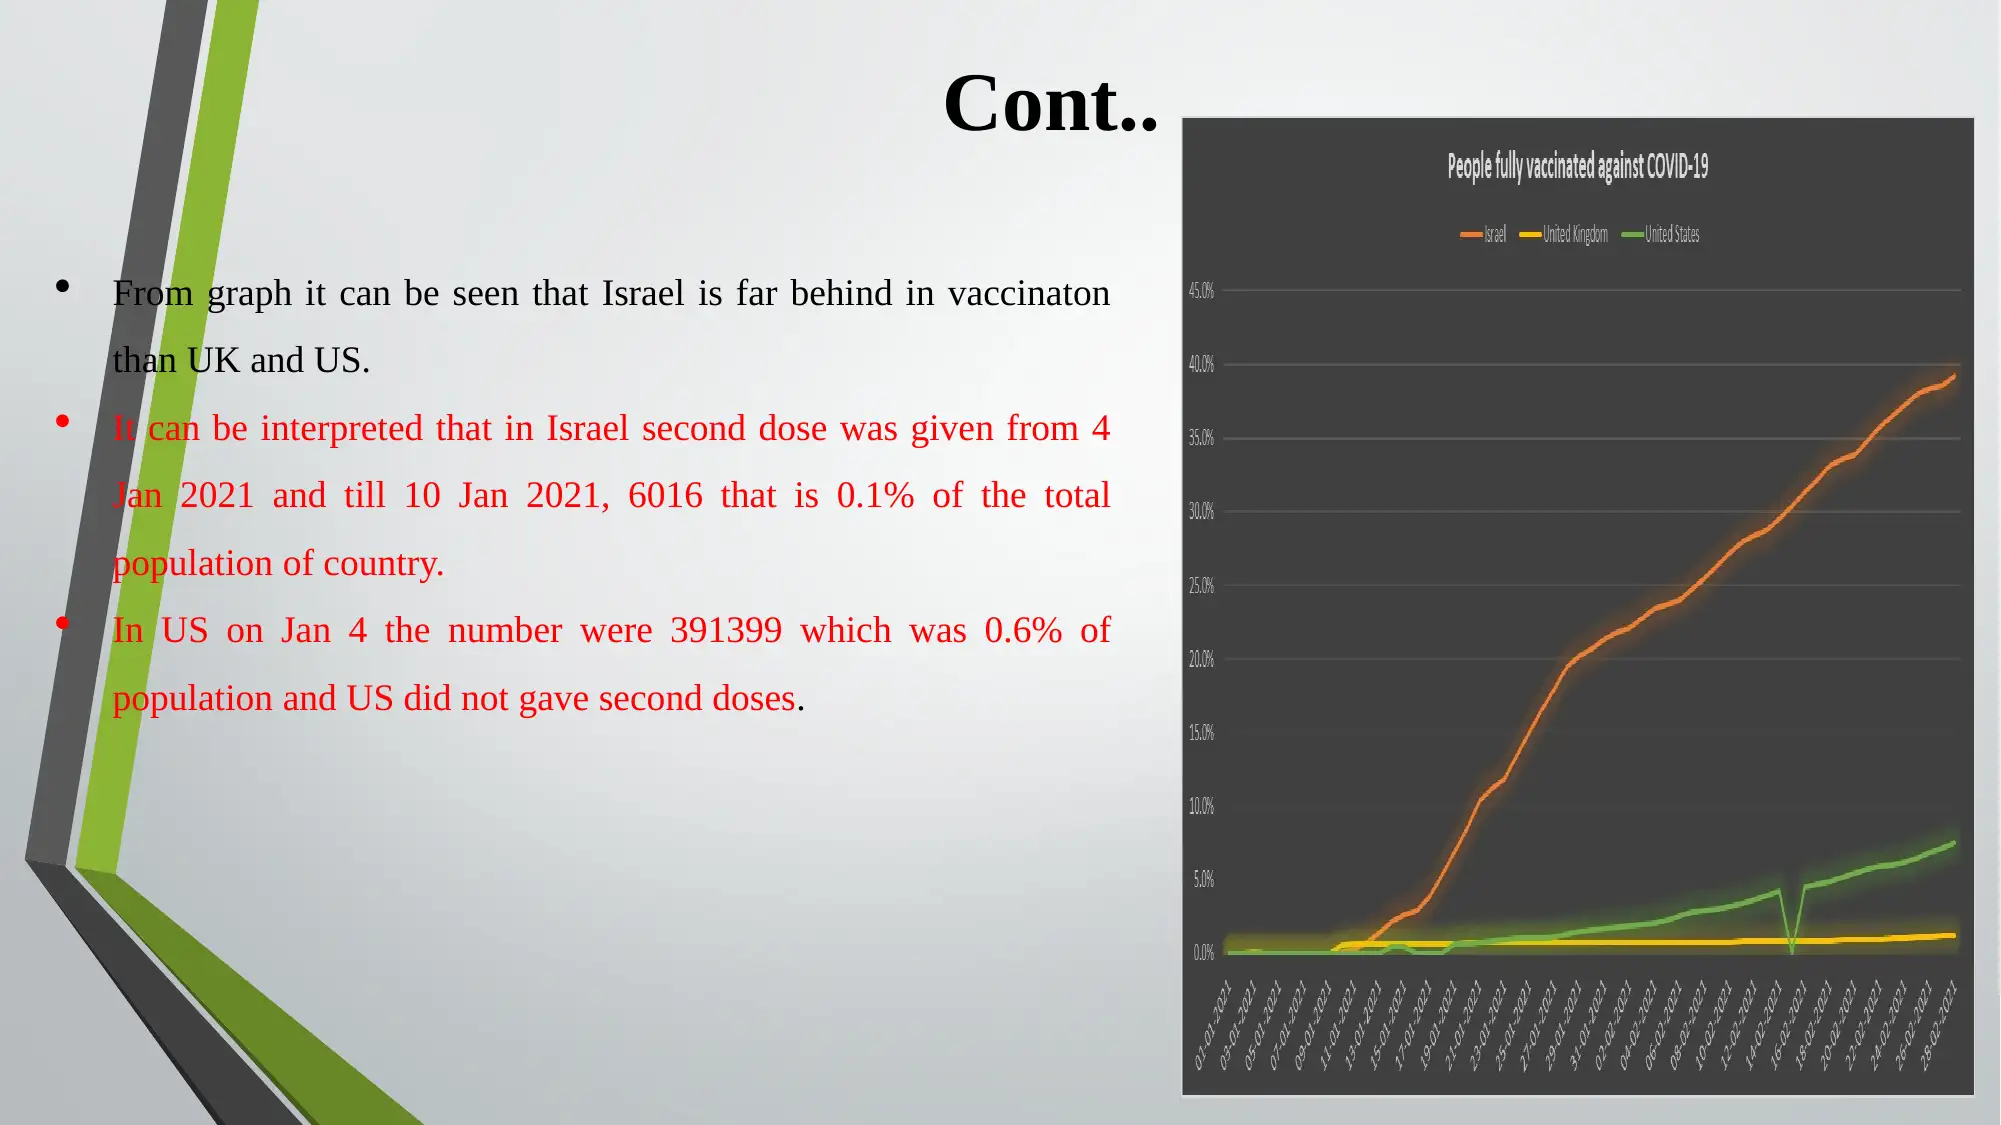
This report provides a data analysis of COVID-19 vaccination programs, focusing on the UK and comparing its progress with the US and Israel. The analysis utilizes data from different sources, including published links, to calculate and compare key metrics such as average daily doses, mean, median, and vaccination percentages. The report highlights discrepancies in the data and presents a comparative analysis of vaccination rates among the three countries. It explores the differences in vaccination timelines, the percentage of the population vaccinated, and the administration of second doses. The report concludes by summarizing the key findings, emphasizing the differences in vaccination approaches and the overall effectiveness of vaccination programs in the UK, US, and Israel. The study utilizes tables, graphs, and statistical techniques to support the analysis and provide a comprehensive overview of the vaccination data.
tabler-icon-diamond-filled.svg

Contribute Materials

Your contribution can guide someone’s learning journey. Share your documents today.
Document Page
Data analysis
tabler-icon-diamond-filled.svg

Secure Best Marks with AI Grader

Need help grading? Try our AI Grader for instant feedback on your assignments.
Document Page
INTRODUCTION
In this PPT it will be described about data analysis of vaccination done in UK. Also, the data of UK will
be compared to country that is US and Israel. For that graphs and tables are made, mean, median, and
some statistical techniques are used in it.
Document Page
People Vaccinated First Dose by Publish Date
People Vaccinated First Dose By Publish
Date
People Vaccinated Second Dose By
Publish Date
Link 1
Link 2
Link 1
Link 2
SUM 545574925 546955355 26569513 26591515
AVERAGE 10911498.5 10724614.8 531390.26 521402.255
COUNT 50 50 50 50
MEDIAN 10730767 10490487 503975 501957
Maximum 20275451 20275451 815816 815816
Minimum 2286572 1380430 391399 22002
Document Page
People Vaccinated Second Dose By Publish Date
Row Labels
Average of new daily doses
website 2 Average of new daily dose webiste 1
Jan 297153.8636 110855.5
Feb 407140.75 364409.7857
Mar 457034.5484 390312.2258
Apr 421374.4737 320650.9474
Grand Total 401115.12 308343.42
tabler-icon-diamond-filled.svg

Secure Best Marks with AI Grader

Need help grading? Try our AI Grader for instant feedback on your assignments.
Document Page
Difference in percentage by vaccinated
population
country
vaccination
percentage
with
population
Israel 57.59%
UK 15.36%
US 25.52% israel UK US
0
10
20
30
40
50
60
70
Series1 vaccination
Document Page
Document Page
UK vaccination with US and Israel
Here, Israel can vaccinate 12.3% of population on day 1
whereas UK and US did not even started vaccination
program. Thus, at end of Jan only 1 of population was
vaccinated by both countries.
Israel has given vaccine to 35.8% of people but UK 13.7%
and in US just 7.6%.
tabler-icon-diamond-filled.svg

Paraphrase This Document

Need a fresh take? Get an instant paraphrase of this document with our AI Paraphraser
Document Page
Cont..
From graph it can be seen that Israel is far behind in vaccinaton
than UK and US.
It can be interpreted that in Israel second dose was given from 4
Jan 2021 and till 10 Jan 2021, 6016 that is 0.1% of the total
population of country.
In US on Jan 4 the number were 391399 which was 0.6% of
population and US did not gave second doses.
Document Page
CONCLUSION
Hereby, it is concluded that there is difference in data given in link 1 and link 2. The mean, median,
average, etc. differs in both links. Thus, it shows difference in daily doses administered by UK since
Jan 1 to April 20.
Besides that, in terms of vaccination of population Israel has vaccinated almost half of their population
as compared to UK and US.
UK has vaccinated 15.3% population while US 25.5 % population. Thus, government of Israel has used
administered more daily doses of vaccine than UK and US.
Document Page
REFERENCES
Liu, X., 2020. Analyzing the impact of user-generated content on B2B Firms' stock performance:
Big data analysis with machine learning methods. Industrial marketing management, 86, pp.30-39.
Meng, Z., and Xia, K., 2020. Weighted persistent homology for biomolecular data
analysis. Scientific reports, 10(1), pp.1-15.
Liu, S. and Rui, Y., 2020. Identification of stealing electricity based on big data analysis. Energy
Reports, 6, pp.731-738.
Burd, H.J. and Potts, D.M., 2020. New data analysis methods for instrumented medium-scale
monopile field tests. Géotechnique, 70(11), pp.961-969.
Chen, B. and Ge, T., 2020. Visual data analysis and simulation prediction for covid-
19. International Journal, 6(1), pp.95-114.
tabler-icon-diamond-filled.svg

Secure Best Marks with AI Grader

Need help grading? Try our AI Grader for instant feedback on your assignments.
Document Page
THANK YOU
chevron_up_icon
1 out of 11
circle_padding
hide_on_mobile
zoom_out_icon
logo.png

Your All-in-One AI-Powered Toolkit for Academic Success.

Available 24*7 on WhatsApp / Email

[object Object]