Business Decision Making Report: UKCBC College Survey Analysis
VerifiedAdded on 2020/02/17
|16
|4995
|82
Report
AI Summary
This report analyzes a student survey conducted at UKCBC College to inform business decision-making. It begins with an introduction to decision-making processes and the role of surveys. Task 1 details the plan for data collection, including survey methodology, sampling frames, and questionnaire design. Task 2 summarizes the collected data using representative values and measures of dispersion, including arithmetic mean, median, and mode, and analyzes the data using statistical techniques. Task 3 presents conclusions drawn from the survey, including trend line analysis. Task 4 explores the use of information processing and financial tools to support decision-making at operational, tactical, and strategic levels. The report offers insights into student satisfaction, college amenities, and areas for improvement, providing a framework for informed decision-making within the college. The report also includes a questionnaire with questions about student satisfaction with studies, college amenities, faculty, environment and facilities, and also asks if students would recommend the college to their friends and relatives.
Business Decision
Making
Making
Paraphrase This Document
Need a fresh take? Get an instant paraphrase of this document with our AI Paraphraser
Table of Contents
INTRODUCTION...........................................................................................................................1
TASK 1............................................................................................................................................1
1.1 Plan for collecting data from students across all campuses..................................................1
1.2 Survey methodology and sampling frame.............................................................................2
1.3 Questionnaire for collecting the data....................................................................................3
TASK 2............................................................................................................................................4
2.1 & 2.2 Summarise the data collected from the survey by using representative values..........4
2.3 Analyse the data using measures of dispersion.....................................................................6
2.4 Explain how you can use quartiles, percentiles and the correlation coefficient to draw
useful Conclusions......................................................................................................................7
TASK 3............................................................................................................................................8
3.1 Conclusions on the survey....................................................................................................8
3.2 Trend lines in spreadsheet graphs to assist in determining any pattern in students
responses.....................................................................................................................................9
3.3 Covered in PPT.....................................................................................................................9
3.4 Formal report suitable for presentation to QAA.................................................................10
TASK 4..........................................................................................................................................11
4.1 & 4.2 Using information processing tools such as computers or software, explain how it
can support decision making at operational, tactical and strategic levels in an organisation...11
4.3 Financial tools for decision making advice a business planning on investing in a project.11
CONCLUSION..............................................................................................................................13
REFERENCES..............................................................................................................................14
INTRODUCTION
Decision making can only be possible in case where the data which is collected through
the survey and other research methodology are reliable. An individual can draft his decision
which is required by him for getting the results for which he is desired of. It can be defined as the
successful plan through which a person can draft some strategies in order to attain his goals and
objectives. In this report, lead student representative for UK college of business and computing
(UKCBC) has been asked to frame a certain survey plan through which it can research over its
survey and through this he can draft a report and present it to Quality Assurance Team. This
report present the elements and concepts which supports the concept that surveys can be helpful
in order to make any decision which has been targeted towards the objectives and goals of any
person who is conducting out such research (Brynjolfsson, Hitt and Kim, 2011).
TASK 1
1.1 Plan for collecting data from students across all campuses
A plan is required to be made for collecting reliable data through the survey. Hence
following procedure should be followed for getting the data which is required for survey:
Early planning: The success of every survey requires a early data planning. Before
doing a survey it is the most important question which should be asked that why the survey is
being done .What are the main objectives of doing the survey (Craft, 2013). What will be the
outcome of the survey and how it will be useful for the enterprise.
Choice of examination methods: Once the early planning has been done this is the most
important step of doing a survey is that deciding the method of collecting the data. The enterprise
should decide what method they will use in collecting the data. Choosing of right method will
help the enterprise in achieving their goals.
Staff and training: Staff and training means that if the survey is on a small basis than the
surveyor can alone do the survey but in the case of an information collecting process which is
conducted on a large basis like in a college than the surveyor need the help of some helpers
which can help the surveyor in collecting information.
Sampling methods: When the sample is selected from a large population than the sample is
selected is on the basis of some common quality in the sample . Like in a college the sample can
be selected on the basis of some common quality like the subject and stream of the students.
1
⊘ This is a preview!⊘
Do you want full access?
Subscribe today to unlock all pages.
Trusted by 1+ million students worldwide
Recruiting subjects: Recruiting subjects means the people who are interested in taking
part of the survey (Fernando and Chowdhury, 2010). The people who got selected from the large
population for doing the sample study will the purpose of doing the study and why the survey is
conducting and also tell all the guidelines like how they have to answer to the questions .
Response rates: Response rates plays a major role in drawing a conclusion of the
survey . If the response rates of the people will high than it will help the surveyor in drawing a
better conclusion on the other hand the problem can be arise in the case of non respondents
people ,if people does not give answers to the questions than it will arise a problem to the
surveyor in drawing a better conclusion.
1.2 Survey methodology and sampling frame
There are a number of methodologies which are designed in a way to achieve the data
which can generated through using various sampling techniques and methods. Survey
methodology can be classified as the research method in which various questions has been asked
to the total population in which they have to make different questionnaires so that they can ask
them various questions which related with their field and subjects. These surveys actually
contain various multiple choice questions in which the students who are studying at college or
any person residing in some locality or any employee of any organisation has to give answer.
Survey methodology have different benefits and several disadvantages also as in this user can get
answers from different people who are from different mind and thinking (Frey, Schulz-Hardt and
Stahlberg, 2013). Hence for using this technique it is required by the user that they have to
possess benefits as well as certain demerits of this methods.
The most common advantage of survey methodology is that it can be used towards any
person who is related with such research survey as well as it will not consume much time as
compared with the other methods through which user can access over the data which is required
for the research and analysis over the students (Gabrielsson and Gabrielsson, 2013). But its most
common disadvantage is that in this there may some chances to get selection of wrong person
who is not a part of research can miss guide the entire research in a wrong direction.
Sampling frame is technique of statistics through which an user can access the data which
is required by him for carrying out the process of research and analysis. Student representative
can use sampling frame in order to carry out the entire research process so that they can frame
out their decision so that they can attain the objectives and goals.
2
Paraphrase This Document
Need a fresh take? Get an instant paraphrase of this document with our AI Paraphraser
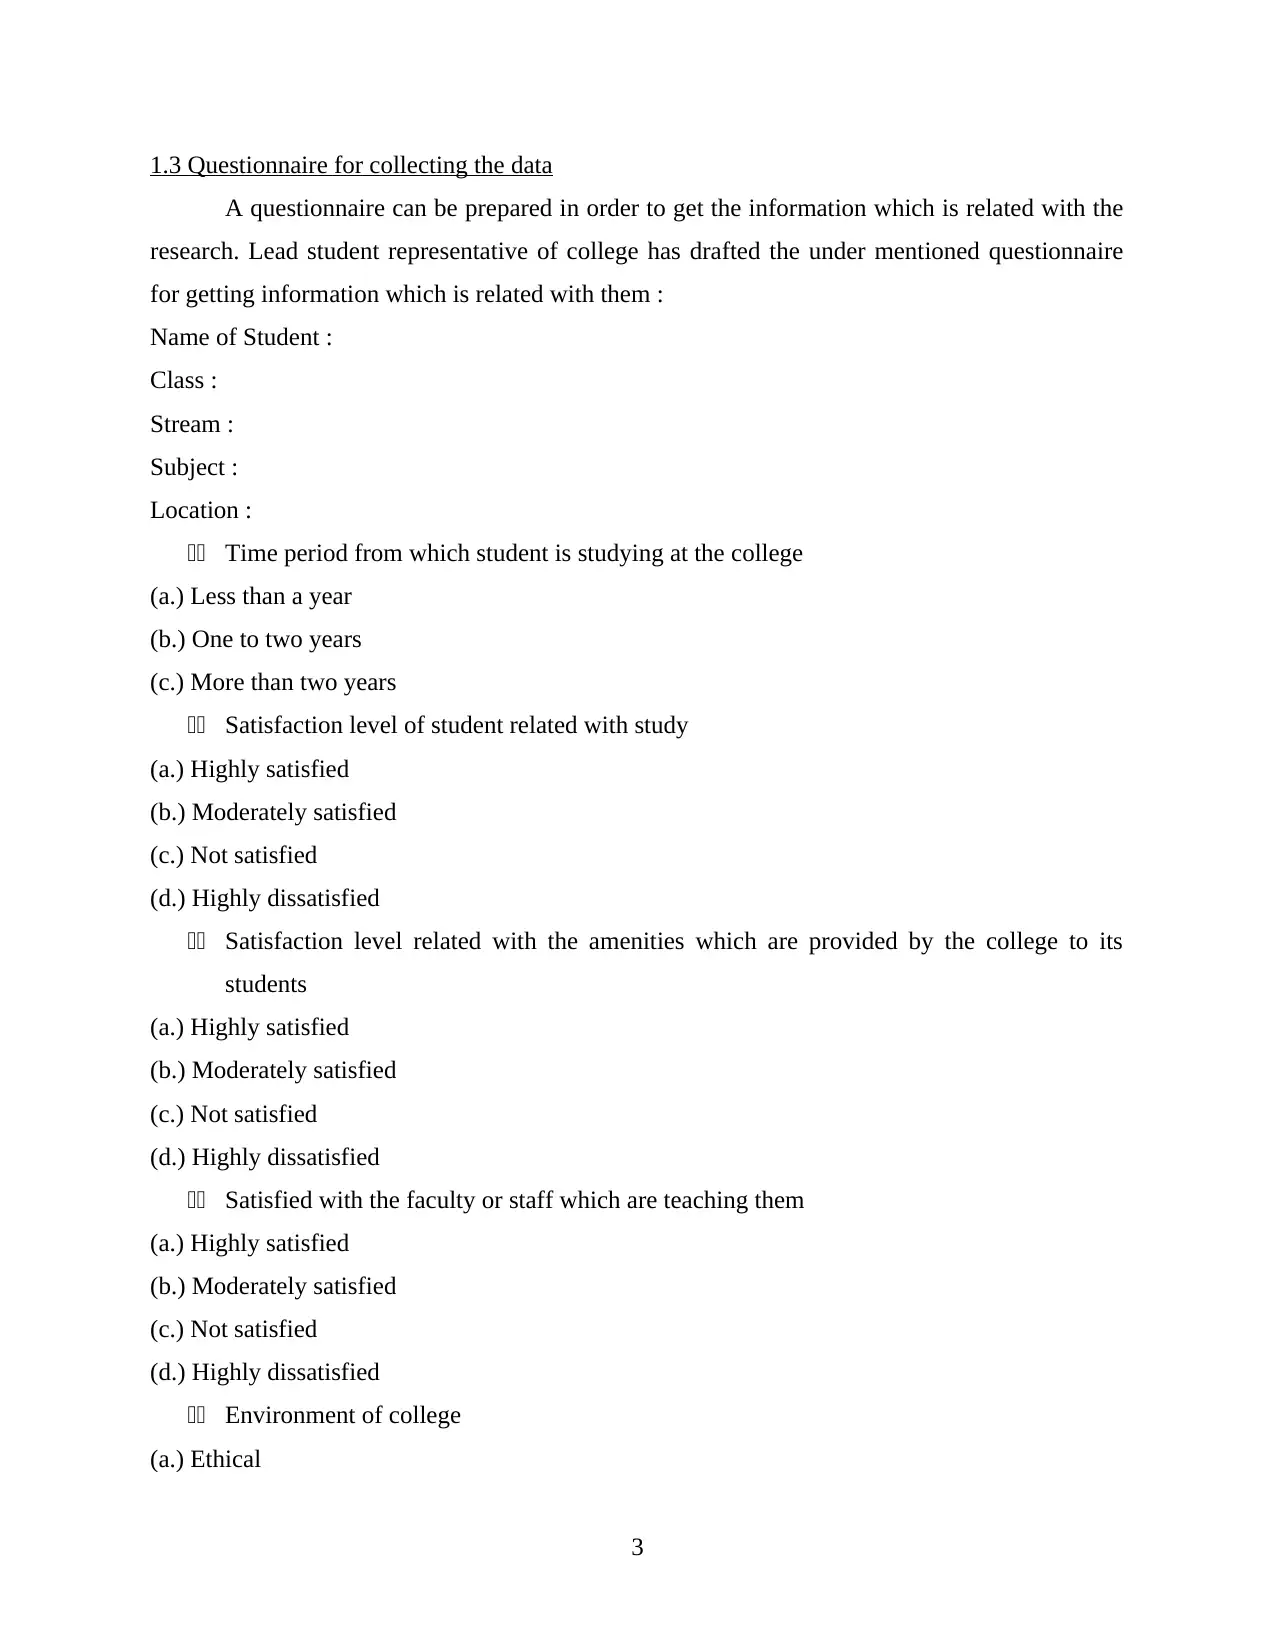
1.3 Questionnaire for collecting the data
A questionnaire can be prepared in order to get the information which is related with the
research. Lead student representative of college has drafted the under mentioned questionnaire
for getting information which is related with them :
Name of Student :
Class :
Stream :
Subject :
Location :
11 Time period from which student is studying at the college
(a.) Less than a year
(b.) One to two years
(c.) More than two years
11 Satisfaction level of student related with study
(a.) Highly satisfied
(b.) Moderately satisfied
(c.) Not satisfied
(d.) Highly dissatisfied
11 Satisfaction level related with the amenities which are provided by the college to its
students
(a.) Highly satisfied
(b.) Moderately satisfied
(c.) Not satisfied
(d.) Highly dissatisfied
11 Satisfied with the faculty or staff which are teaching them
(a.) Highly satisfied
(b.) Moderately satisfied
(c.) Not satisfied
(d.) Highly dissatisfied
11 Environment of college
(a.) Ethical
3
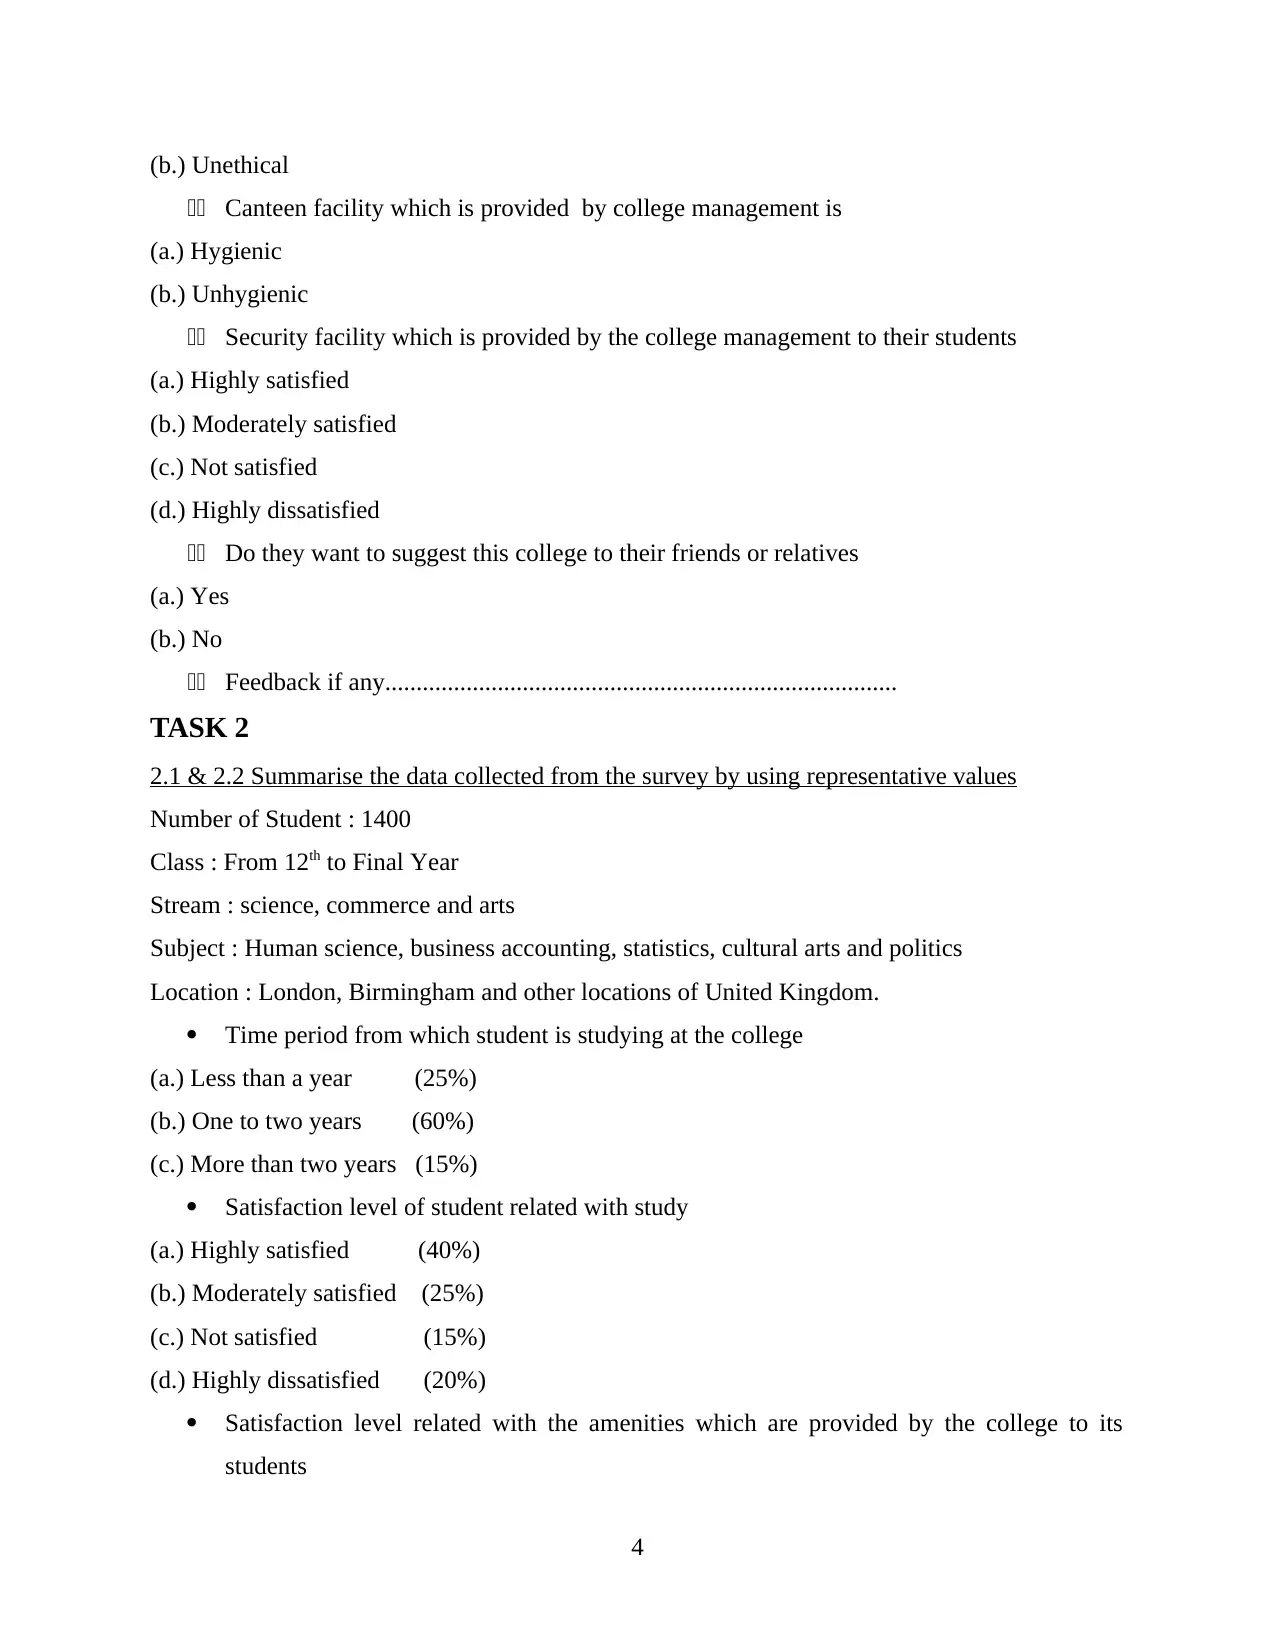
(b.) Unethical
11 Canteen facility which is provided by college management is
(a.) Hygienic
(b.) Unhygienic
11 Security facility which is provided by the college management to their students
(a.) Highly satisfied
(b.) Moderately satisfied
(c.) Not satisfied
(d.) Highly dissatisfied
11 Do they want to suggest this college to their friends or relatives
(a.) Yes
(b.) No
11 Feedback if any..................................................................................
TASK 2
2.1 & 2.2 Summarise the data collected from the survey by using representative values
Number of Student : 1400
Class : From 12th to Final Year
Stream : science, commerce and arts
Subject : Human science, business accounting, statistics, cultural arts and politics
Location : London, Birmingham and other locations of United Kingdom.
Time period from which student is studying at the college
(a.) Less than a year (25%)
(b.) One to two years (60%)
(c.) More than two years (15%)
Satisfaction level of student related with study
(a.) Highly satisfied (40%)
(b.) Moderately satisfied (25%)
(c.) Not satisfied (15%)
(d.) Highly dissatisfied (20%)
Satisfaction level related with the amenities which are provided by the college to its
students
4
⊘ This is a preview!⊘
Do you want full access?
Subscribe today to unlock all pages.
Trusted by 1+ million students worldwide
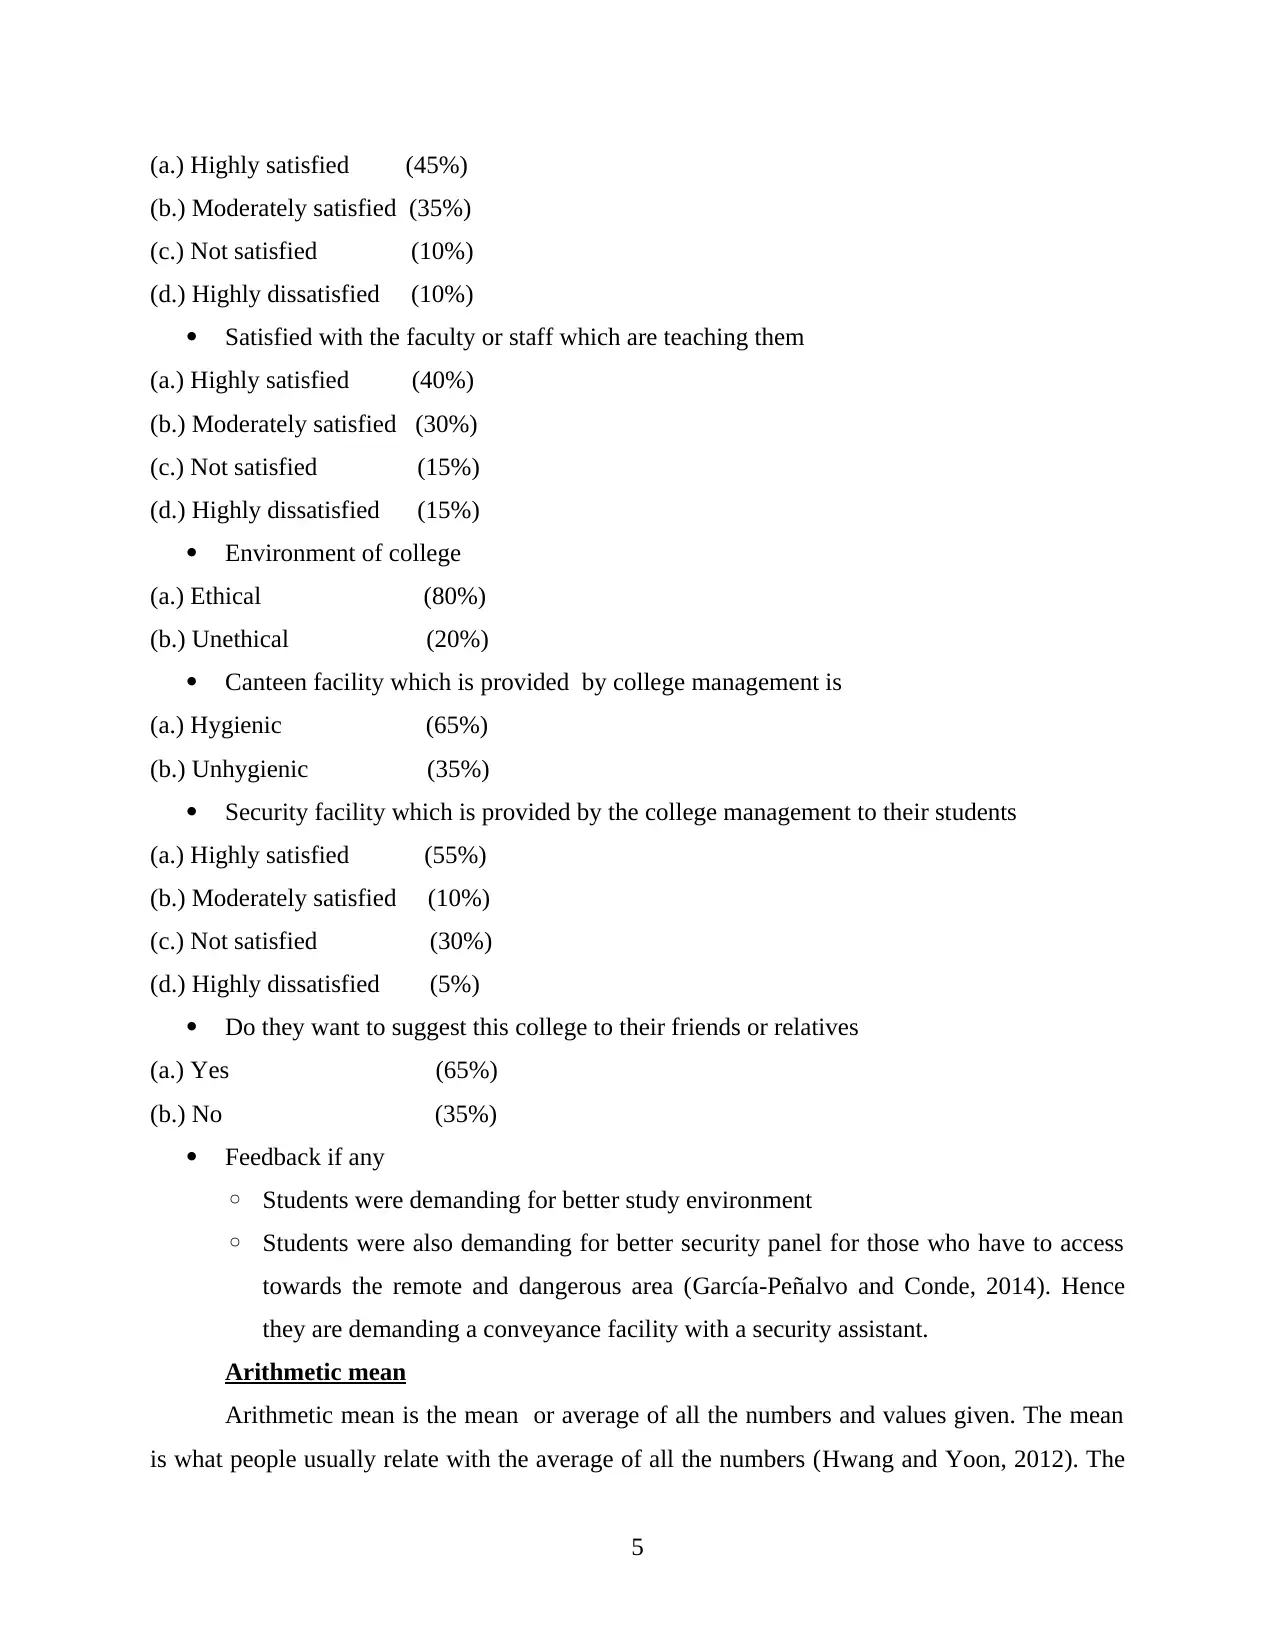
(a.) Highly satisfied (45%)
(b.) Moderately satisfied (35%)
(c.) Not satisfied (10%)
(d.) Highly dissatisfied (10%)
Satisfied with the faculty or staff which are teaching them
(a.) Highly satisfied (40%)
(b.) Moderately satisfied (30%)
(c.) Not satisfied (15%)
(d.) Highly dissatisfied (15%)
Environment of college
(a.) Ethical (80%)
(b.) Unethical (20%)
Canteen facility which is provided by college management is
(a.) Hygienic (65%)
(b.) Unhygienic (35%)
Security facility which is provided by the college management to their students
(a.) Highly satisfied (55%)
(b.) Moderately satisfied (10%)
(c.) Not satisfied (30%)
(d.) Highly dissatisfied (5%)
Do they want to suggest this college to their friends or relatives
(a.) Yes (65%)
(b.) No (35%)
Feedback if any
◦ Students were demanding for better study environment
◦ Students were also demanding for better security panel for those who have to access
towards the remote and dangerous area (García-Peñalvo and Conde, 2014). Hence
they are demanding a conveyance facility with a security assistant.
Arithmetic mean
Arithmetic mean is the mean or average of all the numbers and values given. The mean
is what people usually relate with the average of all the numbers (Hwang and Yoon, 2012). The
5
Paraphrase This Document
Need a fresh take? Get an instant paraphrase of this document with our AI Paraphraser
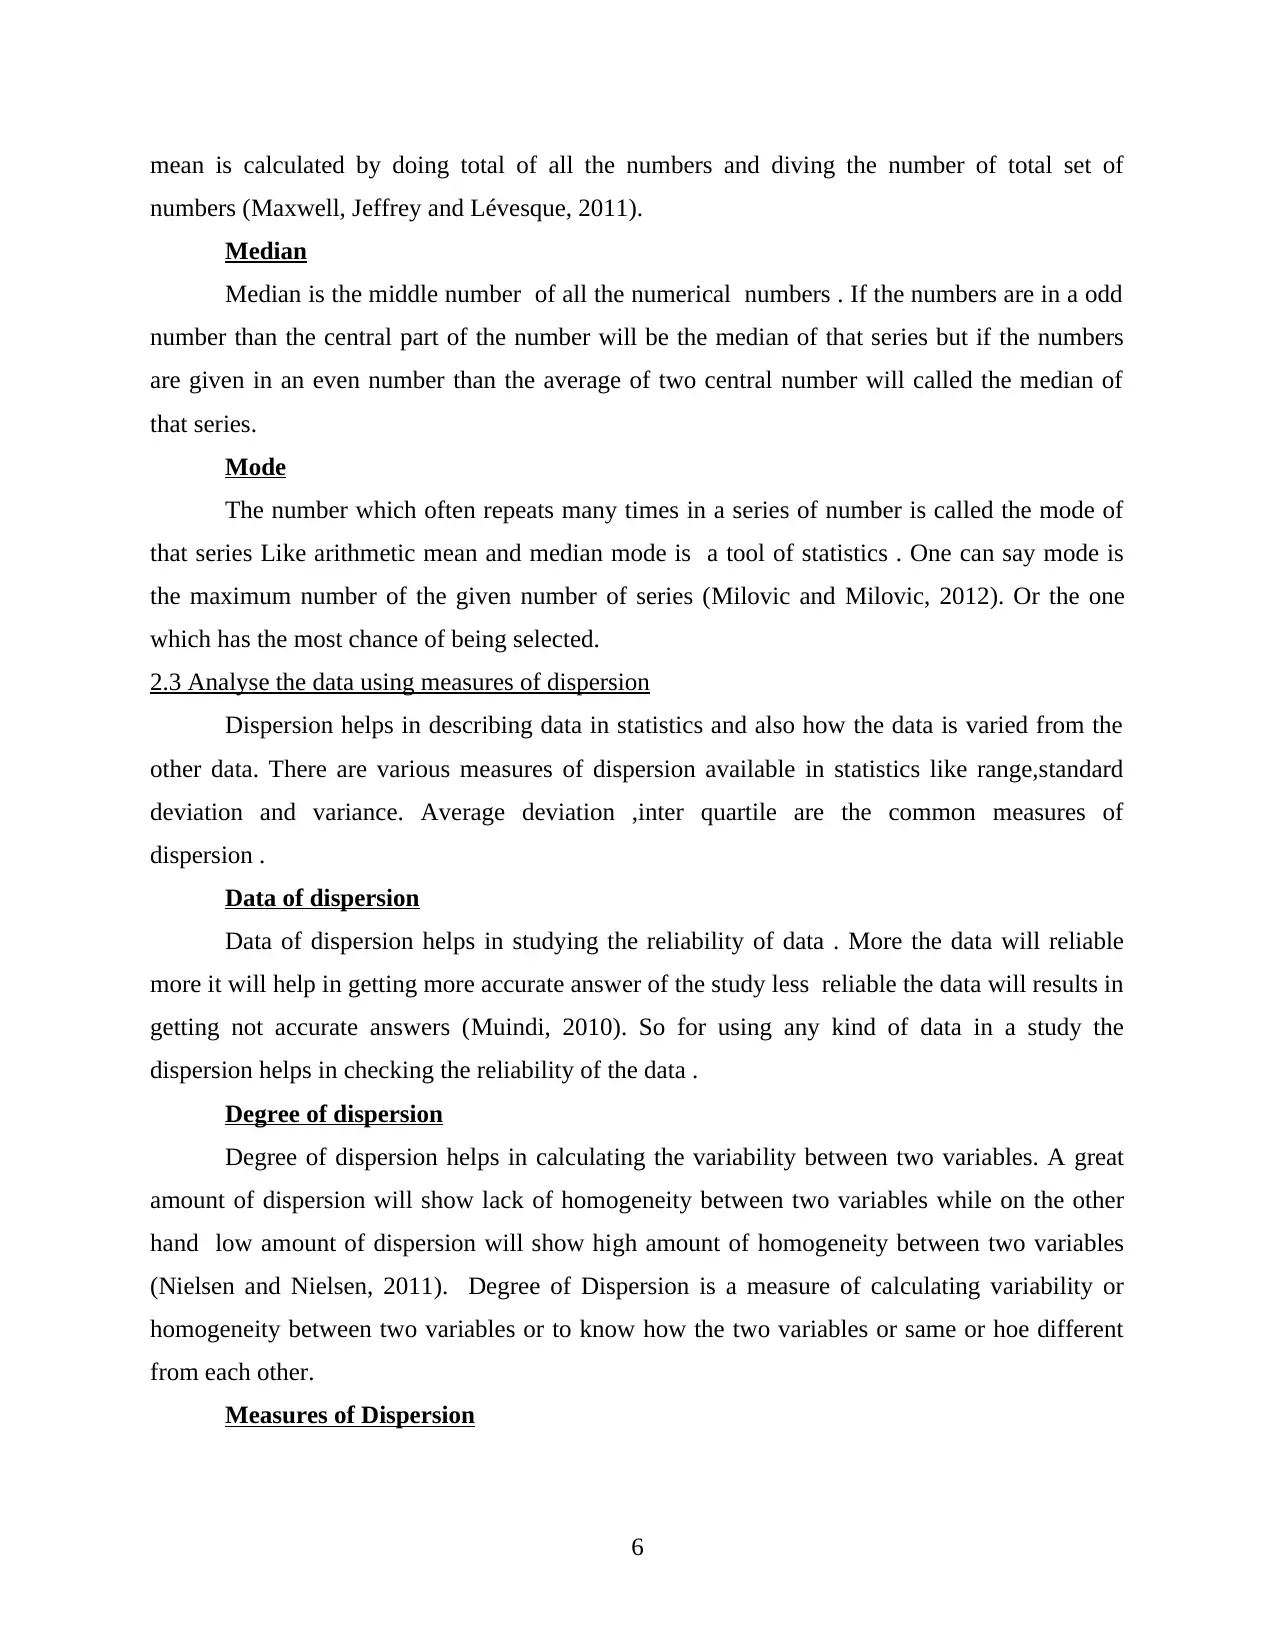
mean is calculated by doing total of all the numbers and diving the number of total set of
numbers (Maxwell, Jeffrey and Lévesque, 2011).
Median
Median is the middle number of all the numerical numbers . If the numbers are in a odd
number than the central part of the number will be the median of that series but if the numbers
are given in an even number than the average of two central number will called the median of
that series.
Mode
The number which often repeats many times in a series of number is called the mode of
that series Like arithmetic mean and median mode is a tool of statistics . One can say mode is
the maximum number of the given number of series (Milovic and Milovic, 2012). Or the one
which has the most chance of being selected.
2.3 Analyse the data using measures of dispersion
Dispersion helps in describing data in statistics and also how the data is varied from the
other data. There are various measures of dispersion available in statistics like range,standard
deviation and variance. Average deviation ,inter quartile are the common measures of
dispersion .
Data of dispersion
Data of dispersion helps in studying the reliability of data . More the data will reliable
more it will help in getting more accurate answer of the study less reliable the data will results in
getting not accurate answers (Muindi, 2010). So for using any kind of data in a study the
dispersion helps in checking the reliability of the data .
Degree of dispersion
Degree of dispersion helps in calculating the variability between two variables. A great
amount of dispersion will show lack of homogeneity between two variables while on the other
hand low amount of dispersion will show high amount of homogeneity between two variables
(Nielsen and Nielsen, 2011). Degree of Dispersion is a measure of calculating variability or
homogeneity between two variables or to know how the two variables or same or hoe different
from each other.
Measures of Dispersion
6
Measures of Dispersion is used in calculating variability between two variables when
data is distributed in Frequency or when data is given with the probability. Standard deviation is
one of measure of dispersion which is used for knowing the relationship between two variables
when the data comes with the probability. Range and variance are also used to knowing the
variability between the variables when the comes up with the frequency or with the probability.
2.4 Explain how you can use quartiles, percentiles and the correlation coefficient to draw useful
Conclusions
fined the normal distribution curve. Standers divination is positive in this case. Quartiles
it may be defined the rand of quarter-like quarter 1 ,quarter 2, quarter3 etc. feast quarter may be
defined the relation sheep between smallest number and middle numberer second quarter may be
defined the median of data. And third quarter defined the relation sheep between midam number
and highest number. It may be applied in finance and account etc. it apply odd and even number.
Percentiles
percentile may be defined the percentage in maths, account and statics. Percentile is rank method
of the company. Percentile make a normal distribution curve percentile is a area beast curve. It
make the sample size of the company. this percentage is less than the standers deviation.
Correlation coefficient
A correlation coefficient defined the dependence number of the statics. Correlation
coefficient is relation sheep between two individual variable's correlation coefficient is
fundamental statistics. Many types of correlation coefficient like people product
correlation,interchange correlation, rank method correlation method divined the best of the
company correlation coefficient. Inter change may define the quality of the product. The quality
is high and low .it defined the relation sheep between the two variables. The correlation
coefficient is not more than1 and less than -1. it is a ranking method of statistic depended on the
variables. It also defined the stranded deviation and covariance correlation match the two
variable data. it measured the highest rank of the company. It is rank based also defined the the
strength correlation coefficient.
It not be more than 1 and less than 1. Because the correlation coefficient defined the normal
distribution curve. Standers divination is positive in this case.
7
⊘ This is a preview!⊘
Do you want full access?
Subscribe today to unlock all pages.
Trusted by 1+ million students worldwide
TASK 3
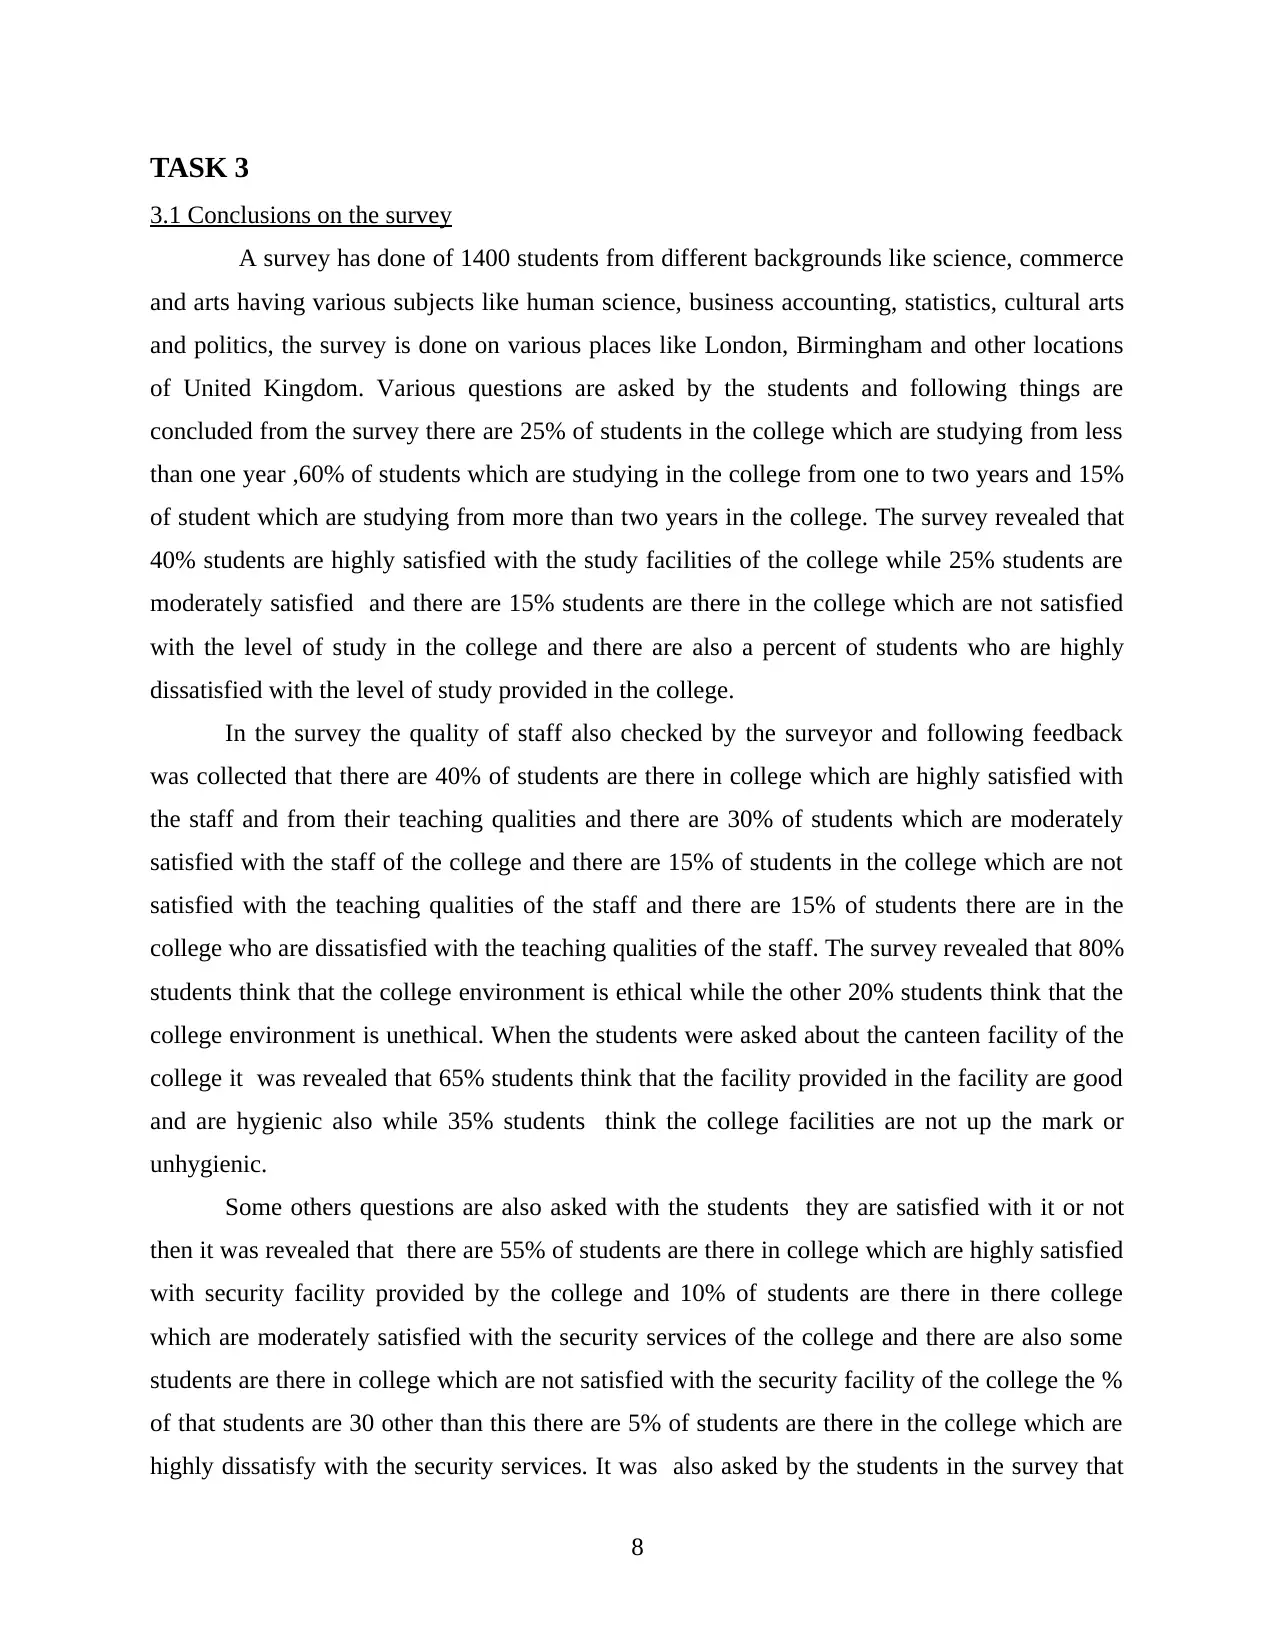
3.1 Conclusions on the survey
A survey has done of 1400 students from different backgrounds like science, commerce
and arts having various subjects like human science, business accounting, statistics, cultural arts
and politics, the survey is done on various places like London, Birmingham and other locations
of United Kingdom. Various questions are asked by the students and following things are
concluded from the survey there are 25% of students in the college which are studying from less
than one year ,60% of students which are studying in the college from one to two years and 15%
of student which are studying from more than two years in the college. The survey revealed that
40% students are highly satisfied with the study facilities of the college while 25% students are
moderately satisfied and there are 15% students are there in the college which are not satisfied
with the level of study in the college and there are also a percent of students who are highly
dissatisfied with the level of study provided in the college.
In the survey the quality of staff also checked by the surveyor and following feedback
was collected that there are 40% of students are there in college which are highly satisfied with
the staff and from their teaching qualities and there are 30% of students which are moderately
satisfied with the staff of the college and there are 15% of students in the college which are not
satisfied with the teaching qualities of the staff and there are 15% of students there are in the
college who are dissatisfied with the teaching qualities of the staff. The survey revealed that 80%
students think that the college environment is ethical while the other 20% students think that the
college environment is unethical. When the students were asked about the canteen facility of the
college it was revealed that 65% students think that the facility provided in the facility are good
and are hygienic also while 35% students think the college facilities are not up the mark or
unhygienic.
Some others questions are also asked with the students they are satisfied with it or not
then it was revealed that there are 55% of students are there in college which are highly satisfied
with security facility provided by the college and 10% of students are there in there college
which are moderately satisfied with the security services of the college and there are also some
students are there in college which are not satisfied with the security facility of the college the %
of that students are 30 other than this there are 5% of students are there in the college which are
highly dissatisfy with the security services. It was also asked by the students in the survey that
8
Paraphrase This Document
Need a fresh take? Get an instant paraphrase of this document with our AI Paraphraser
will they like to recommend the same college to their relatives or friends then 65% students said
yes while there are 35% of students are there in the college who said no. At last feedback was
also collected by the students of the college.
3.2 Trend lines in spreadsheet graphs to assist in determining any pattern in students responses
Trend Line
Trend line basic used in share market and other company like trad swift. Trend line is
used every company to calculate their profit and lose. Trend line increasing and decreasing the
company profitability. Trend line is a fundamental analysis and technical analysis. Technical
analysis analyse the market recent tents. Trend line create the commodity price. Trend line
determined the current market price. Trend line effect the daily basis of commodity. Trent line is
a line the defined the product price . Trend line confirm the company strength. trend line
recognize the many shapes. Trend line defined the increasing and decreasing of product price.
Research Analysis
Research analysis research the data of the company. Research analysis is a statistical
method. Research analysis defined the company profile and position of the company. Research
analysis research the company data ,company profile ,number of employees. Any field research
analysis used like marketing field, finance field ,and human resource management etc. some
analysis of research like qualitative analysis ,quantitative analysis research is also used in study .
Research analysis is used the product labelling ,packing and product quality. Research is a
observation , documentary and interviews of the company and firm. The people research the the
company data.
3.3 Covered in PPT
9
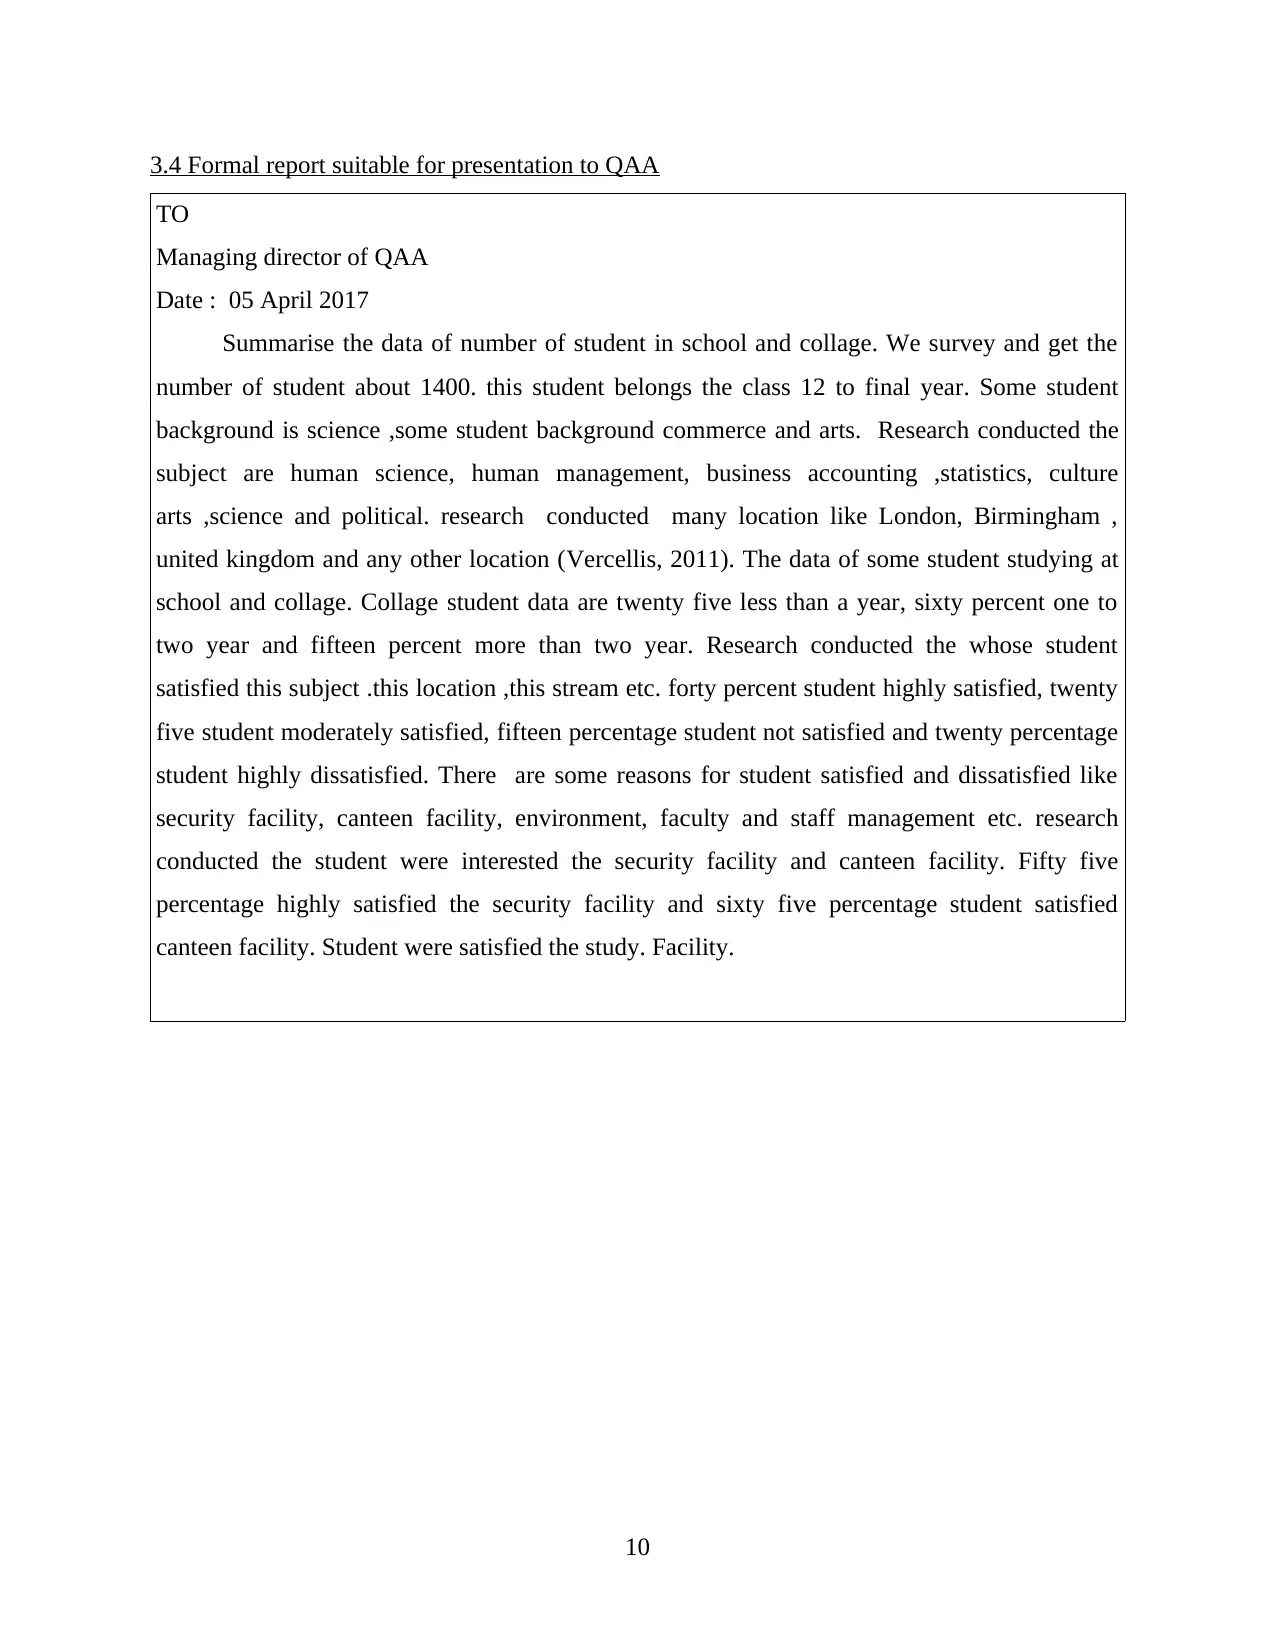
3.4 Formal report suitable for presentation to QAA
TO
Managing director of QAA
Date : 05 April 2017
Summarise the data of number of student in school and collage. We survey and get the
number of student about 1400. this student belongs the class 12 to final year. Some student
background is science ,some student background commerce and arts. Research conducted the
subject are human science, human management, business accounting ,statistics, culture
arts ,science and political. research conducted many location like London, Birmingham ,
united kingdom and any other location (Vercellis, 2011). The data of some student studying at
school and collage. Collage student data are twenty five less than a year, sixty percent one to
two year and fifteen percent more than two year. Research conducted the whose student
satisfied this subject .this location ,this stream etc. forty percent student highly satisfied, twenty
five student moderately satisfied, fifteen percentage student not satisfied and twenty percentage
student highly dissatisfied. There are some reasons for student satisfied and dissatisfied like
security facility, canteen facility, environment, faculty and staff management etc. research
conducted the student were interested the security facility and canteen facility. Fifty five
percentage highly satisfied the security facility and sixty five percentage student satisfied
canteen facility. Student were satisfied the study. Facility.
10
⊘ This is a preview!⊘
Do you want full access?
Subscribe today to unlock all pages.
Trusted by 1+ million students worldwide
1 out of 16
Related Documents


Your All-in-One AI-Powered Toolkit for Academic Success.
+13062052269
info@desklib.com
Available 24*7 on WhatsApp / Email
![[object Object]](/_next/static/media/star-bottom.7253800d.svg)
Unlock your academic potential
Copyright © 2020–2026 A2Z Services. All Rights Reserved. Developed and managed by ZUCOL.