Analysis of Business Decision-Making for UKCBC: A Student Report
VerifiedAdded on 2020/06/05
|28
|5967
|137
Report
AI Summary
This report, prepared by a student representative, focuses on business decision-making at UKCBC college, aiming to assess student experiences and satisfaction. It outlines a comprehensive plan for data collection, including the selection of primary and secondary sources, such as questionnaires, interviews, and surveys. The report details the survey methodology, including random sampling and a structured questionnaire distributed across three UKCBC campuses. It presents the collected data, analyzed through charts and graphs, covering aspects like age groups, course preferences, and satisfaction levels. The report concludes with an analysis of the findings and recommendations for enhancing the college's performance and student experience. The report also includes the use of investment appraisal techniques for evaluating business proposals.
Business decision-making
Paraphrase This Document
Need a fresh take? Get an instant paraphrase of this document with our AI Paraphraser
Table of Contents
INTRODUCTION...........................................................................................................................1
1.1................................................................................................................................................1
1.2................................................................................................................................................3
1.3................................................................................................................................................4
TASK 2............................................................................................................................................6
2.1................................................................................................................................................6
2.2..............................................................................................................................................13
2.3..............................................................................................................................................14
2.4..............................................................................................................................................15
TASK 3..........................................................................................................................................15
3.1..............................................................................................................................................15
3.2..............................................................................................................................................18
3.3 Covered in PPT ..................................................................................................................19
3.4..............................................................................................................................................19
Task 4.............................................................................................................................................20
4.1..............................................................................................................................................20
4.2..............................................................................................................................................22
4.3..............................................................................................................................................23
CONCLUSION..............................................................................................................................24
REFERENCES..............................................................................................................................25

⊘ This is a preview!⊘
Do you want full access?
Subscribe today to unlock all pages.
Trusted by 1+ million students worldwide
INTRODUCTION
In the changing world there are various aspects in relation to which different decisions
will be made and this process is known as business decision making (Ariely and Berns, 2010).
With the help of this the college will be able to improve its performance and growth will be
attained. In UKCBC a report is to be submitted to QAA with the help of which it will be
evaluating the workings and corrective steps will be taken. In this report the survey will be
required to conducted with the use of questionnaire by which the relevant information will be
collected and a plan will also be made in this respect. In this the sample will be taken and for this
different methods are specified. The data will be interpreted and conclusion will be made which
will be done with the help of graphs and charts (Casadesus-Masanell and Ricart, 2011). There
are various proposals which are present in the business and the best among them will be selected
and for this various investment appraisal techniques will have to be used that are discussed in the
below presented report.
1.1
As a student representative a report will be made on students experiences and satisfaction. For
that some steps will be used to collect information. Following is the plan:
Planning: A plan will be made to collect info about scholars regarding experience and their
reviews. For making a plan all factors will be included that how data will be collected and to
whom responsibilities will be given.
Select methods for collecting data: There are many methods to collect data. It also depends on
type of information. It can be quantitative as well as qualitative. Required data will be collected
through primary sources or through secondary sources. Questionnaires will be made, face to face
interviews will be taken, a survey is needed to be done. There will be need to collect data by
observing them. Students who are not regular, they will be asked over the telephone. These all
are included in primary sources (Chang, Van Witteloostuijn and Eden, 2010). There will be need
to interact with students and then identify their problems.
Collection of data: Selected methods such as series of written questions, surveys, interviews,
observations will be implemented and response of students will be recorded accordingly. Person
who is accountable to acquire data will know how he will do so (Zsambok and Klein, 2014). It
will be decided that when the data will be collected and what will be cost of doing this activity.
1
Paraphrase This Document
Need a fresh take? Get an instant paraphrase of this document with our AI Paraphraser
From which portions of college and from which students, the relevant information will be
collected.
Storage of data: Collected information by different persons will be accumulated and will be
stored in a appropriate manner. This info will be recorded in report and all the relevant data will
be kept safe. Person who has data will inform representative of students and that will be
discussed in report.
There are 2 types of data collection sources and those are primary and secondary. These are
discussed as follows:
Primary sources: In this method of acquiring information experiments, interviews,
questionnaires, surveys and observations are made regarding subject matter. This in a technique
that is used as collecting data by using own specific methods. This data is collected from original
sources. A series of questions, and interacting with other party face to face from whom info in
being acquired, in case of absence use telephone to connect with other party etc. are included in
this method.
Secondary sources: Data is acquired through already published articles, any written documents,
magazines, newspapers, books, journals or through internet. It is a method that is used to use
information already collected by someone else (Gigerenzer and Gaissmaier, 2011). These are
mainly used for quantitative information. The data that is being reused is called secondary data.
In this source after selecting subject for which information is required the available ways such as
books, magazines, articles are used to make research on matter.
Data is categorised in 2 parts. First is quantitative and second is qualitative. information that is
used as statics is called quantitative. But qualitative is a interpretative information. Anything
that can be expressed in numericals is quantitative and other data is known as qualitative.
Primary sources are normally used for descriptive info. Secondary sources are use for numeric
facts and details.
1.2
To make accurate decisions survey method is most commonly used. It is one of the best
and effective method to collect details. This technique is mostly used by upcoming generation
because it provides high satisfaction while acquiring evidences. Many enquiry programmes are
to be done to make any report in a adequate manner and with relevant information. There are a
2
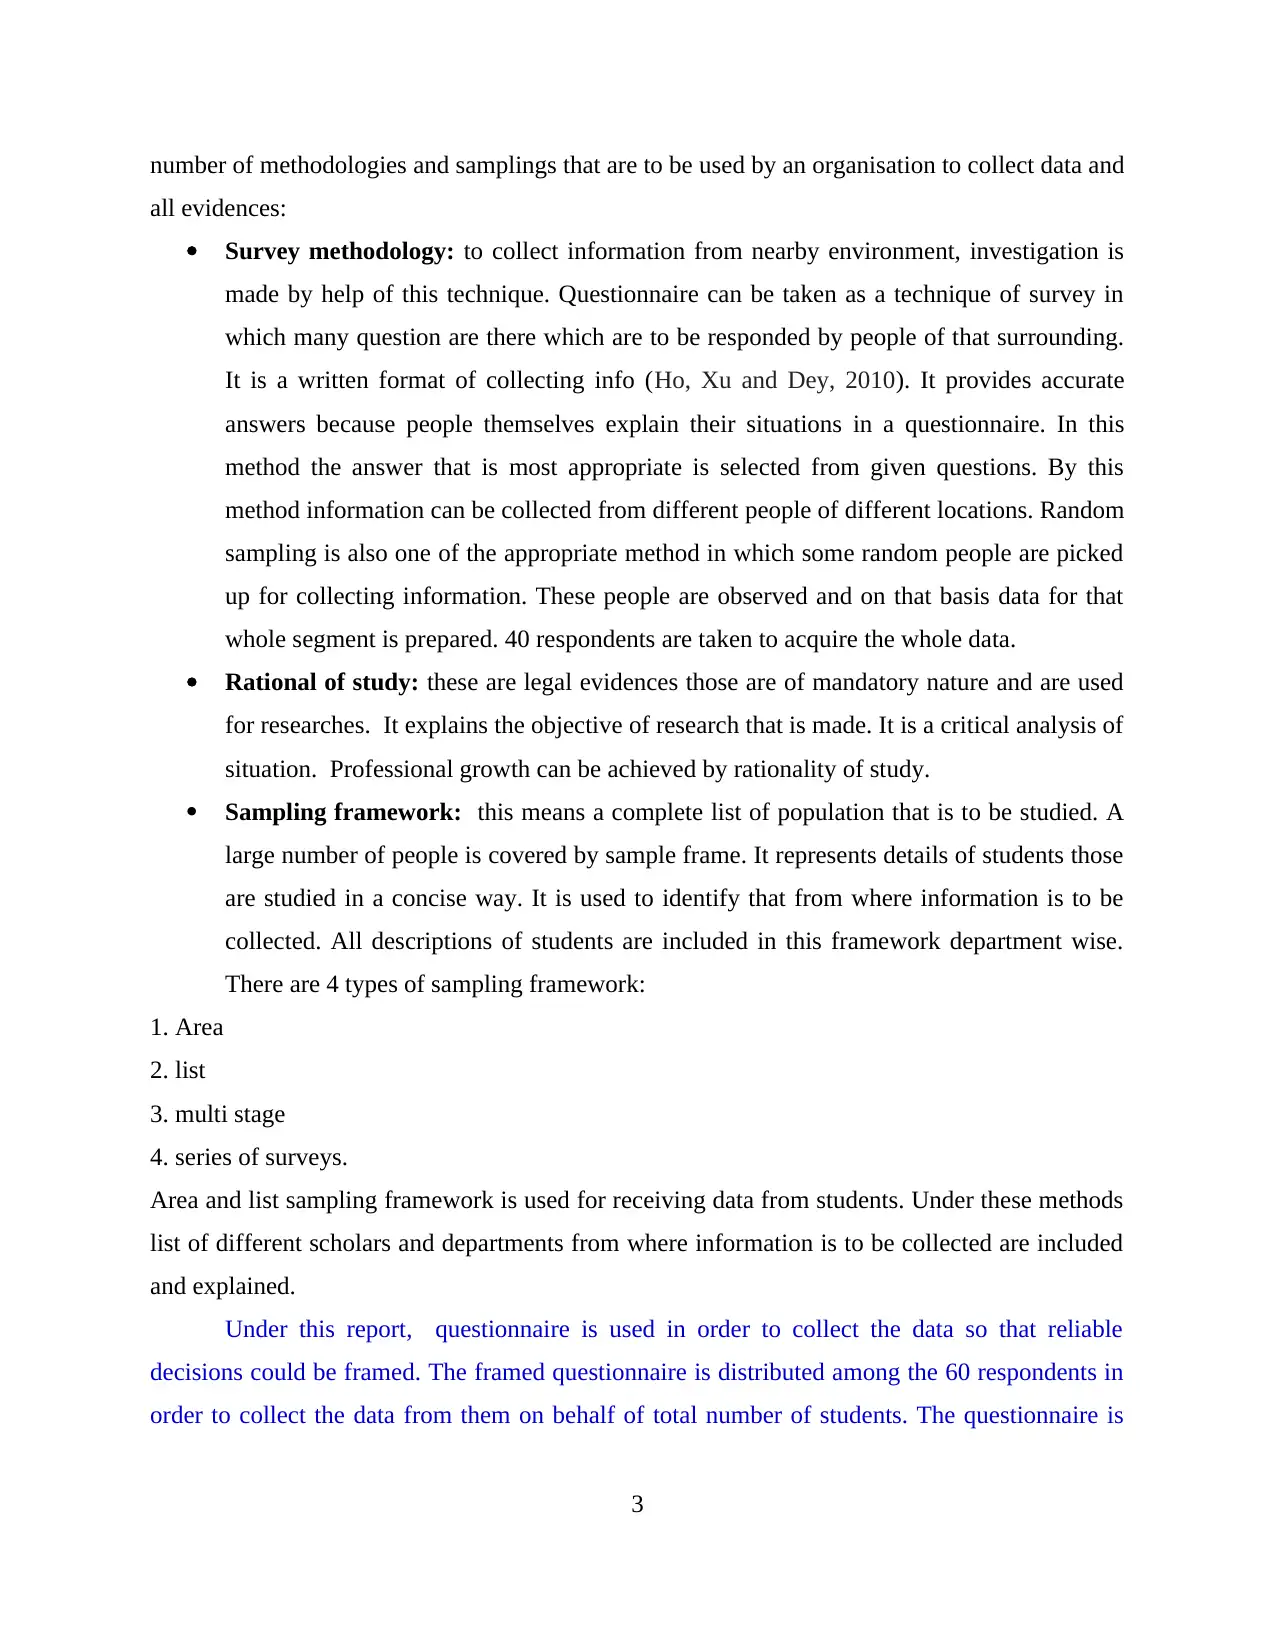
number of methodologies and samplings that are to be used by an organisation to collect data and
all evidences:
Survey methodology: to collect information from nearby environment, investigation is
made by help of this technique. Questionnaire can be taken as a technique of survey in
which many question are there which are to be responded by people of that surrounding.
It is a written format of collecting info (Ho, Xu and Dey, 2010). It provides accurate
answers because people themselves explain their situations in a questionnaire. In this
method the answer that is most appropriate is selected from given questions. By this
method information can be collected from different people of different locations. Random
sampling is also one of the appropriate method in which some random people are picked
up for collecting information. These people are observed and on that basis data for that
whole segment is prepared. 40 respondents are taken to acquire the whole data.
Rational of study: these are legal evidences those are of mandatory nature and are used
for researches. It explains the objective of research that is made. It is a critical analysis of
situation. Professional growth can be achieved by rationality of study.
Sampling framework: this means a complete list of population that is to be studied. A
large number of people is covered by sample frame. It represents details of students those
are studied in a concise way. It is used to identify that from where information is to be
collected. All descriptions of students are included in this framework department wise.
There are 4 types of sampling framework:
1. Area
2. list
3. multi stage
4. series of surveys.
Area and list sampling framework is used for receiving data from students. Under these methods
list of different scholars and departments from where information is to be collected are included
and explained.
Under this report, questionnaire is used in order to collect the data so that reliable
decisions could be framed. The framed questionnaire is distributed among the 60 respondents in
order to collect the data from them on behalf of total number of students. The questionnaire is
3
⊘ This is a preview!⊘
Do you want full access?
Subscribe today to unlock all pages.
Trusted by 1+ million students worldwide
implemented by using face to face technique for collection of data. The survey is completed
within two weeks and collection of data is gathered within 5 weeks.
There are two kinds of sampling methods which are used while collecting the survey. Probability
and non-probablity sampling methods.
1.3
4
within two weeks and collection of data is gathered within 5 weeks.
There are two kinds of sampling methods which are used while collecting the survey. Probability
and non-probablity sampling methods.
1.3
4
Paraphrase This Document
Need a fresh take? Get an instant paraphrase of this document with our AI Paraphraser
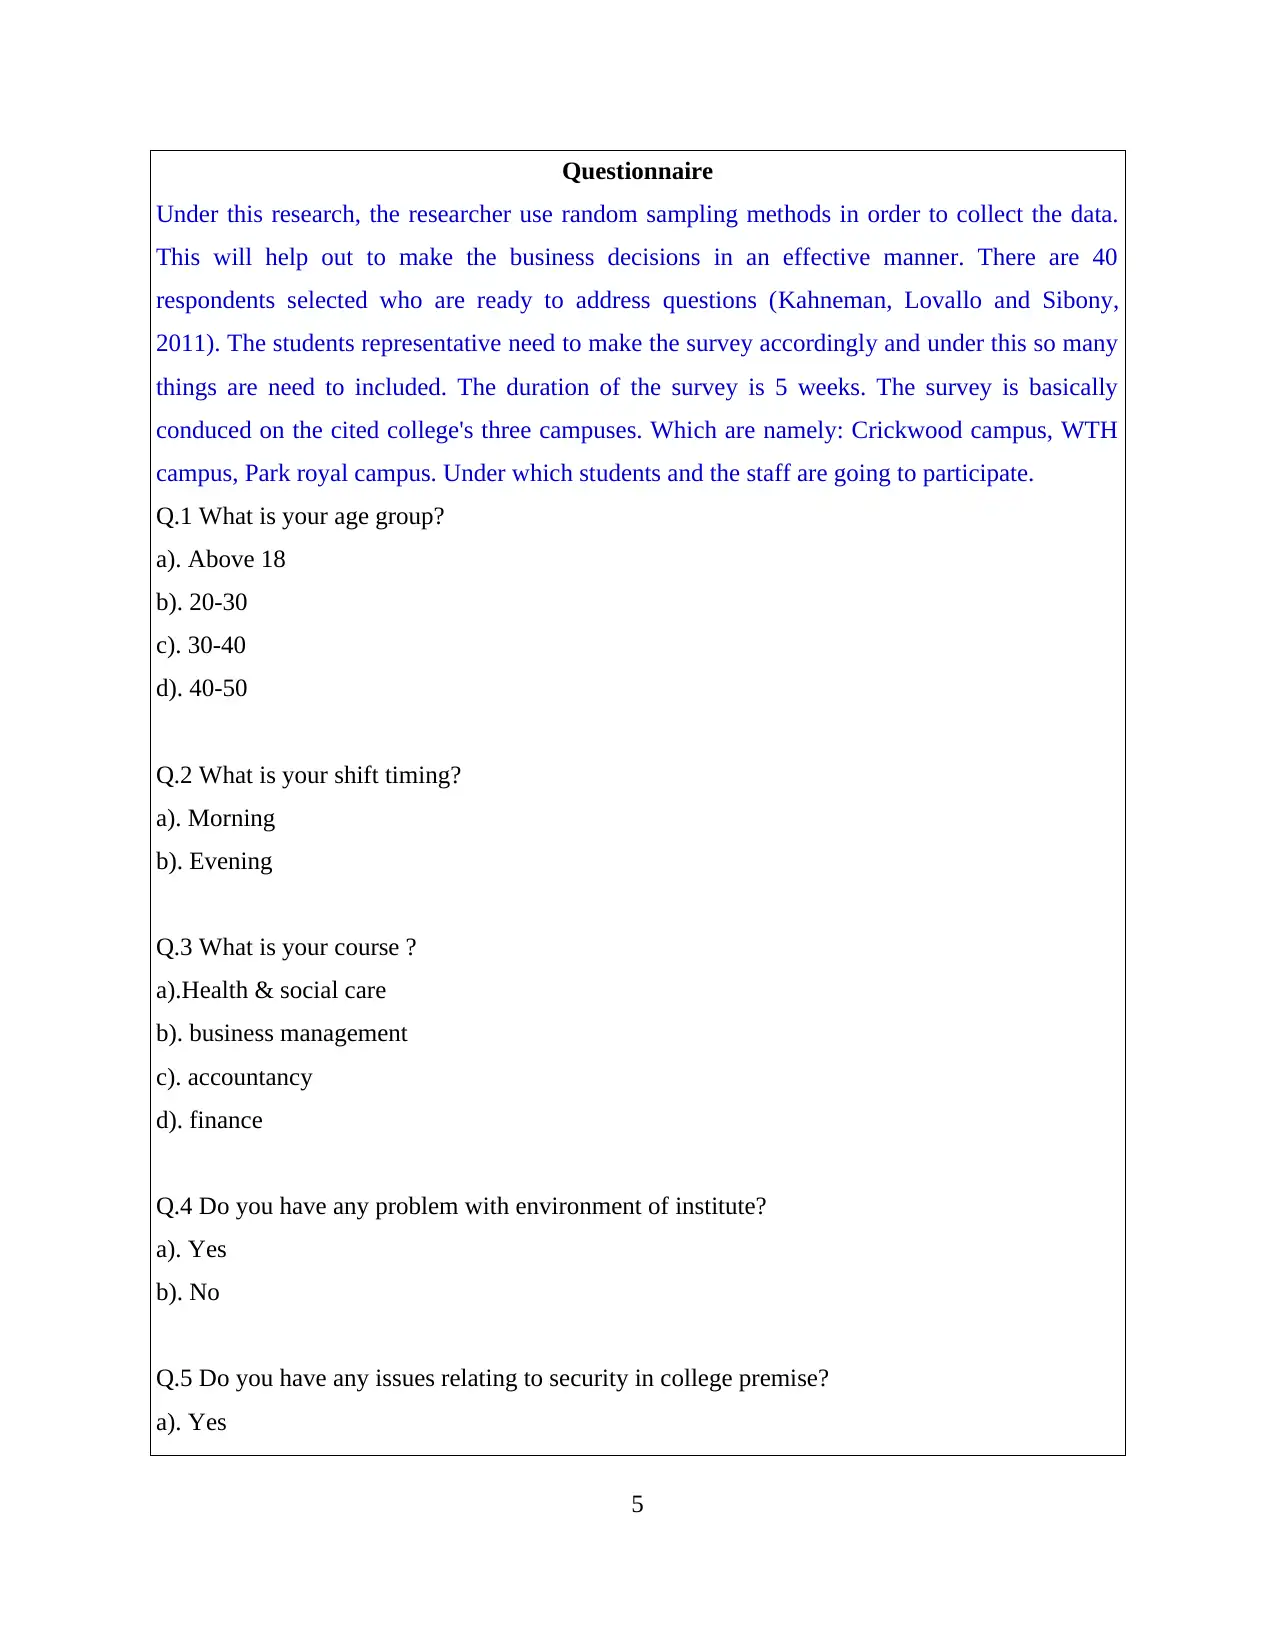
Questionnaire
Under this research, the researcher use random sampling methods in order to collect the data.
This will help out to make the business decisions in an effective manner. There are 40
respondents selected who are ready to address questions (Kahneman, Lovallo and Sibony,
2011). The students representative need to make the survey accordingly and under this so many
things are need to included. The duration of the survey is 5 weeks. The survey is basically
conduced on the cited college's three campuses. Which are namely: Crickwood campus, WTH
campus, Park royal campus. Under which students and the staff are going to participate.
Q.1 What is your age group?
a). Above 18
b). 20-30
c). 30-40
d). 40-50
Q.2 What is your shift timing?
a). Morning
b). Evening
Q.3 What is your course ?
a).Health & social care
b). business management
c). accountancy
d). finance
Q.4 Do you have any problem with environment of institute?
a). Yes
b). No
Q.5 Do you have any issues relating to security in college premise?
a). Yes
5
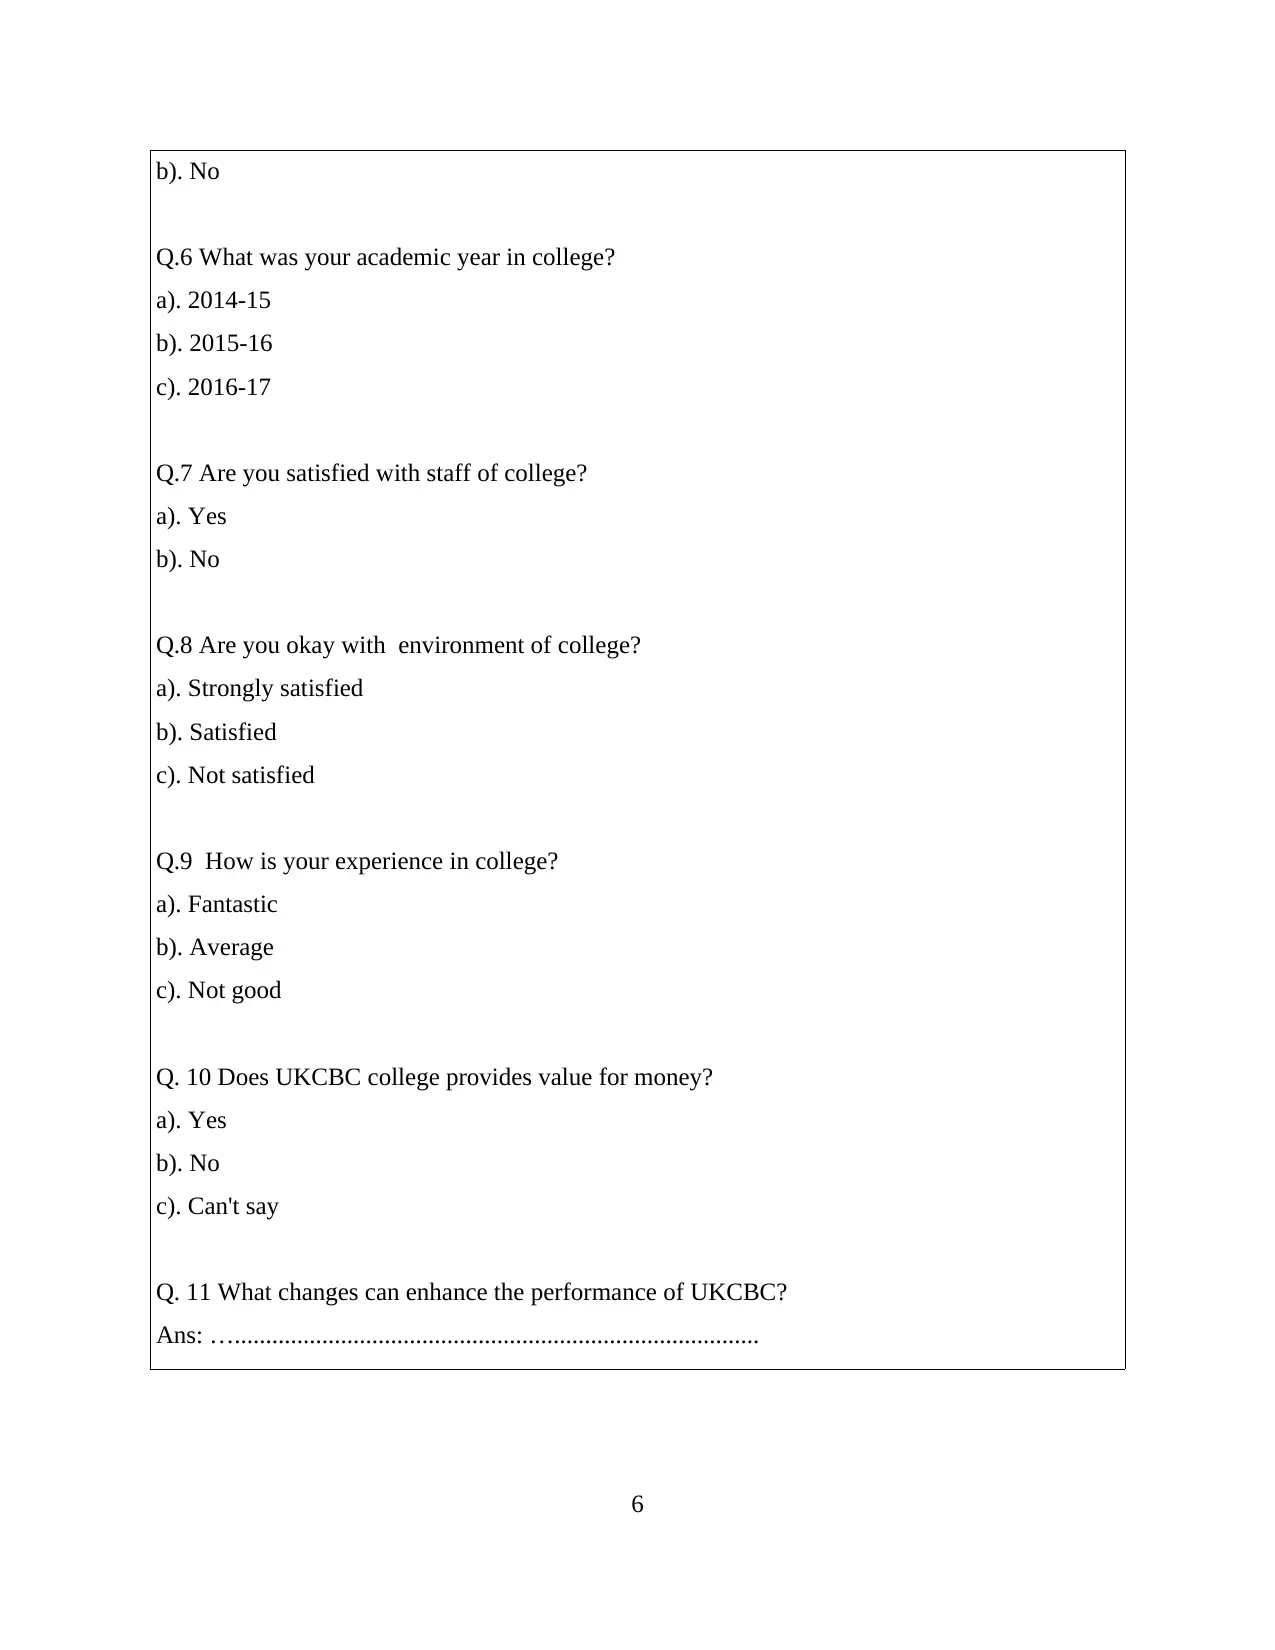
b). No
Q.6 What was your academic year in college?
a). 2014-15
b). 2015-16
c). 2016-17
Q.7 Are you satisfied with staff of college?
a). Yes
b). No
Q.8 Are you okay with environment of college?
a). Strongly satisfied
b). Satisfied
c). Not satisfied
Q.9 How is your experience in college?
a). Fantastic
b). Average
c). Not good
Q. 10 Does UKCBC college provides value for money?
a). Yes
b). No
c). Can't say
Q. 11 What changes can enhance the performance of UKCBC?
Ans: …....................................................................................
6
⊘ This is a preview!⊘
Do you want full access?
Subscribe today to unlock all pages.
Trusted by 1+ million students worldwide
TASK 2
2.1
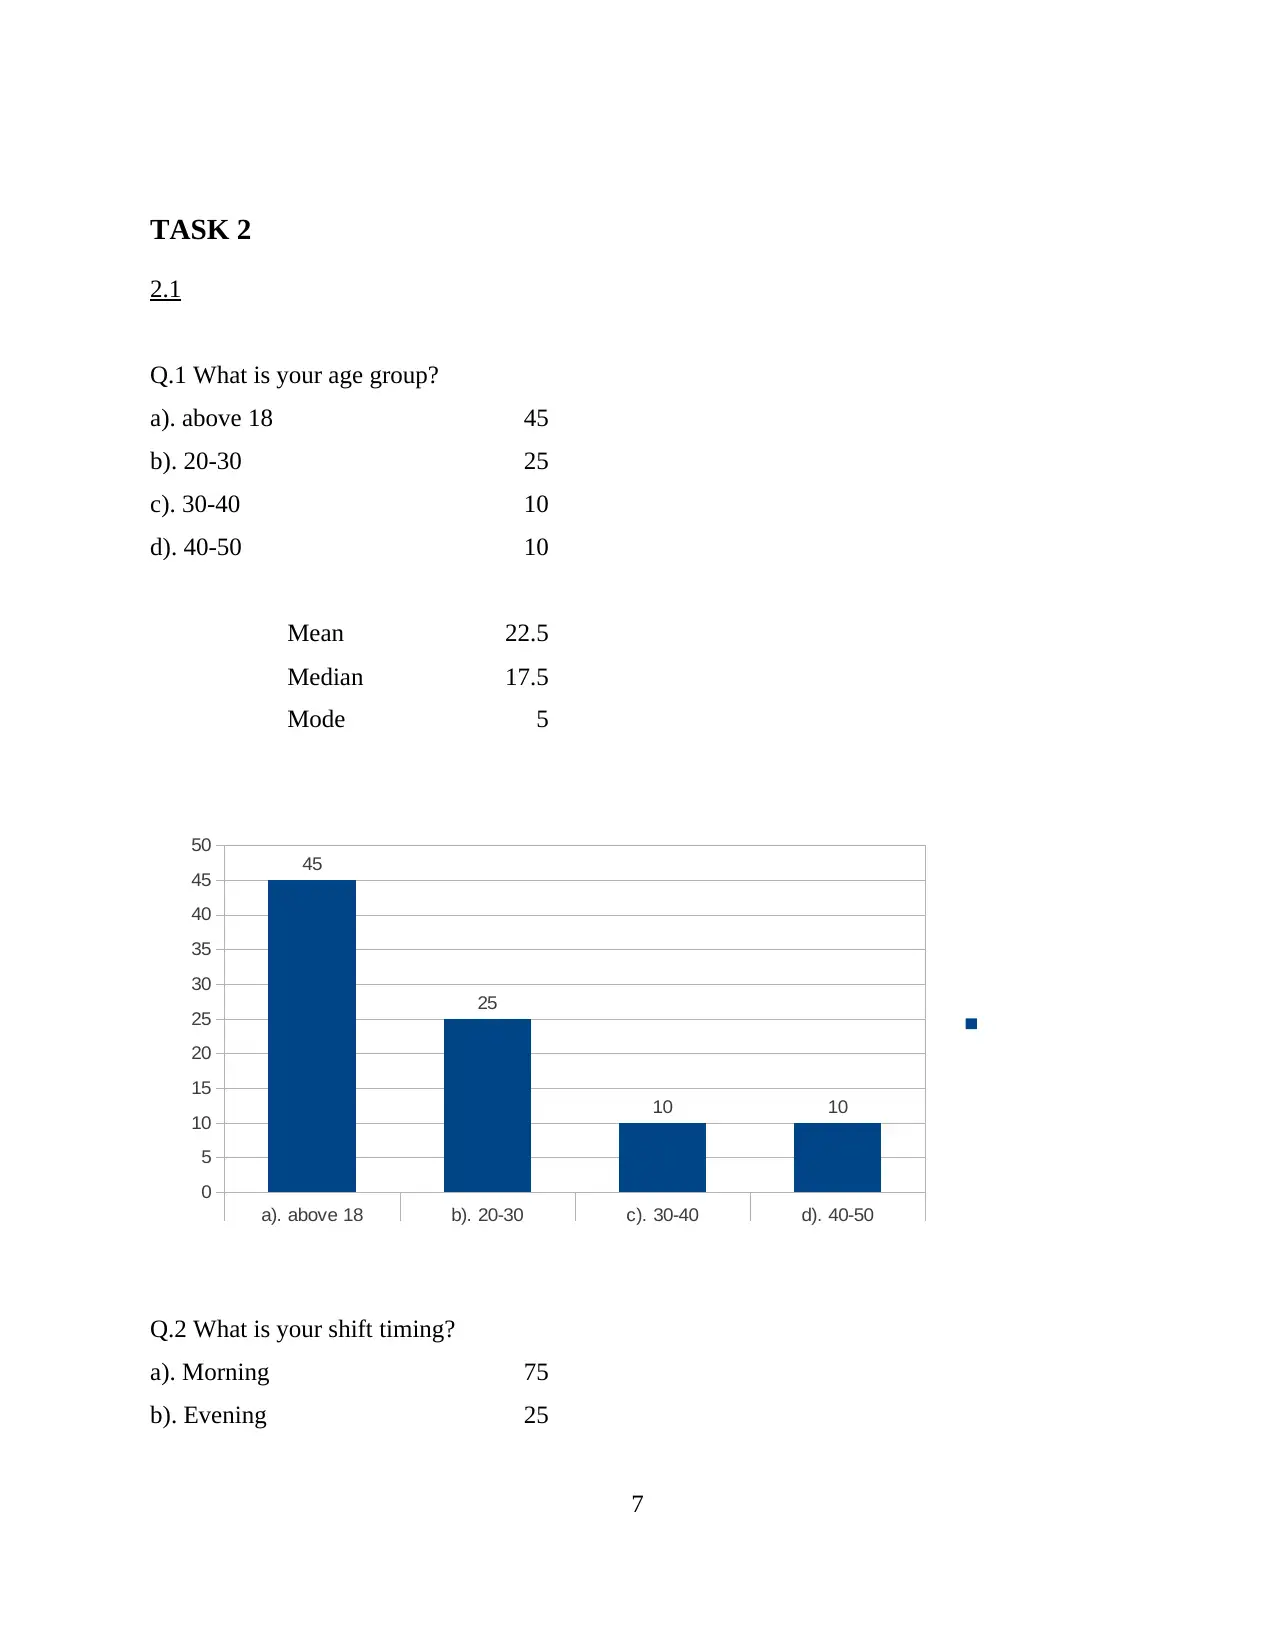
Q.1 What is your age group?
a). above 18 45
b). 20-30 25
c). 30-40 10
d). 40-50 10
Mean 22.5
Median 17.5
Mode 5
a). above 18 b). 20-30 c). 30-40 d). 40-50
0
5
10
15
20
25
30
35
40
45
50
45
25
10 10
Q.2 What is your shift timing?
a). Morning 75
b). Evening 25
7
2.1
Q.1 What is your age group?
a). above 18 45
b). 20-30 25
c). 30-40 10
d). 40-50 10
Mean 22.5
Median 17.5
Mode 5
a). above 18 b). 20-30 c). 30-40 d). 40-50
0
5
10
15
20
25
30
35
40
45
50
45
25
10 10
Q.2 What is your shift timing?
a). Morning 75
b). Evening 25
7
Paraphrase This Document
Need a fresh take? Get an instant paraphrase of this document with our AI Paraphraser
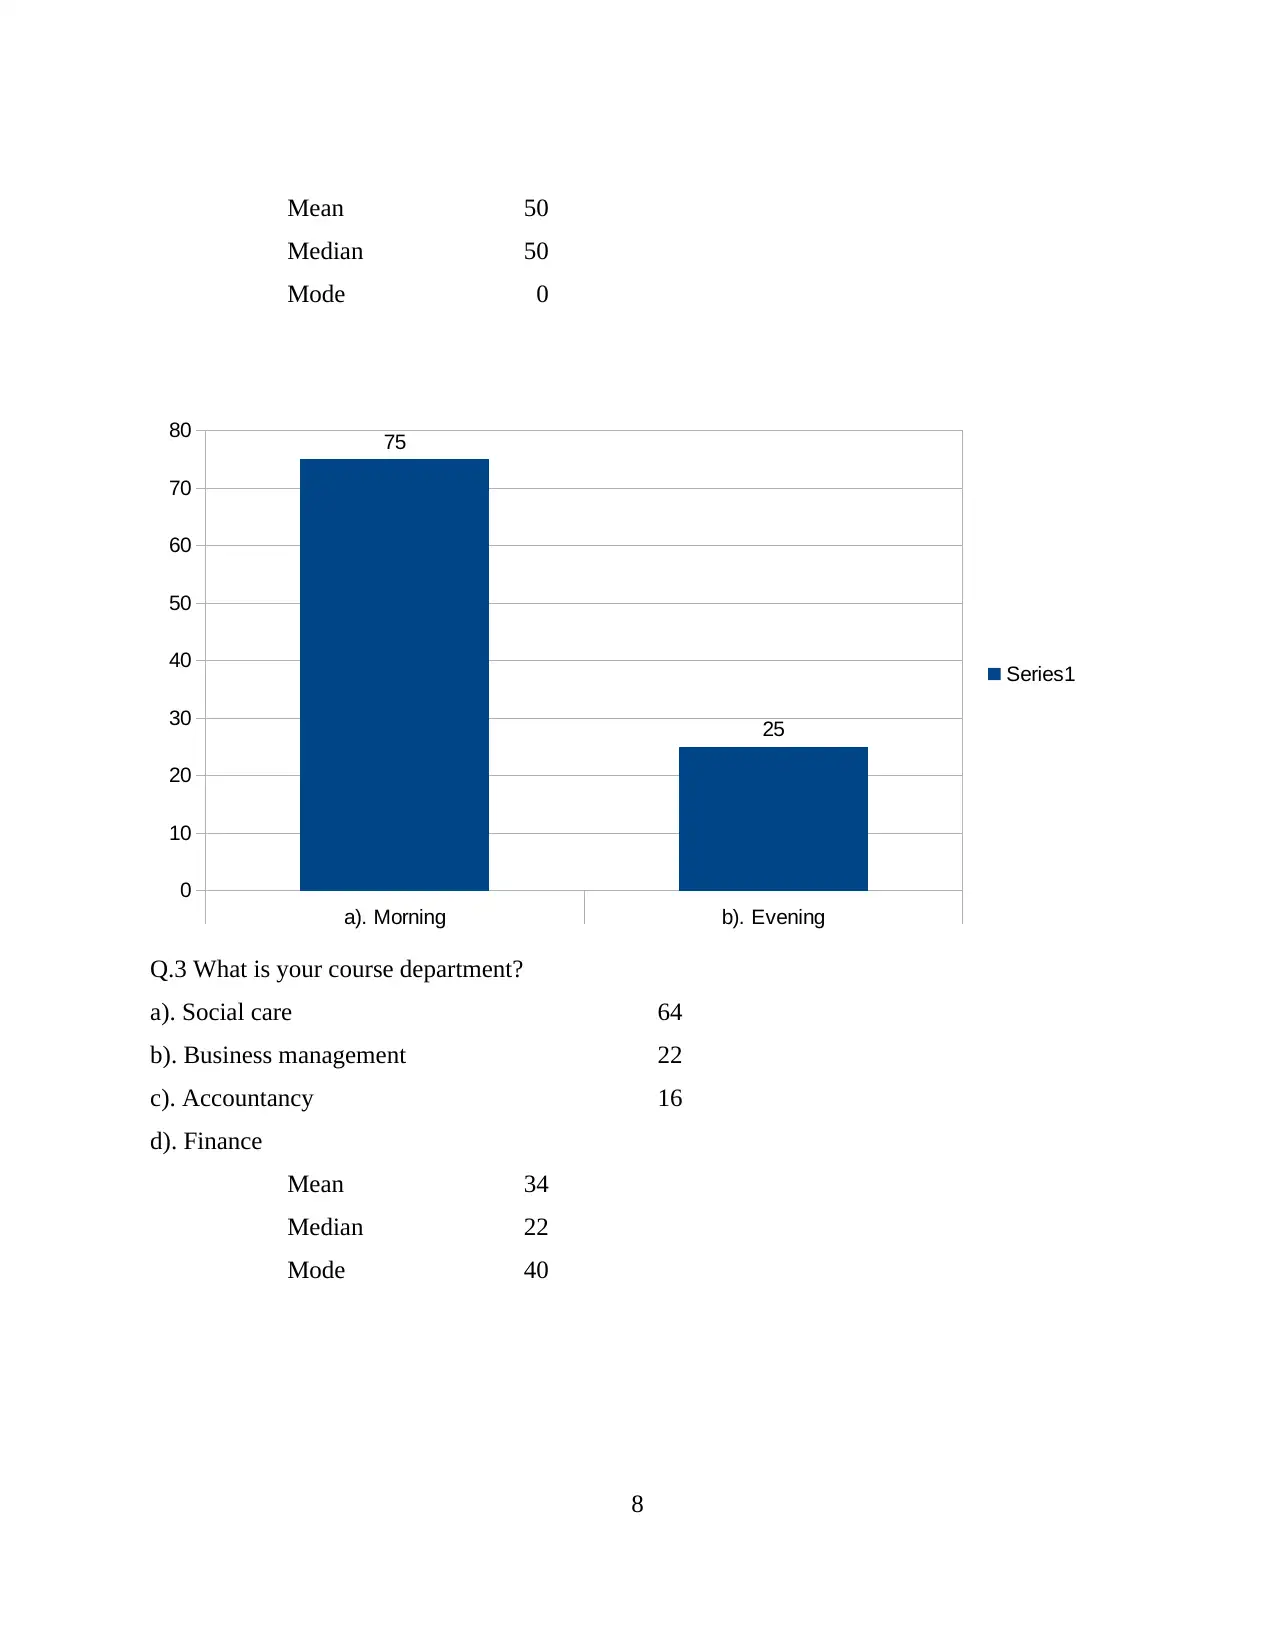
Mean 50
Median 50
Mode 0
a). Morning b). Evening
0
10
20
30
40
50
60
70
80 75
25
Series1
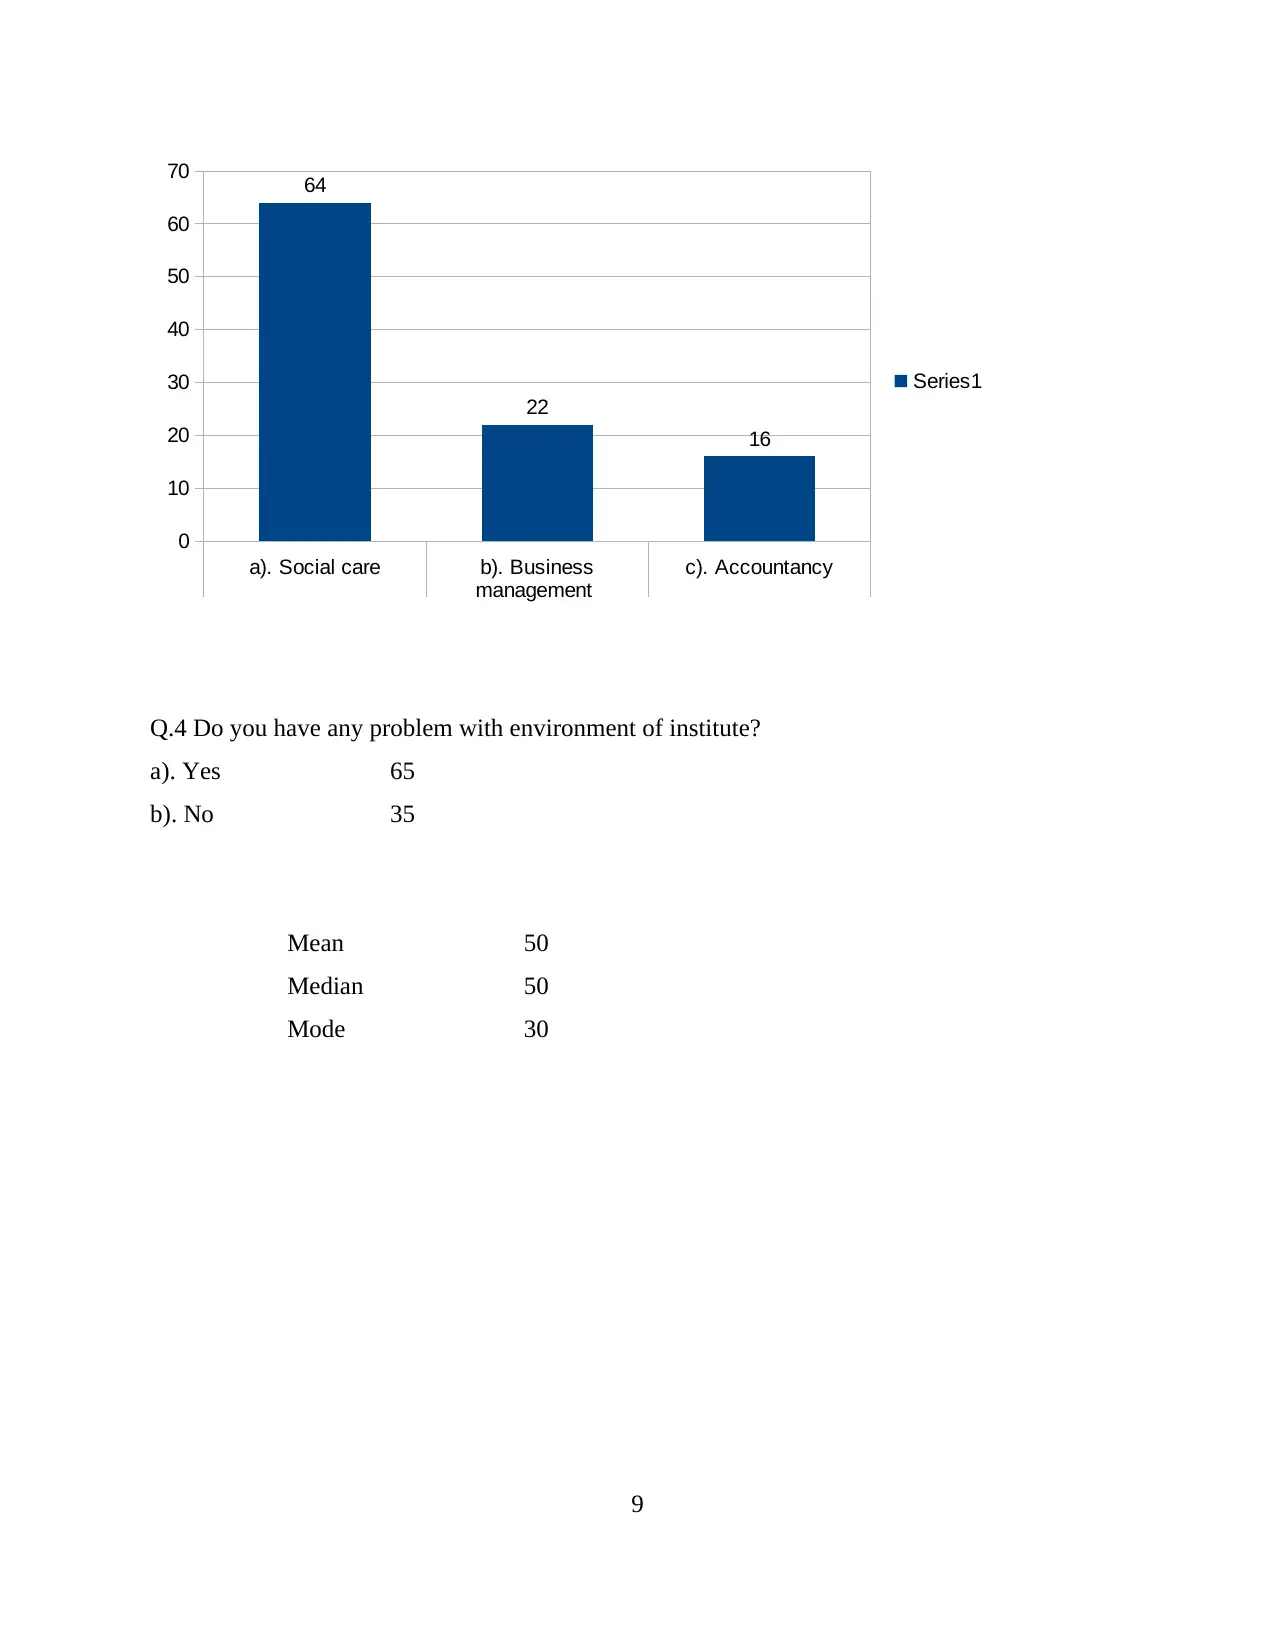
Q.3 What is your course department?
a). Social care 64
b). Business management 22
c). Accountancy 16
d). Finance
Mean 34
Median 22
Mode 40
8
Median 50
Mode 0
a). Morning b). Evening
0
10
20
30
40
50
60
70
80 75
25
Series1
Q.3 What is your course department?
a). Social care 64
b). Business management 22
c). Accountancy 16
d). Finance
Mean 34
Median 22
Mode 40
8
a). Social care b). Business
management
c). Accountancy
0
10
20
30
40
50
60
70 64
22
16
Series1
Q.4 Do you have any problem with environment of institute?
a). Yes 65
b). No 35
Mean 50
Median 50
Mode 30
9
management
c). Accountancy
0
10
20
30
40
50
60
70 64
22
16
Series1
Q.4 Do you have any problem with environment of institute?
a). Yes 65
b). No 35
Mean 50
Median 50
Mode 30
9
⊘ This is a preview!⊘
Do you want full access?
Subscribe today to unlock all pages.
Trusted by 1+ million students worldwide
1 out of 28
Related Documents


Your All-in-One AI-Powered Toolkit for Academic Success.
+13062052269
info@desklib.com
Available 24*7 on WhatsApp / Email
![[object Object]](/_next/static/media/star-bottom.7253800d.svg)
Unlock your academic potential
Copyright © 2020–2026 A2Z Services. All Rights Reserved. Developed and managed by ZUCOL.