UKCBC College Business Decision Making: A Student Perception Report

Verified

Added on  2023/03/22

|18
|482
|53
Report
AI Summary
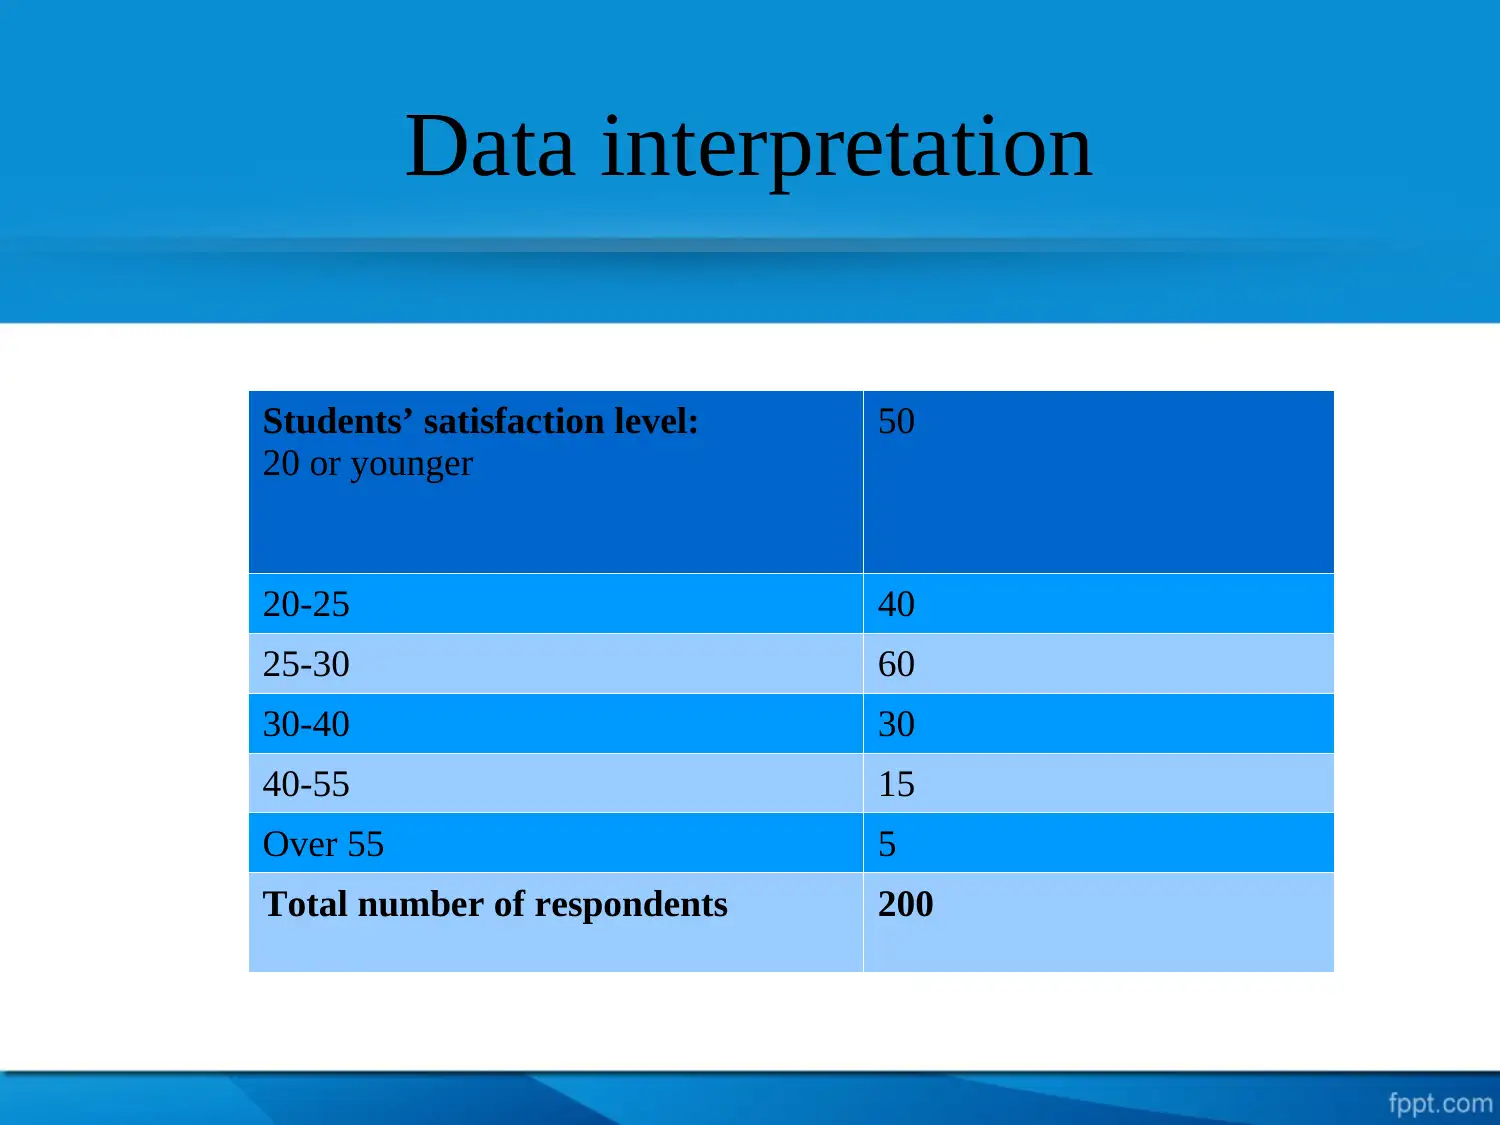
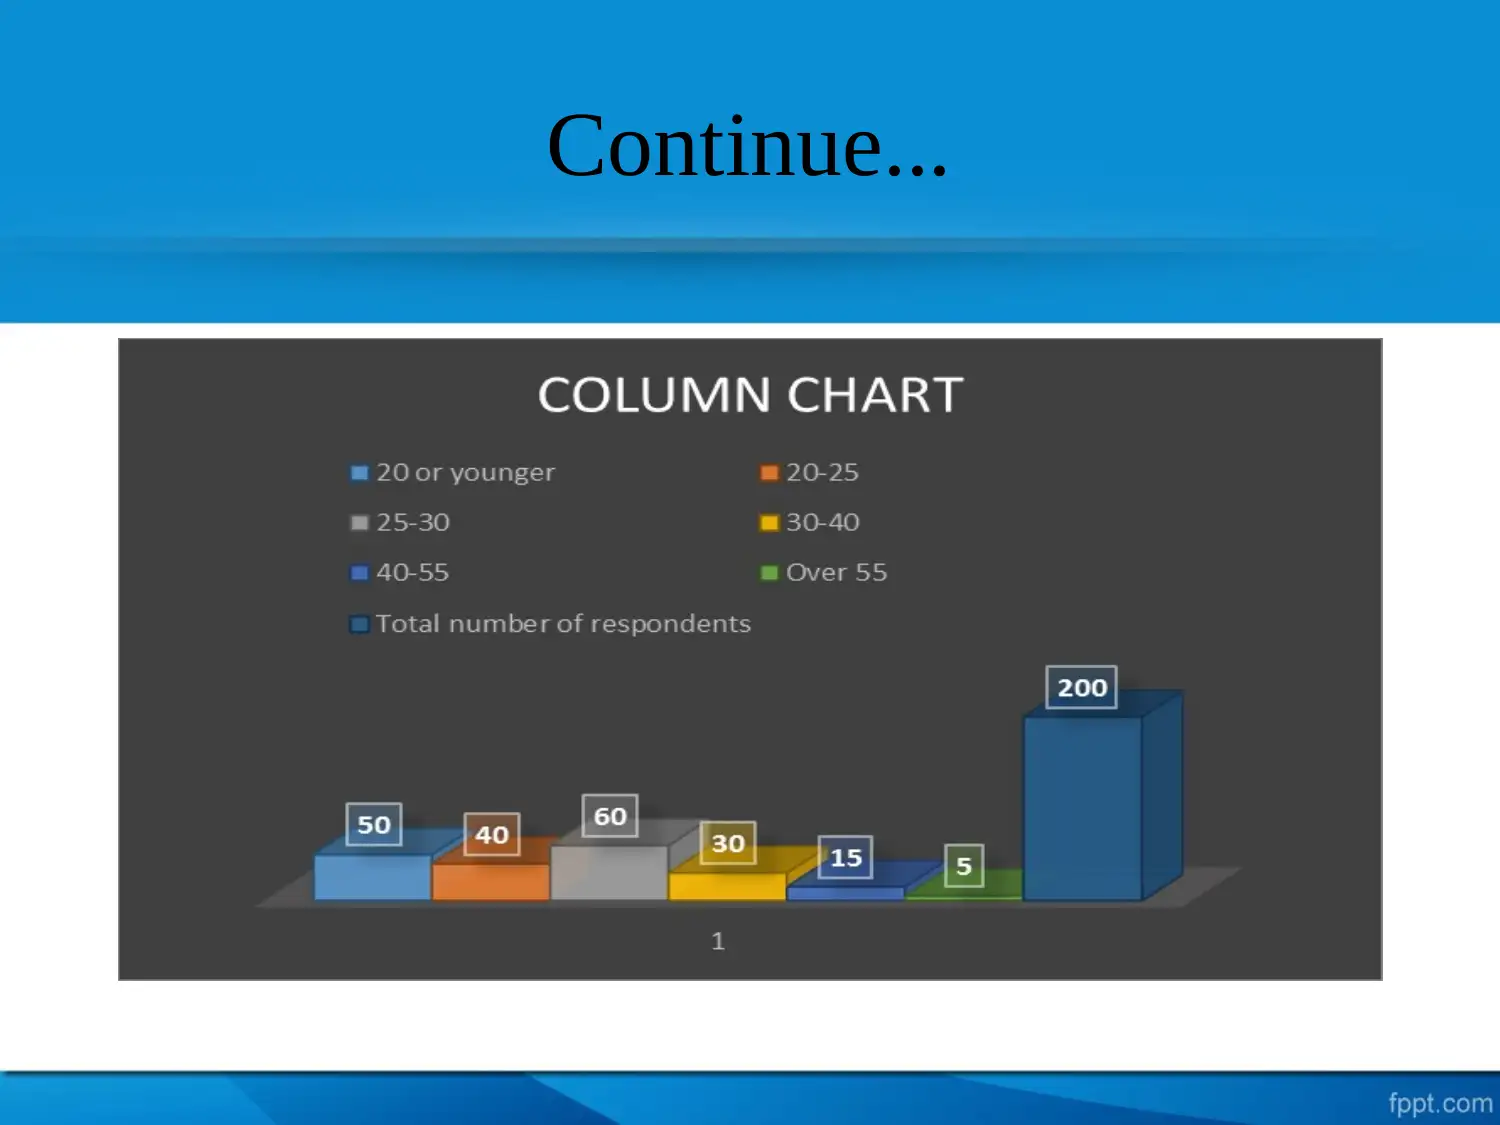
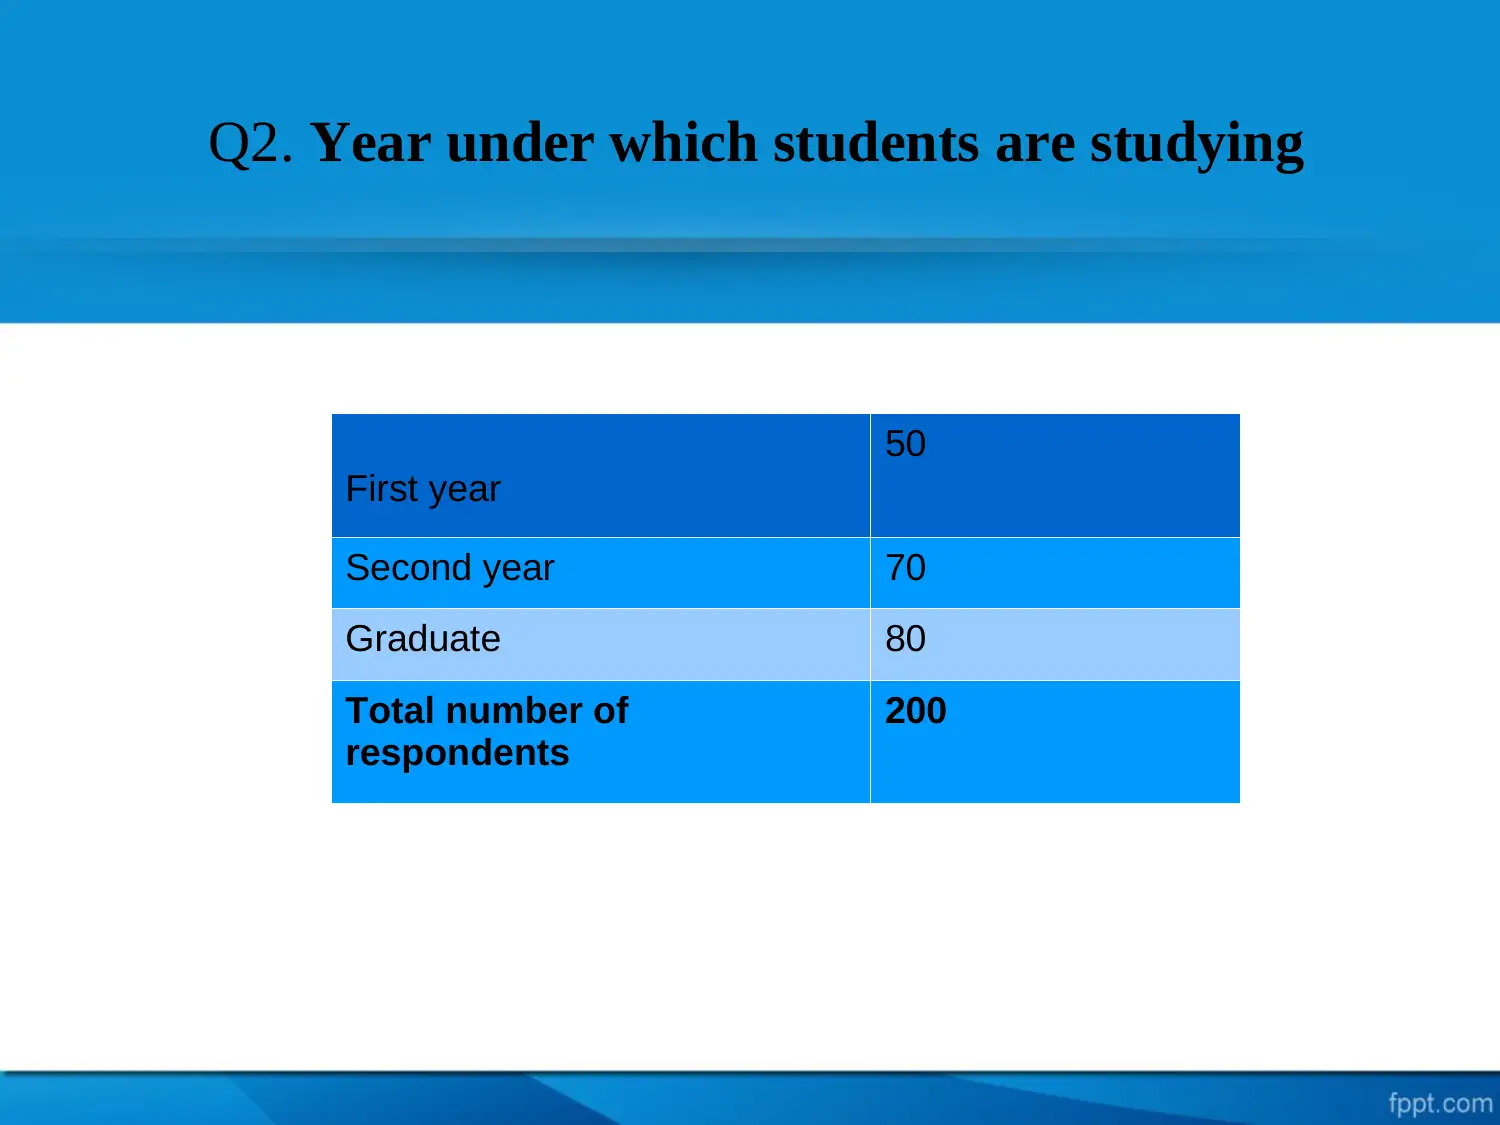
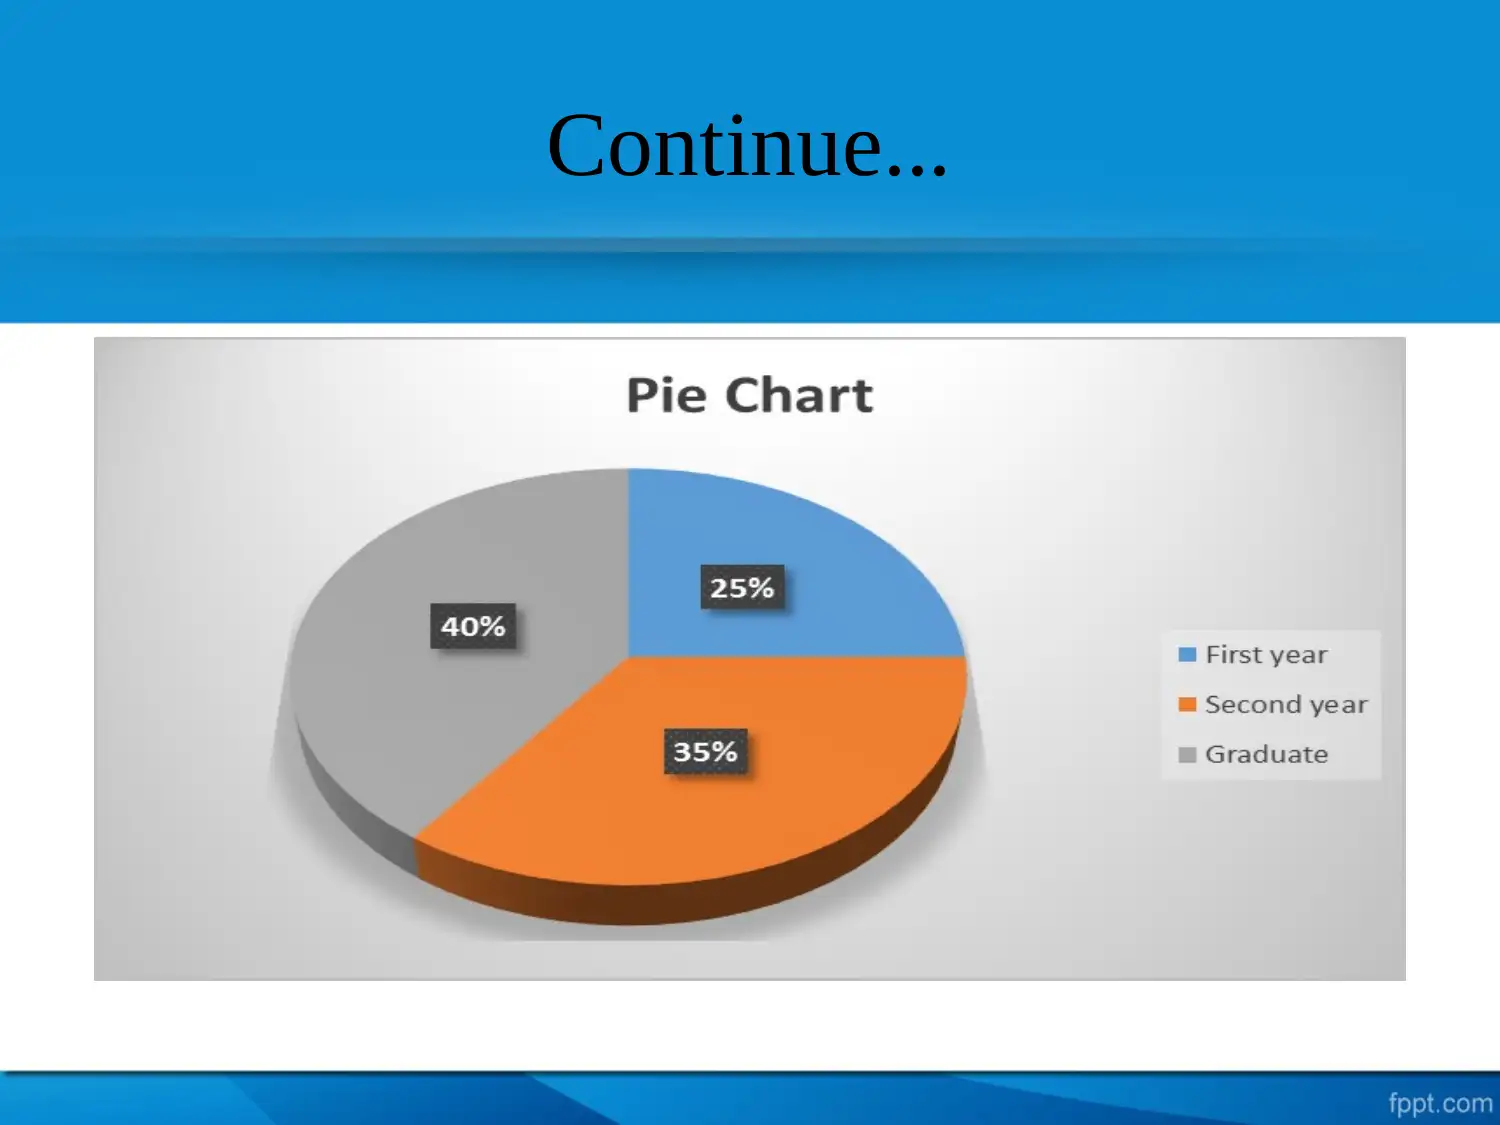
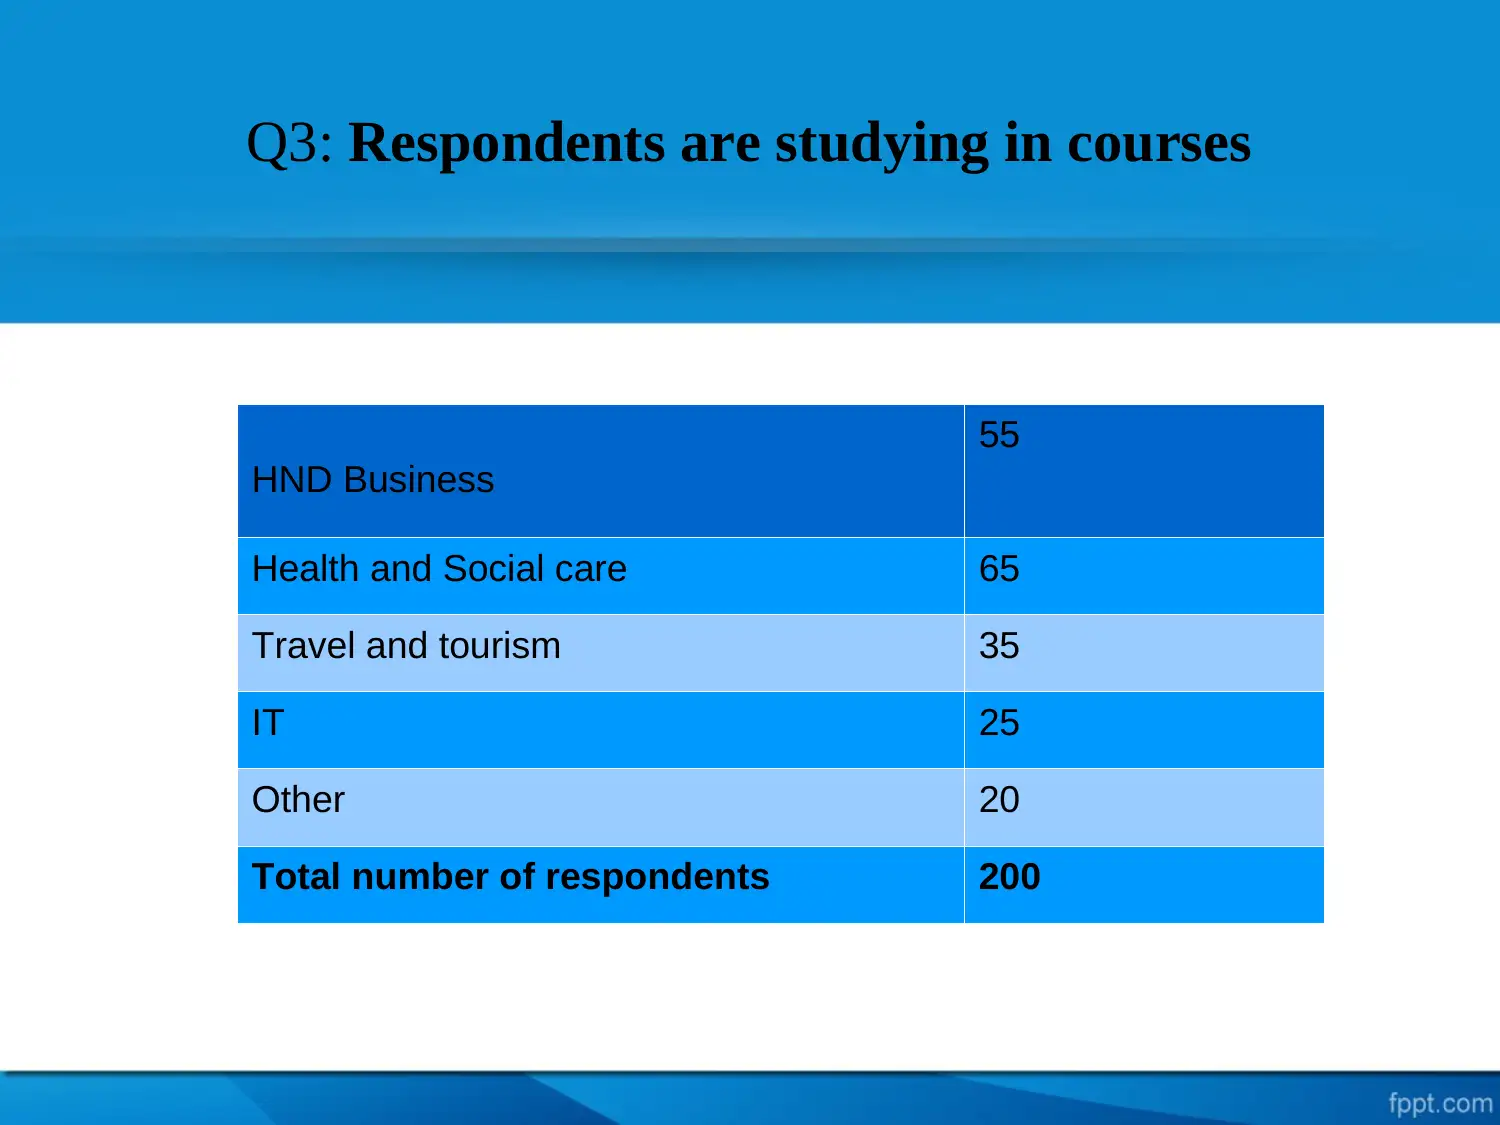
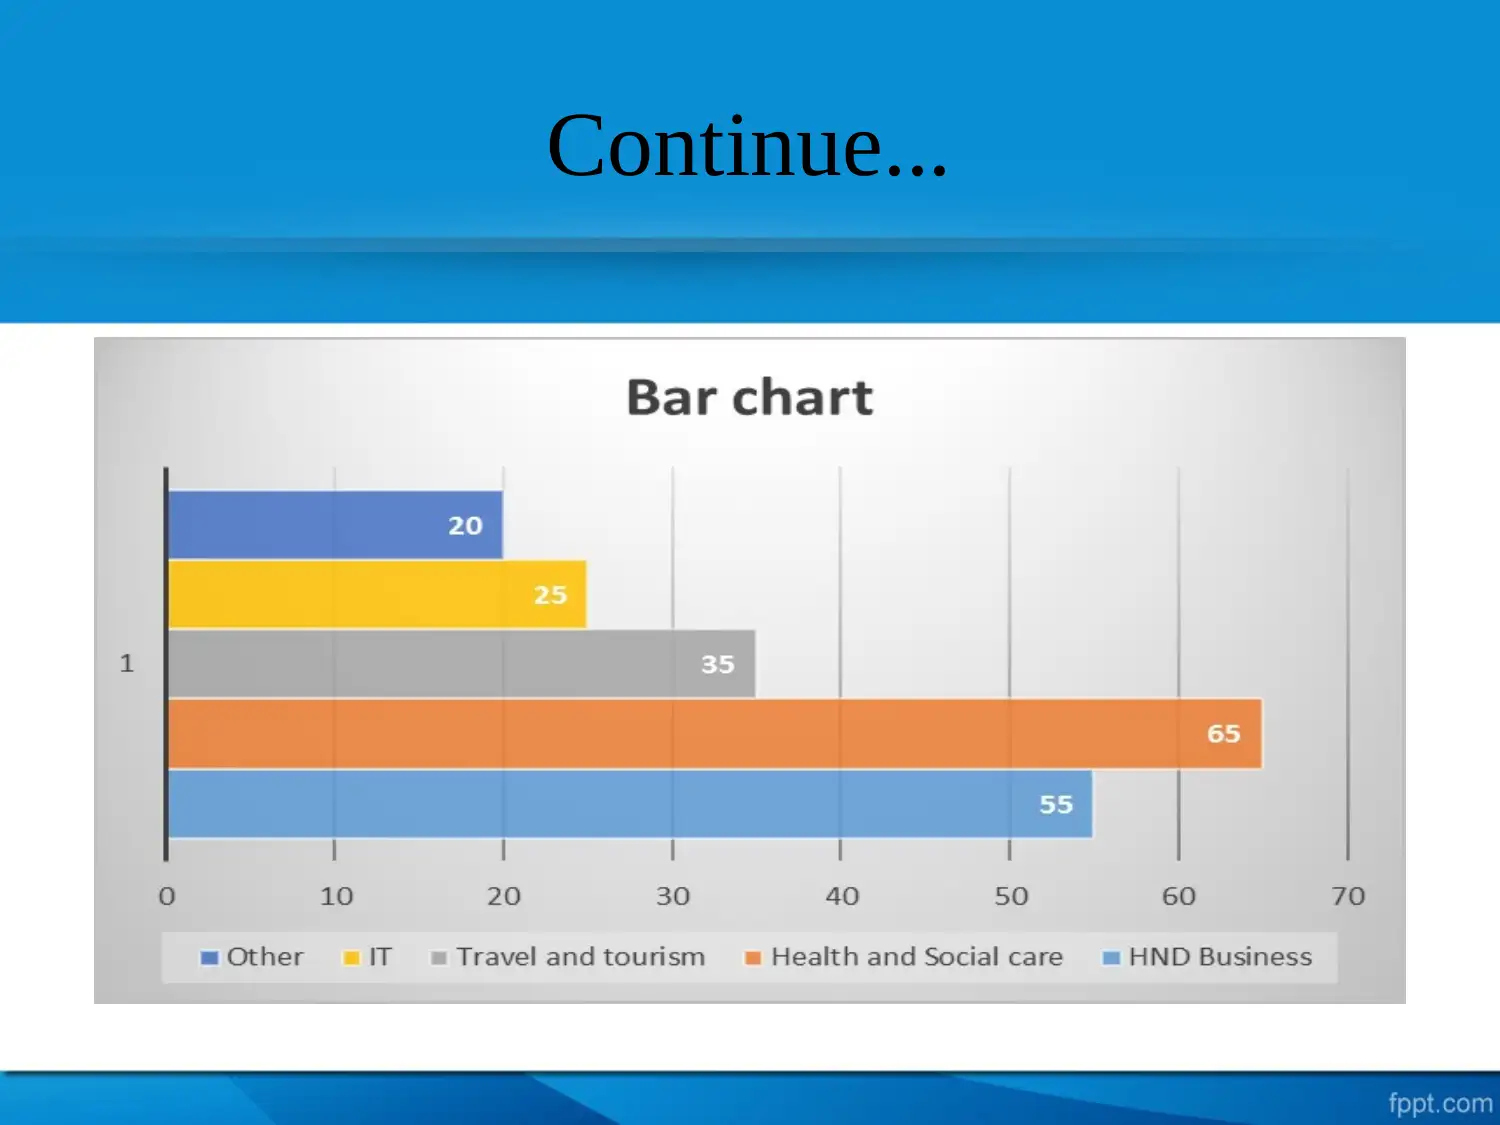
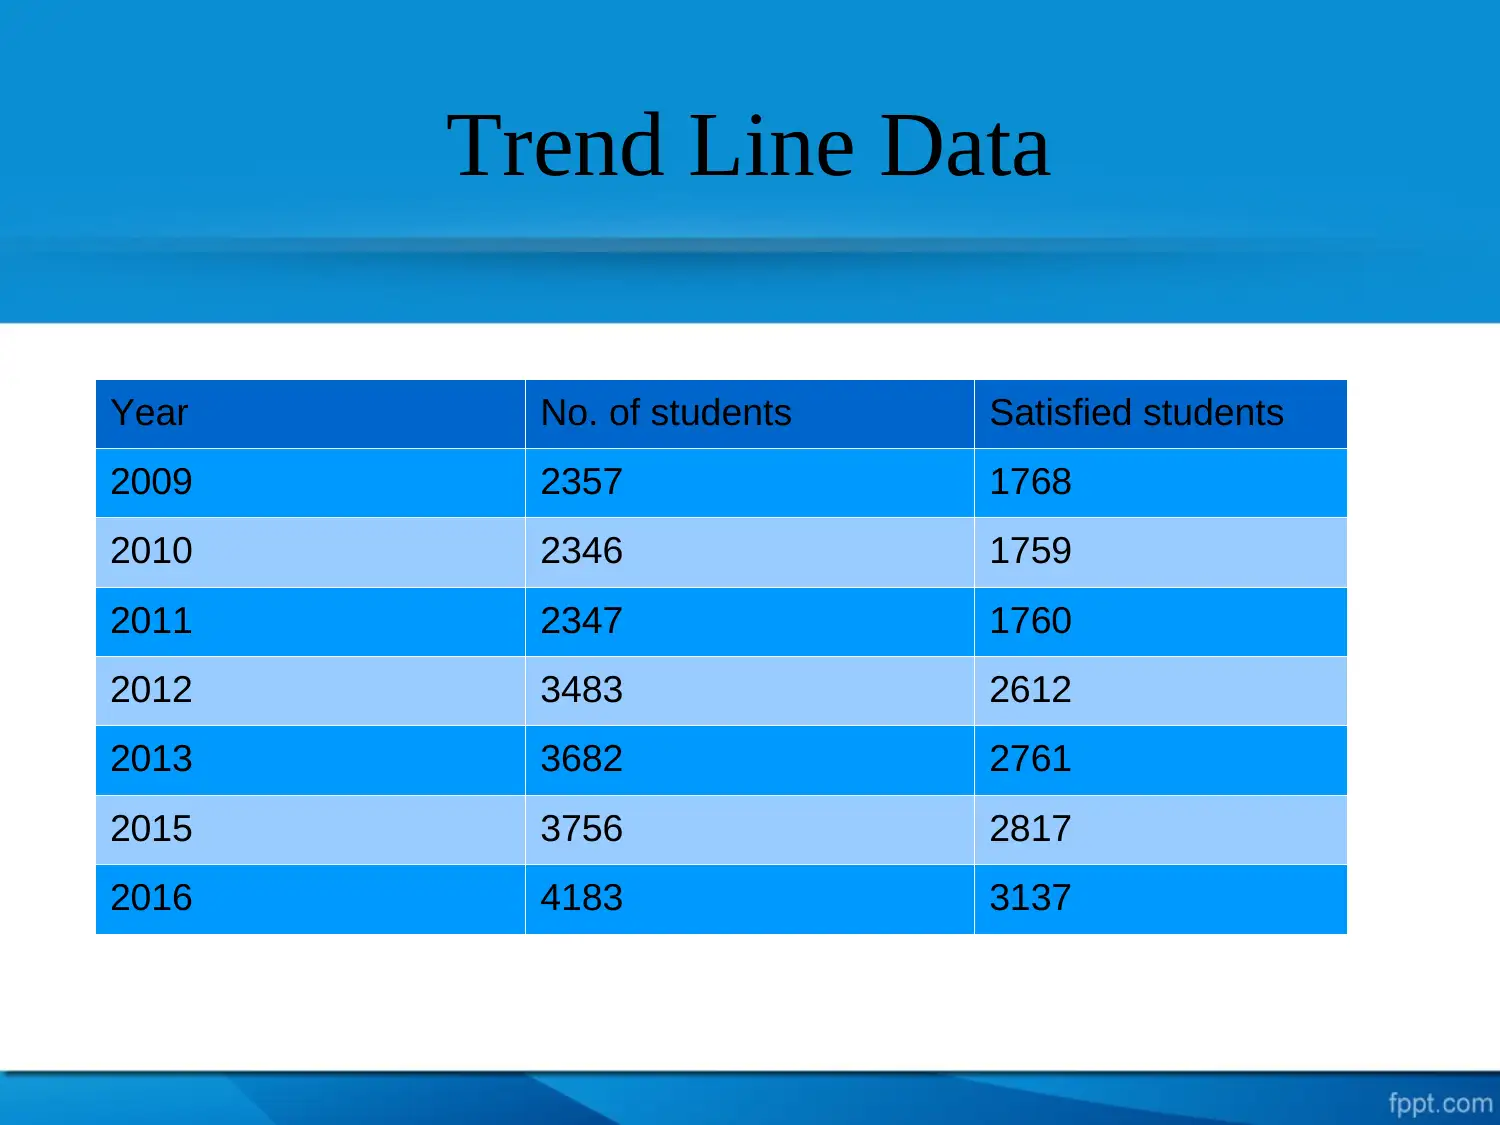
This report assesses business decision-making within UKCBC College by examining student perceptions. A research methodology employing questionnaires and a sample size of 200 respondents was used to gather data on student satisfaction across various age groups, academic years, and courses. The data interpretation includes an analysis of student satisfaction levels and enrollment trends from 2009 to 2016. Key findings indicate positive student sentiment towards UKCBC and a growing preference for online learning, with a consistent rise in student enrollment. Suggestions include focusing on practical learning, offering personal development classes, and motivating students through extracurricular activities. The report concludes that business decision-making significantly impacts UKCBC's performance, supported by charts, graphs, and references to relevant business statistics and ethics resources. Desklib provides this report and other solved assignments for students.
Document Page
BUSINESS DECISION MAKING
Task 3.3
tabler-icon-diamond-filled.svg

Paraphrase This Document

Need a fresh take? Get an instant paraphrase of this document with our AI Paraphraser
Document Page
Cover Content
Introduction
Objectives
Research methodology
Data Interpretation
Trend line
Findings
Suggestions
Conclusion
References
Document Page
Introduction
Decision making plays an dominant role in order to
determine crucial aspects in a particular project research. It is
more continuous methods to reach at valuable position.
Document Page
Objective
The main purpose of conducting well organise results they
need to determine students perception about their
UKCBC college.
tabler-icon-diamond-filled.svg

Paraphrase This Document

Need a fresh take? Get an instant paraphrase of this document with our AI Paraphraser
Document Page
A well organise methods of research is used over the customers
to know their collective reviews and their experiences.
A sample size of 200 respondents is being used in this specific
research about students thinking perspectives.
As a primary sources of data collection questionnaire is been
used.
Document Page
Data interpretation
Students’ satisfaction level:
20 or younger
50
20-25 40
25-30 60
30-40 30
40-55 15
Over 55 5
Total number of respondents 200
Document Page
Continue...
tabler-icon-diamond-filled.svg

Paraphrase This Document

Need a fresh take? Get an instant paraphrase of this document with our AI Paraphraser
Document Page
Q2. Year under which students are studying
First year
50
Second year 70
Graduate 80
Total number of
respondents
200
Document Page
Continue...
Document Page
Q3: Respondents are studying in courses
HND Business
55
Health and Social care 65
Travel and tourism 35
IT 25
Other 20
Total number of respondents 200
tabler-icon-diamond-filled.svg

Paraphrase This Document

Need a fresh take? Get an instant paraphrase of this document with our AI Paraphraser
Document Page
Continue...
Document Page
Trend Line Data
Year No. of students Satisfied students
2009 2357 1768
2010 2346 1759
2011 2347 1760
2012 3483 2612
2013 3682 2761
2015 3756 2817
2016 4183 3137
chevron_up_icon
1 out of 18
circle_padding
hide_on_mobile
zoom_out_icon
[object Object]