Business Decision Making: Data Analysis & Project Planning at UKCBC

Verified

Added on  2023/03/24

|15
|489
|20
Presentation
AI Summary
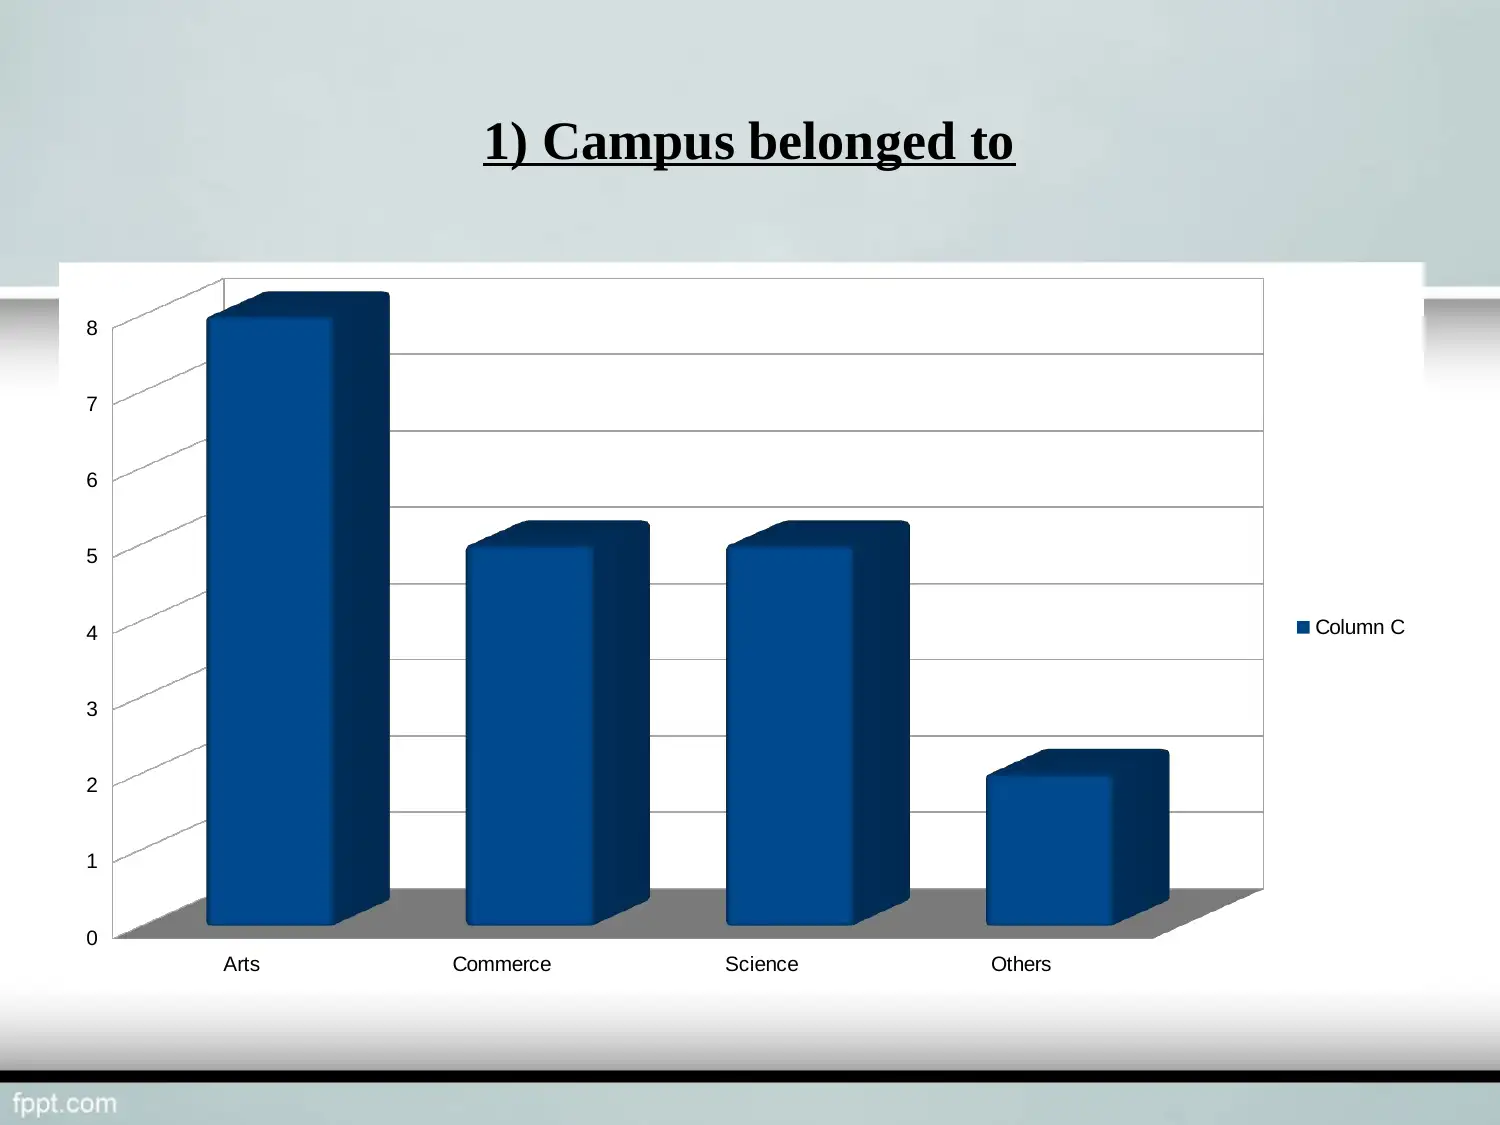
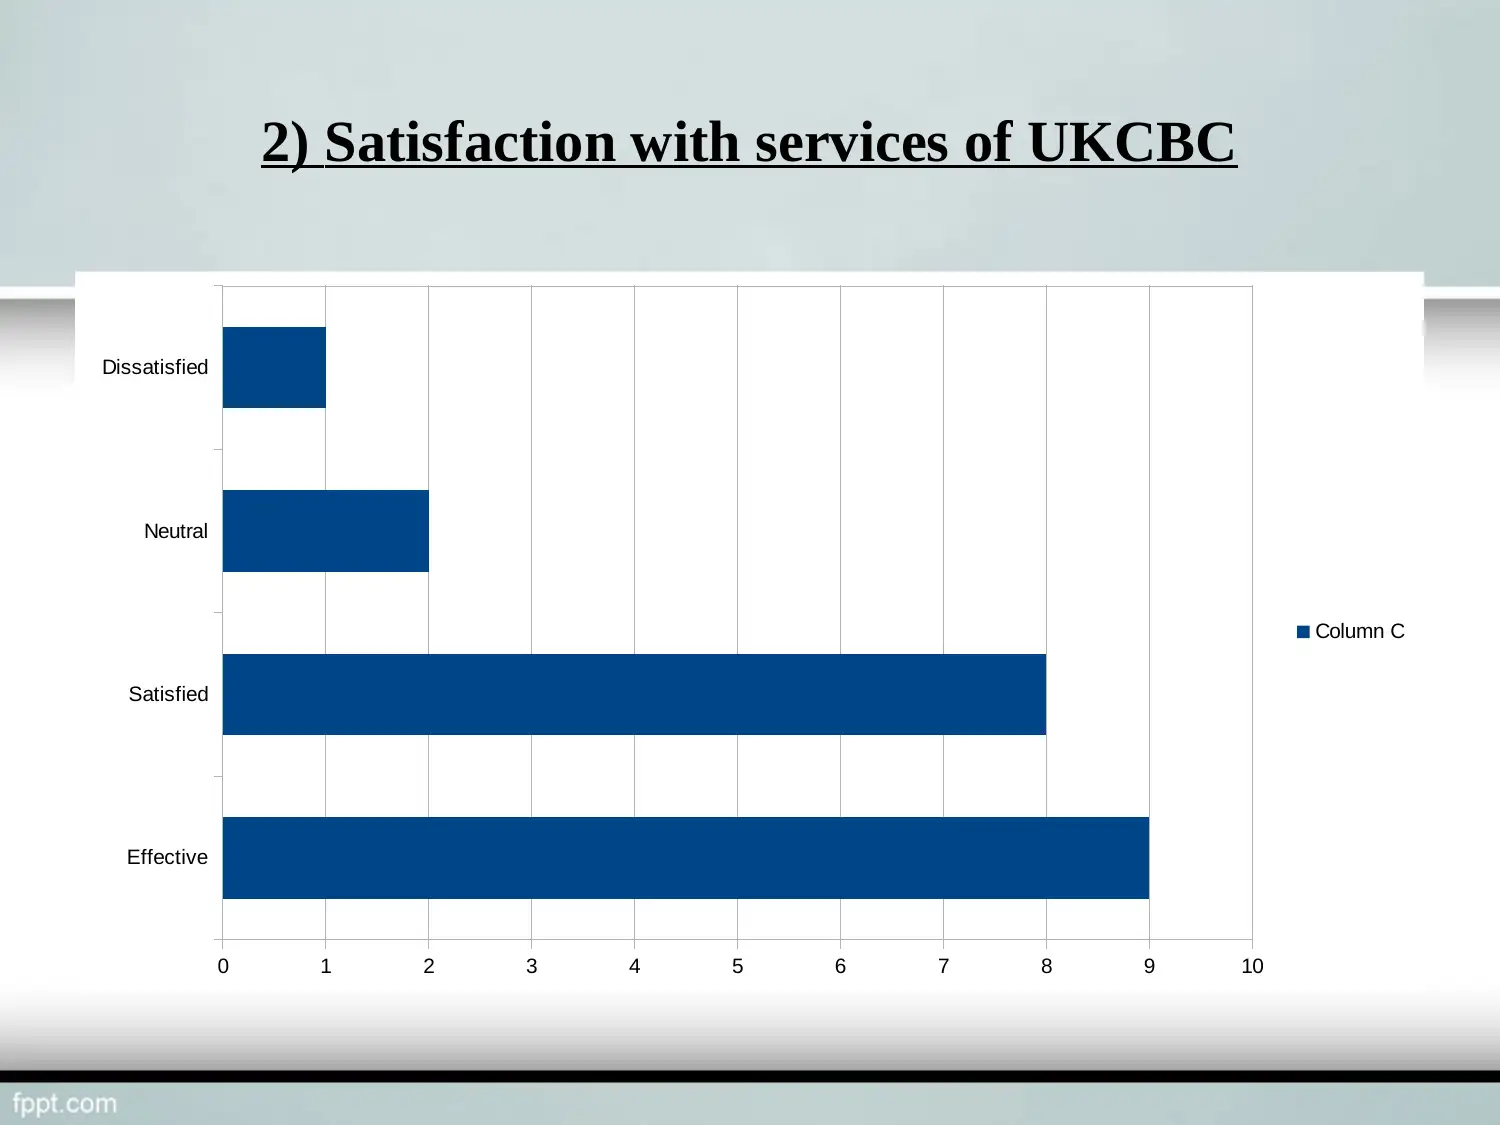
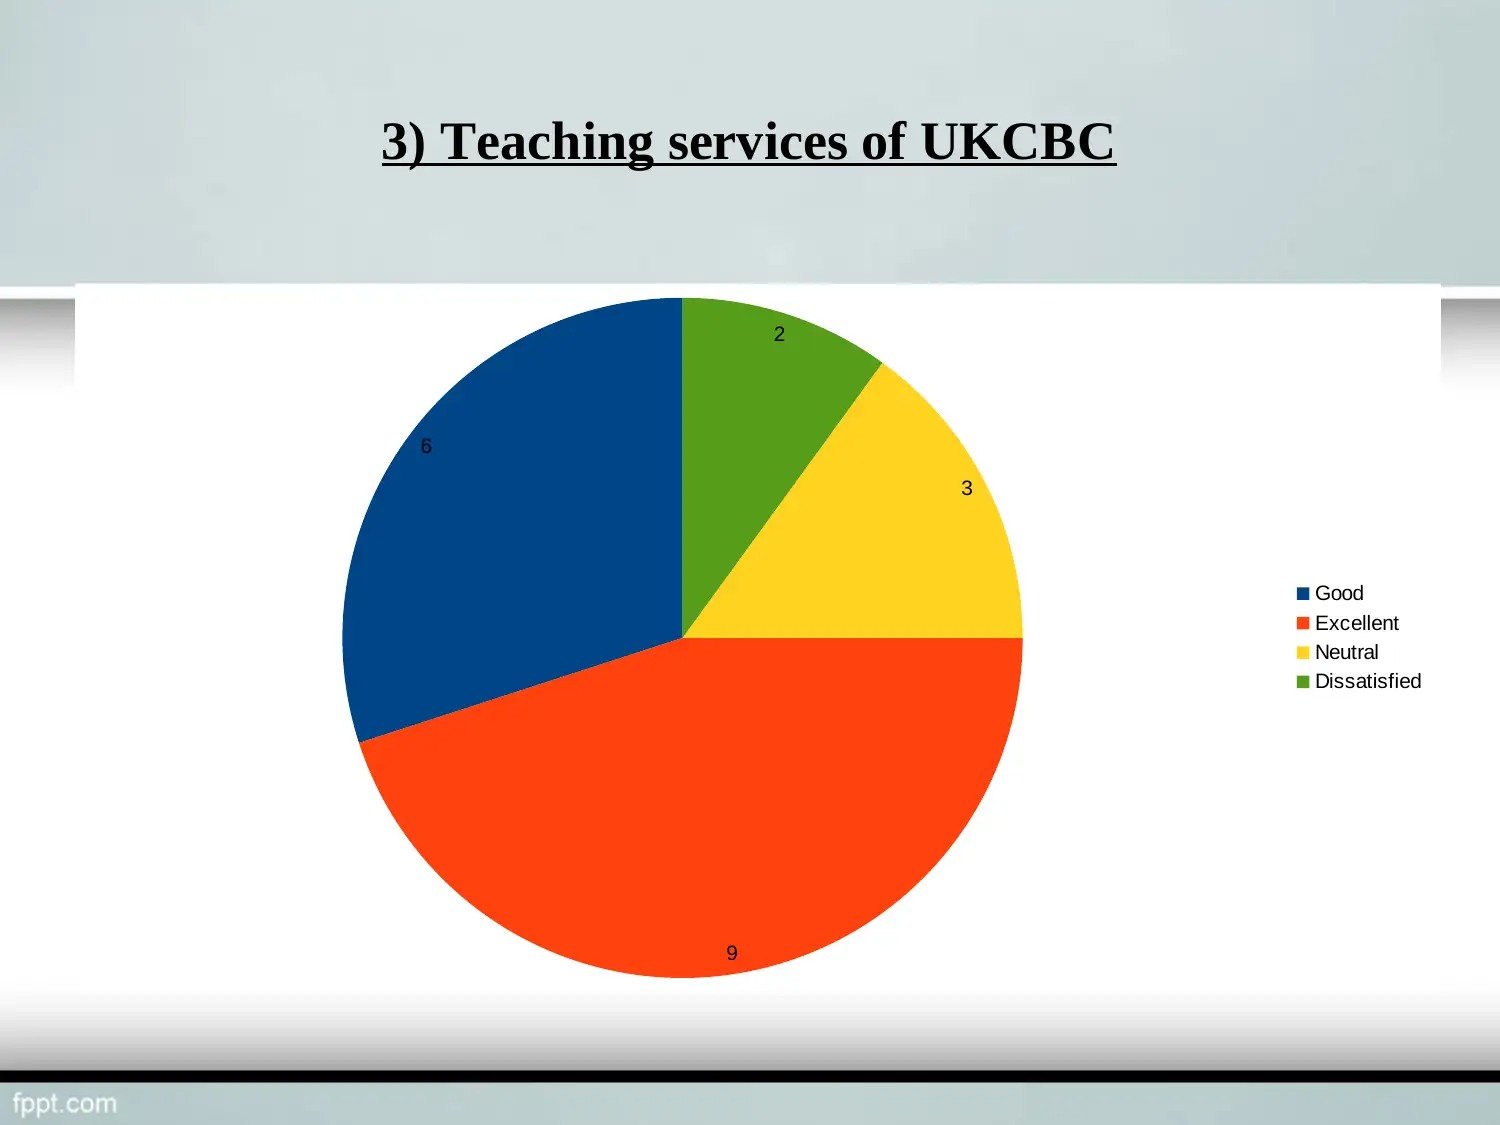
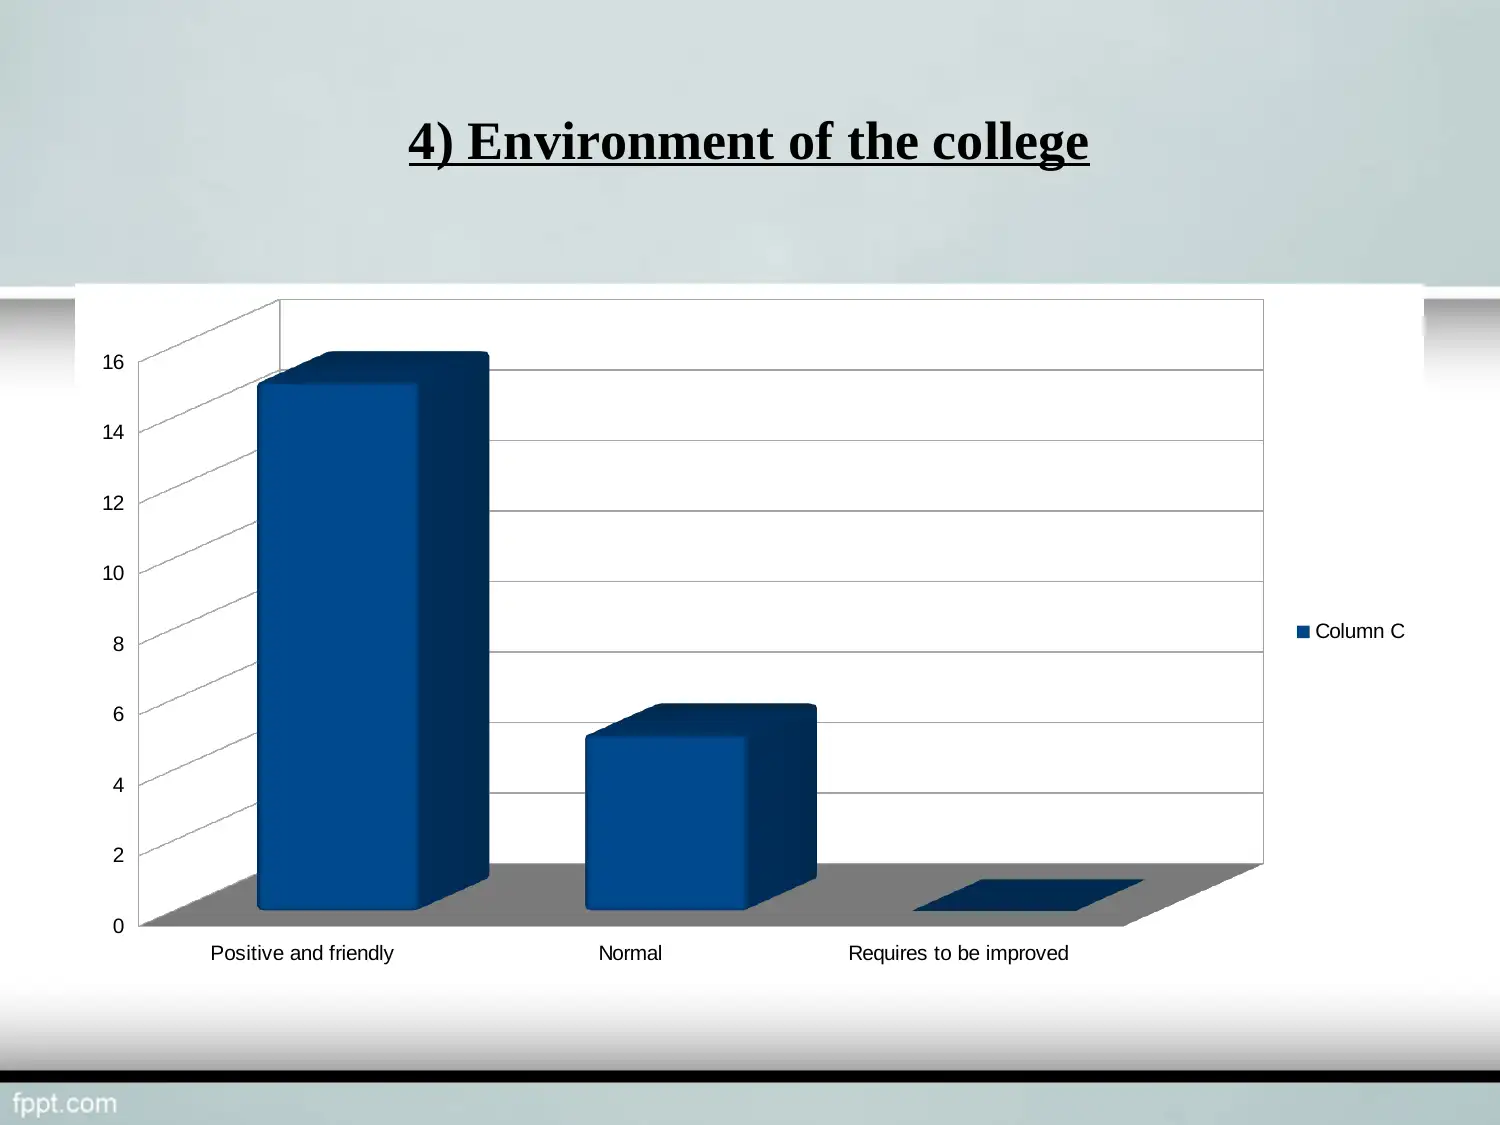
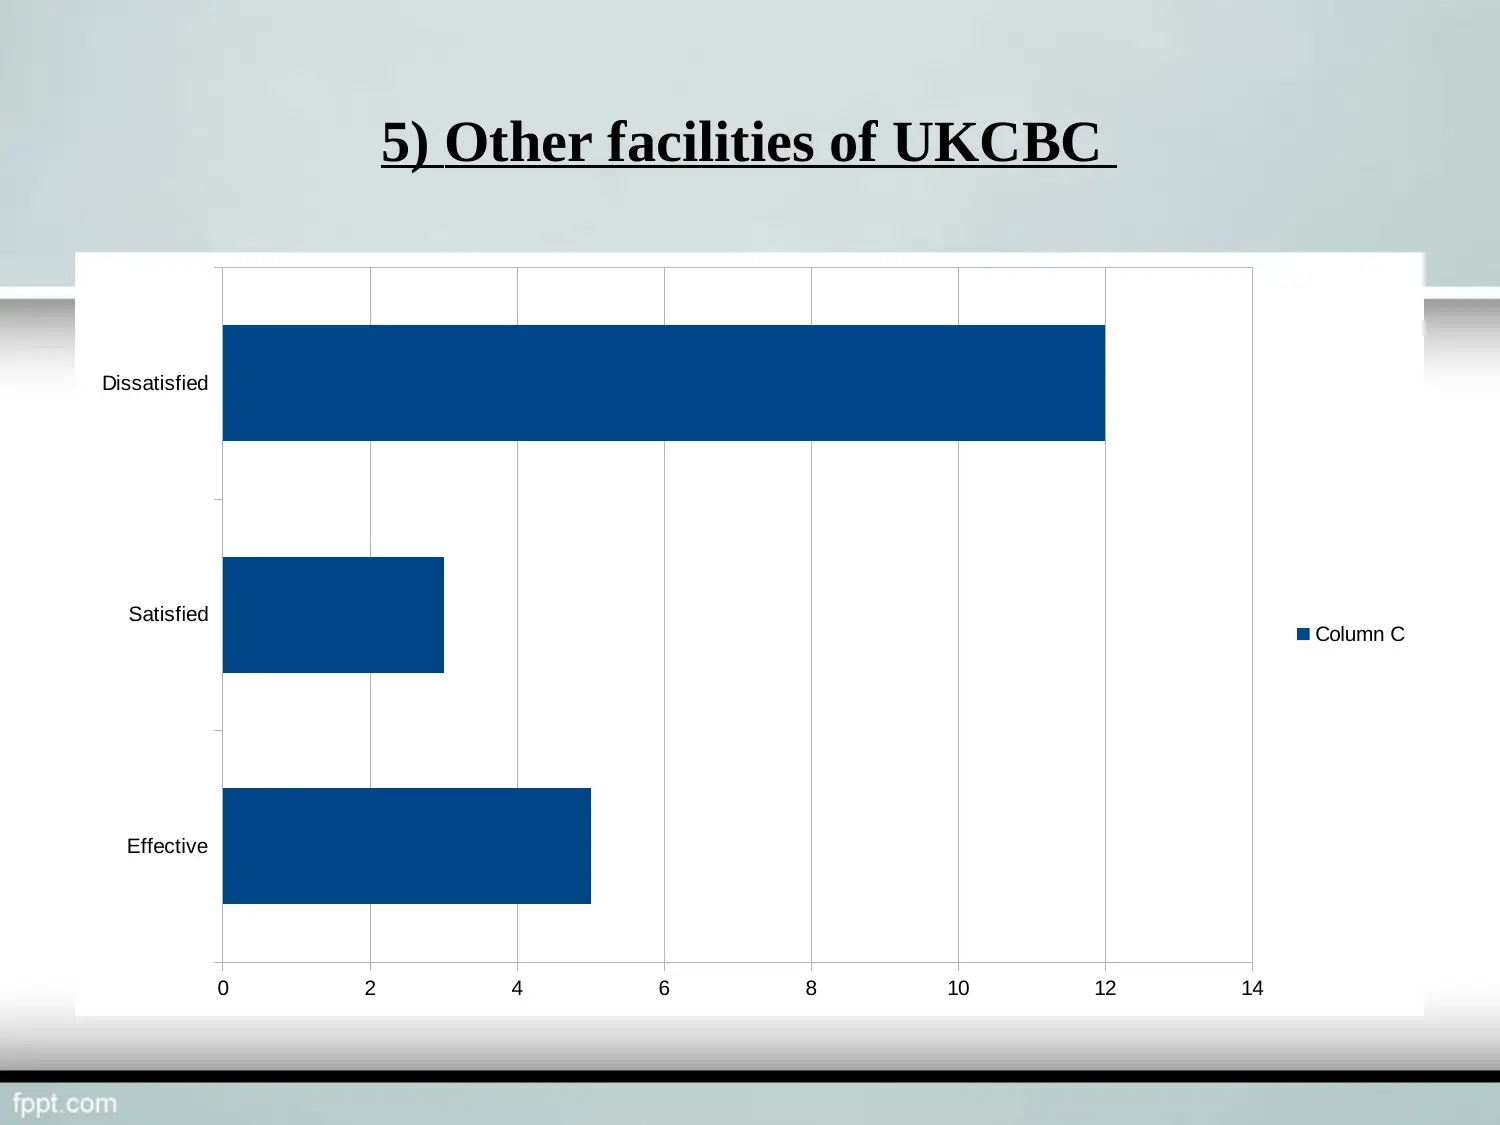
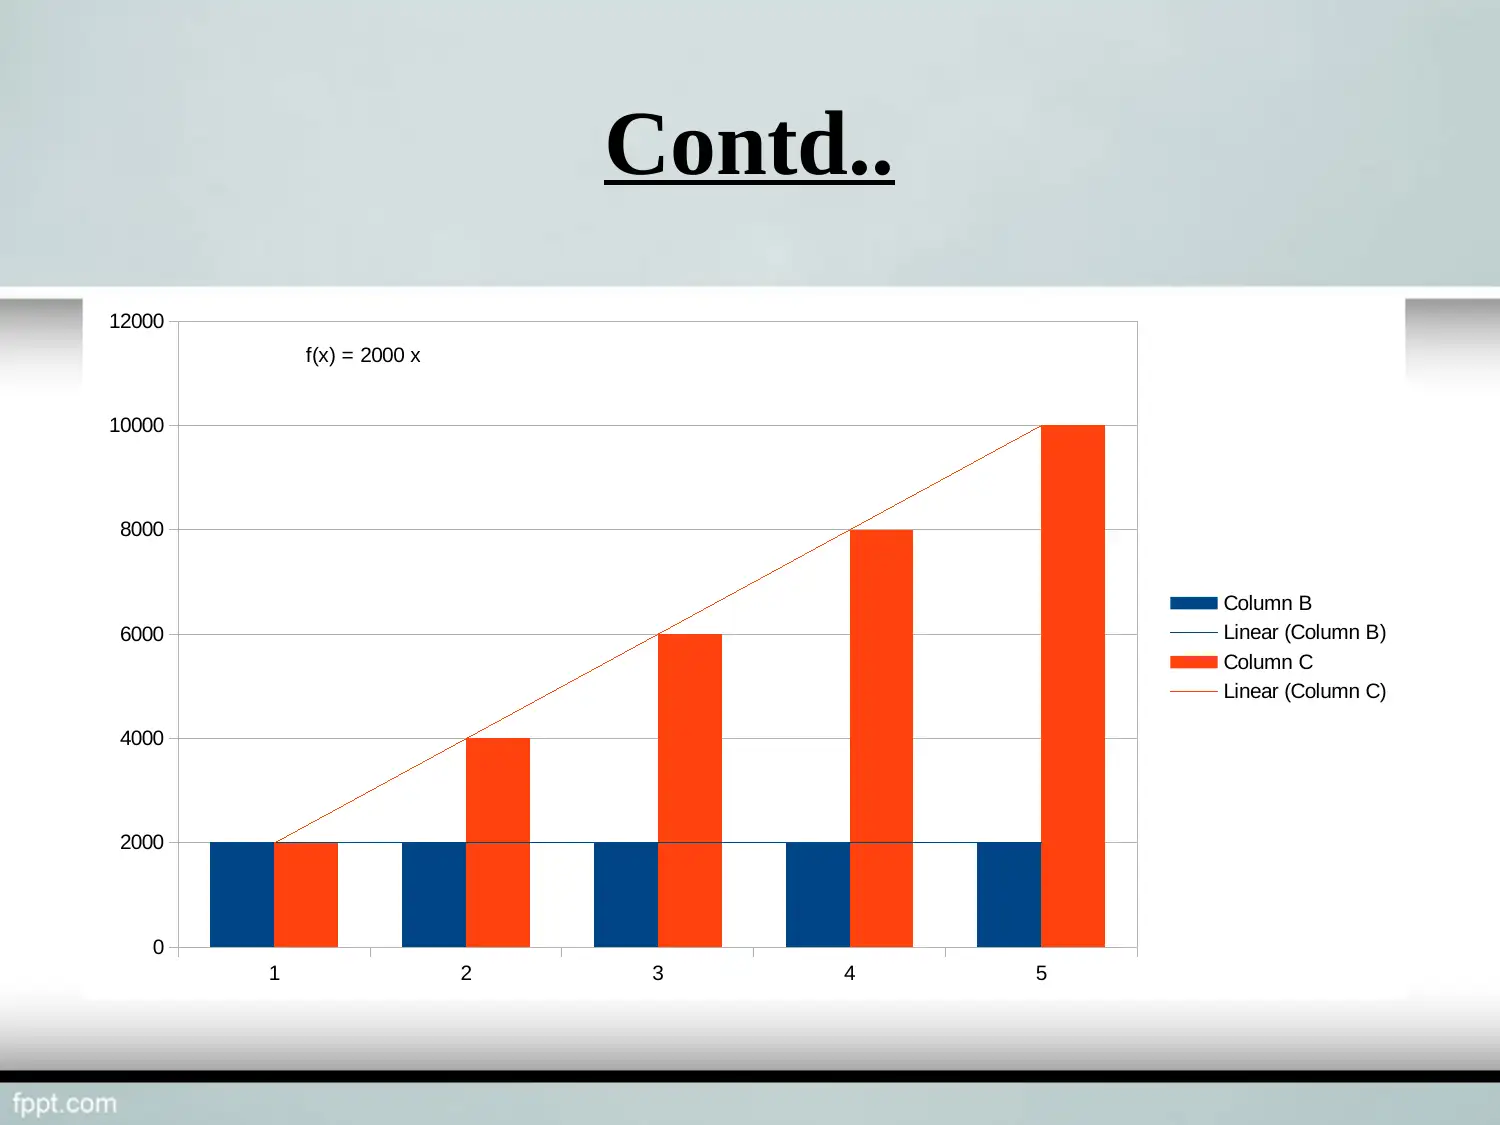
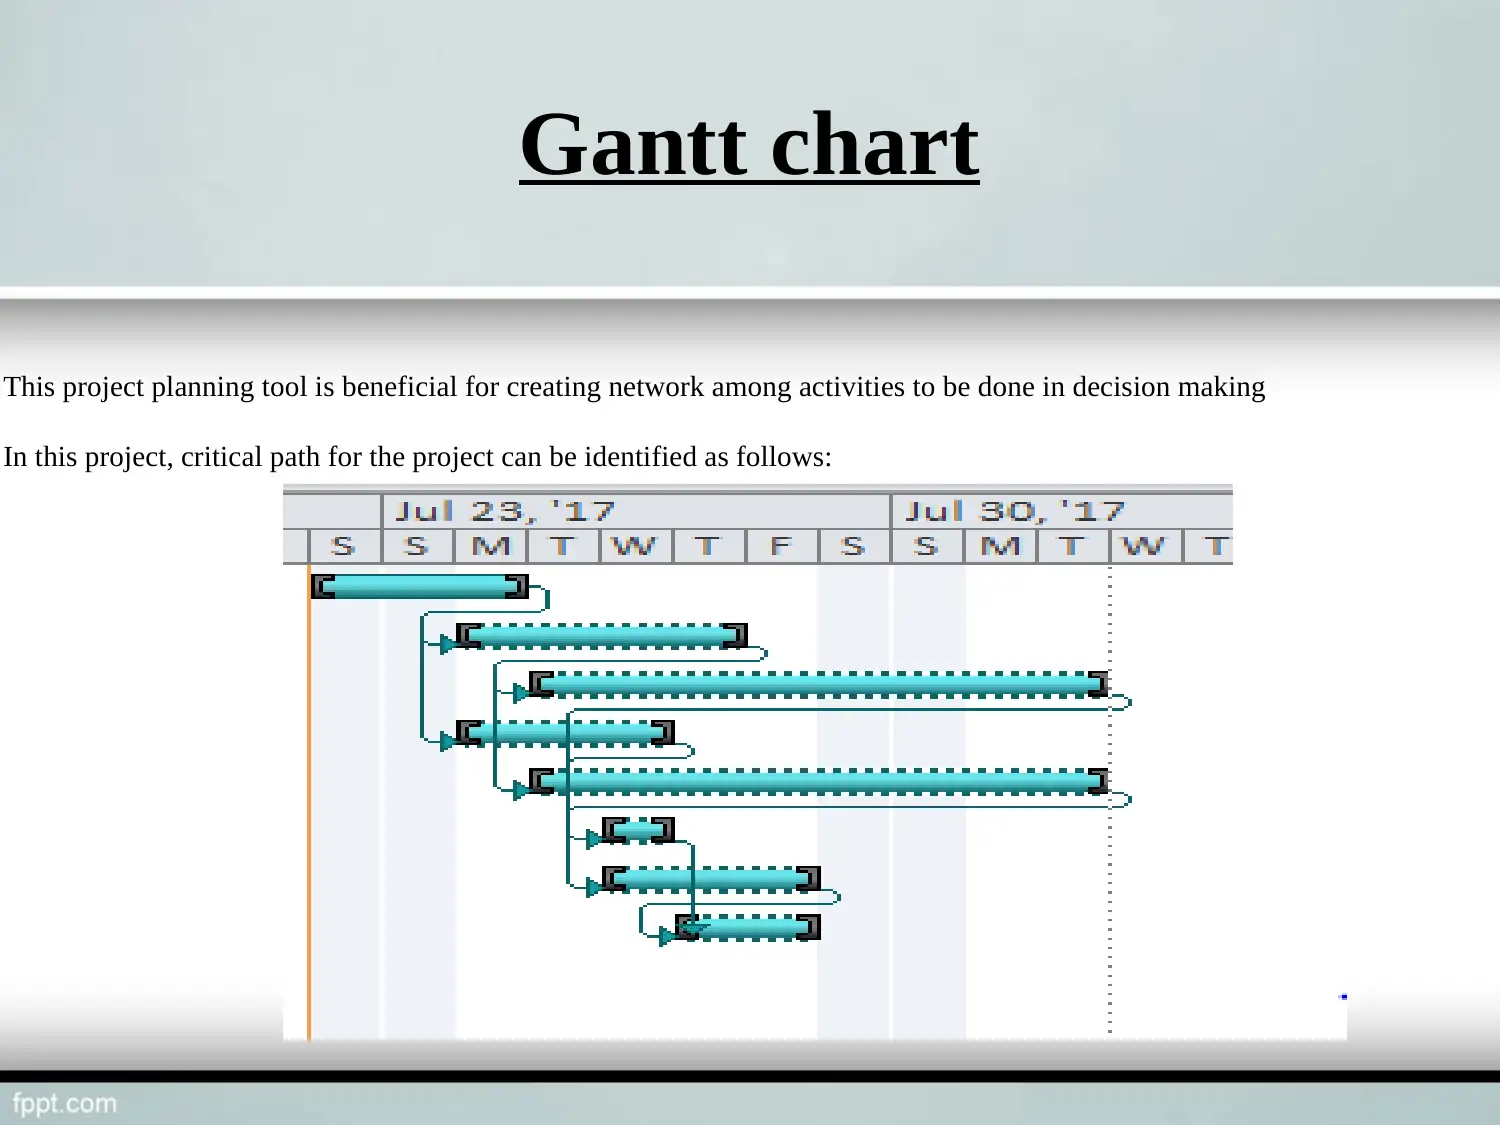
This presentation provides a comprehensive overview of business decision-making, focusing on data interpretation, forecasting, and project planning. It begins with the interpretation of collected data related to campus affiliation, satisfaction with UKCBC services, teaching quality, college environment, and other facilities, presenting the findings in graphical formats. The presentation then introduces the trend line method for forecasting future operations to enhance efficiency and service quality, using past performance data to predict student admissions. Project planning tools, including Gantt charts and network diagrams, are employed to create a structured approach to decision-making, identifying critical paths and activity networks. The presentation concludes with references to relevant research and a thank you note, highlighting the practical application of these tools in improving organizational performance. Desklib provides access to similar solved assignments for students.
Document Page
Business
Decision
making
tabler-icon-diamond-filled.svg

Paraphrase This Document

Need a fresh take? Get an instant paraphrase of this document with our AI Paraphraser
Document Page
Contents covered
Following contents are covered in this ppt:
Interpretation of collected data
Trend line method for forecasting on further activities
Project plan
Gantt chart
Network diagram
References
Document Page
Interpretation of collected data
Collected data is to be presented as below:
Campus belonged to
Satisfaction with services of UKCBC
Teaching services of UKCBC
Environment of the college
Other facilities of UKCBC
Document Page
1) Campus belonged to
Arts Commerce Science Others
0
1
2
3
4
5
6
7
8
Column C
tabler-icon-diamond-filled.svg

Paraphrase This Document

Need a fresh take? Get an instant paraphrase of this document with our AI Paraphraser
Document Page
2) Satisfaction with services of UKCBC
Effective
Satisfied
Neutral
Dissatisfied
0 1 2 3 4 5 6 7 8 9 10
Column C
Document Page
3) Teaching services of UKCBC
6
9
3
2
Good
Excellent
Neutral
Dissatisfied
Document Page
4) Environment of the college
Positive and friendly Normal Requires to be improved
0
2
4
6
8
10
12
14
16
Column C
tabler-icon-diamond-filled.svg

Paraphrase This Document

Need a fresh take? Get an instant paraphrase of this document with our AI Paraphraser
Document Page
5) Other facilities of UKCBC
Effective
Satisfied
Dissatisfied
0 2 4 6 8 10 12 14
Column C
Document Page
Trend line for forecasting
Trend line is a method of forecasting on future operation to
enhance efficiency and quality services of UKCBC.
It is done on the basis of actual performance as identifying
current position with previous years.
In this way, number of students' admission for college
courses can be identified on which forecasting is created for
the further years.
Document Page
Contd..
1 2 3 4 5
0
2000
4000
6000
8000
10000
12000
f(x) = 2000 x
Column B
Linear (Column B)
Column C
Linear (Column C)
tabler-icon-diamond-filled.svg

Paraphrase This Document

Need a fresh take? Get an instant paraphrase of this document with our AI Paraphraser
Document Page
Project planning tools
Planning for project is created as follows for UKCBC as follows:
Gantt chart
Network diagram
Document Page
Gantt chart
This project planning tool is beneficial for creating network among activities to be done in decision making
In this project, critical path for the project can be identified as follows:
chevron_up_icon
1 out of 15
circle_padding
hide_on_mobile
zoom_out_icon
[object Object]