UKCBC College: Investment Analysis for New Campus Expansion Project

Verified

Added on  2021/04/15

|19
|3409
|28
Report
AI Summary
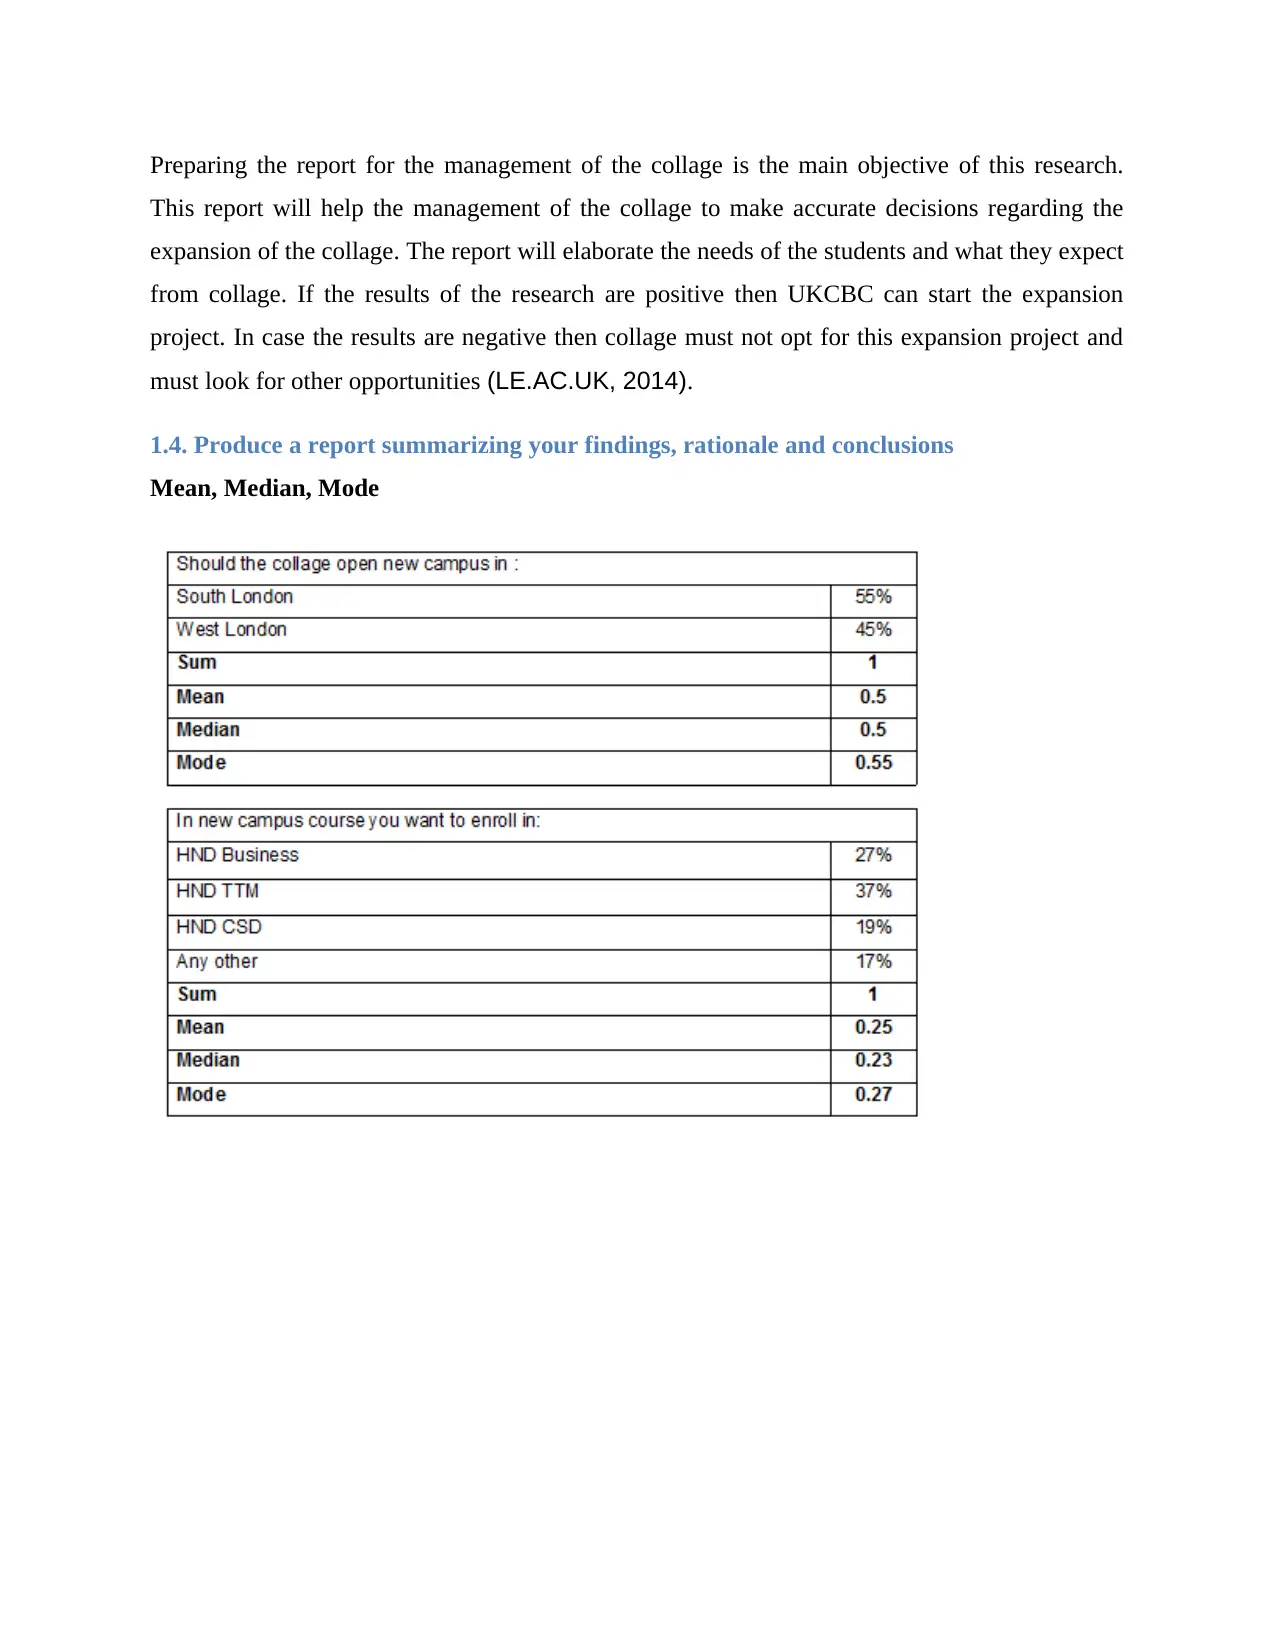
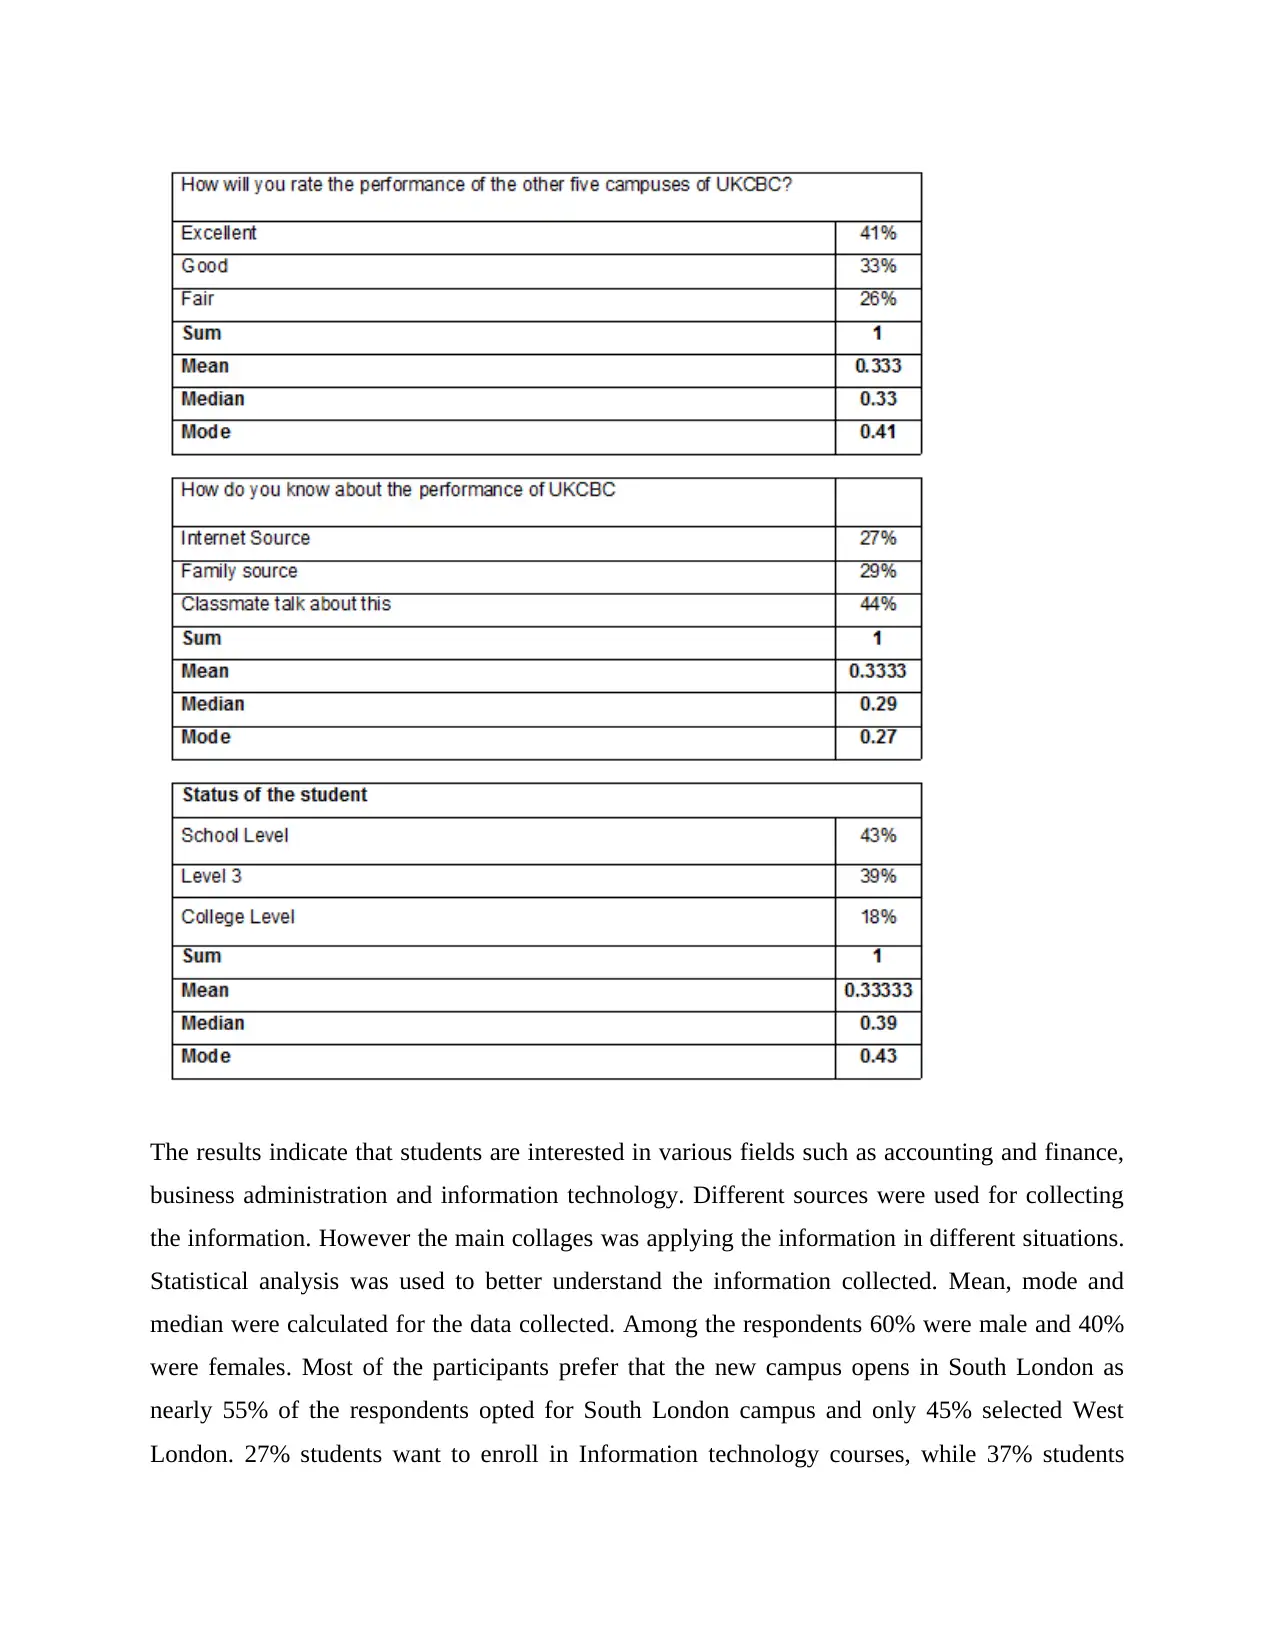
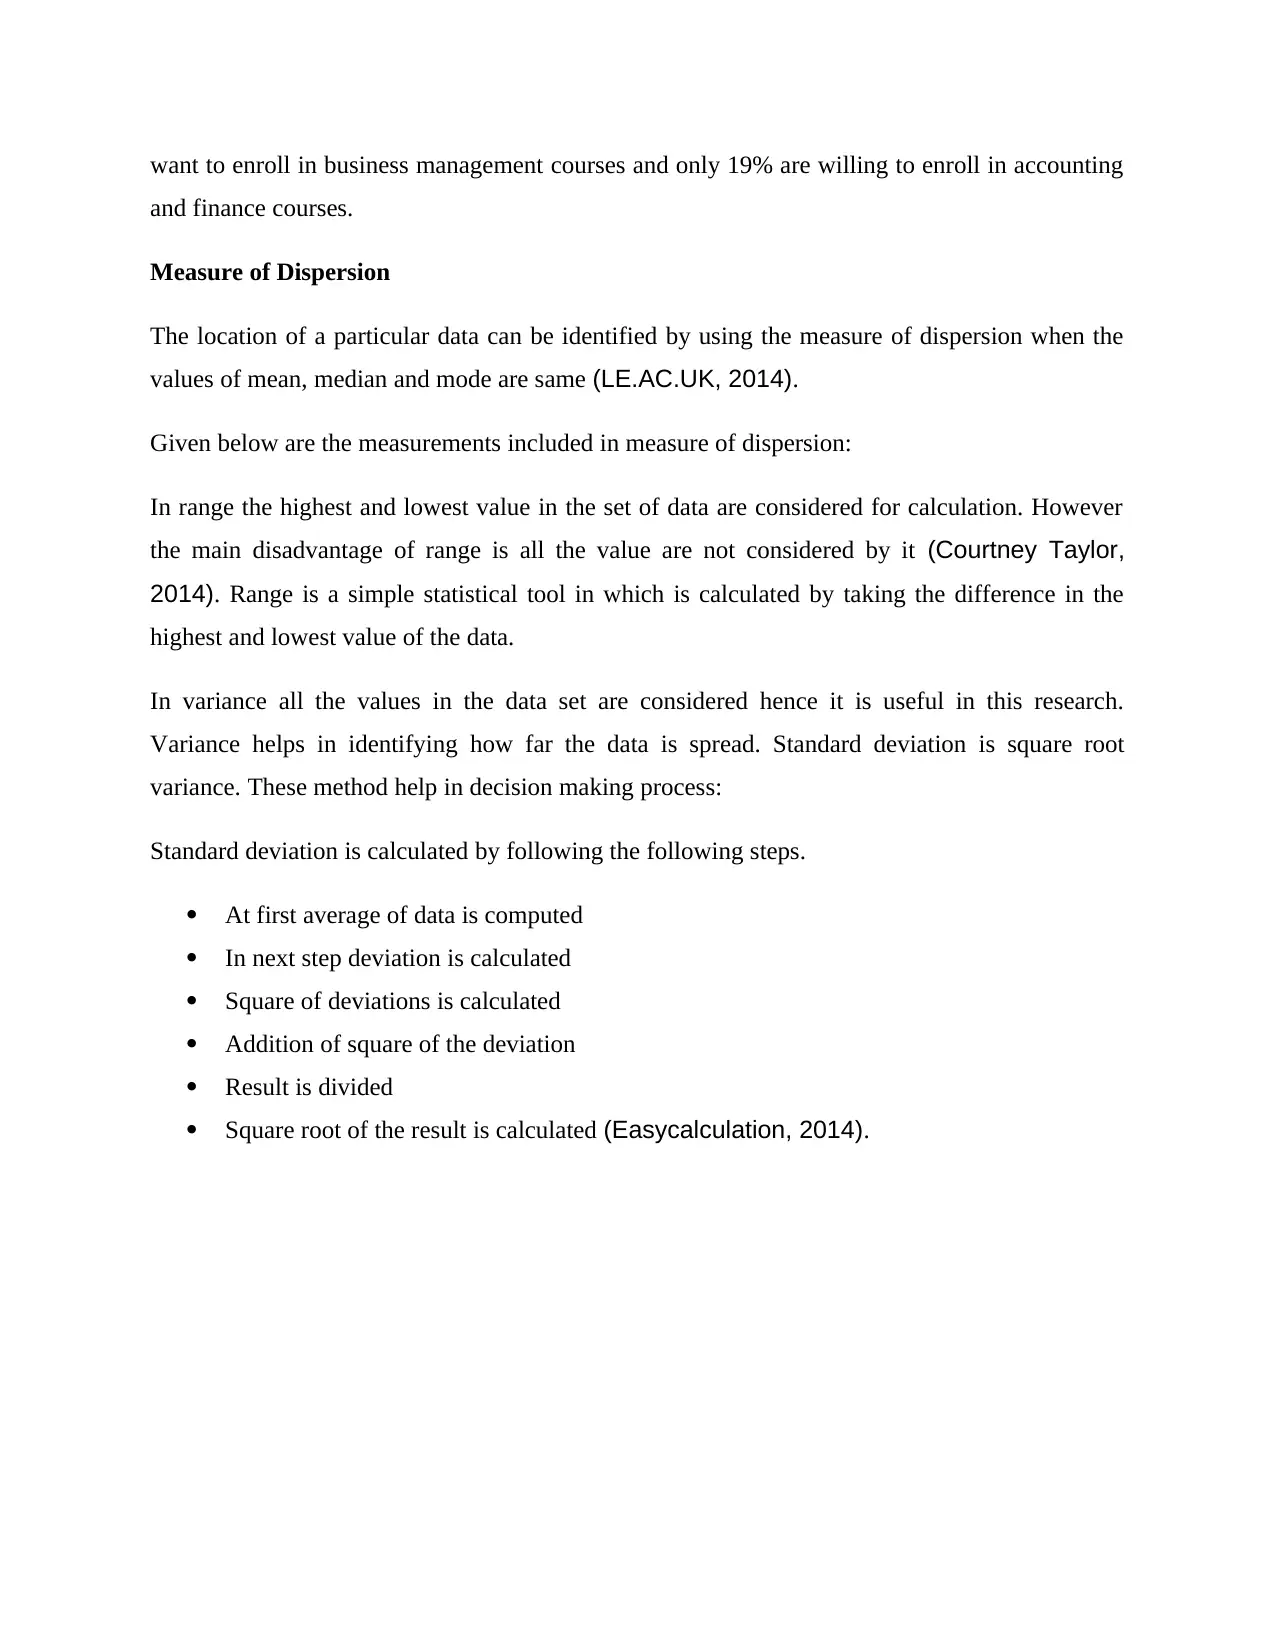
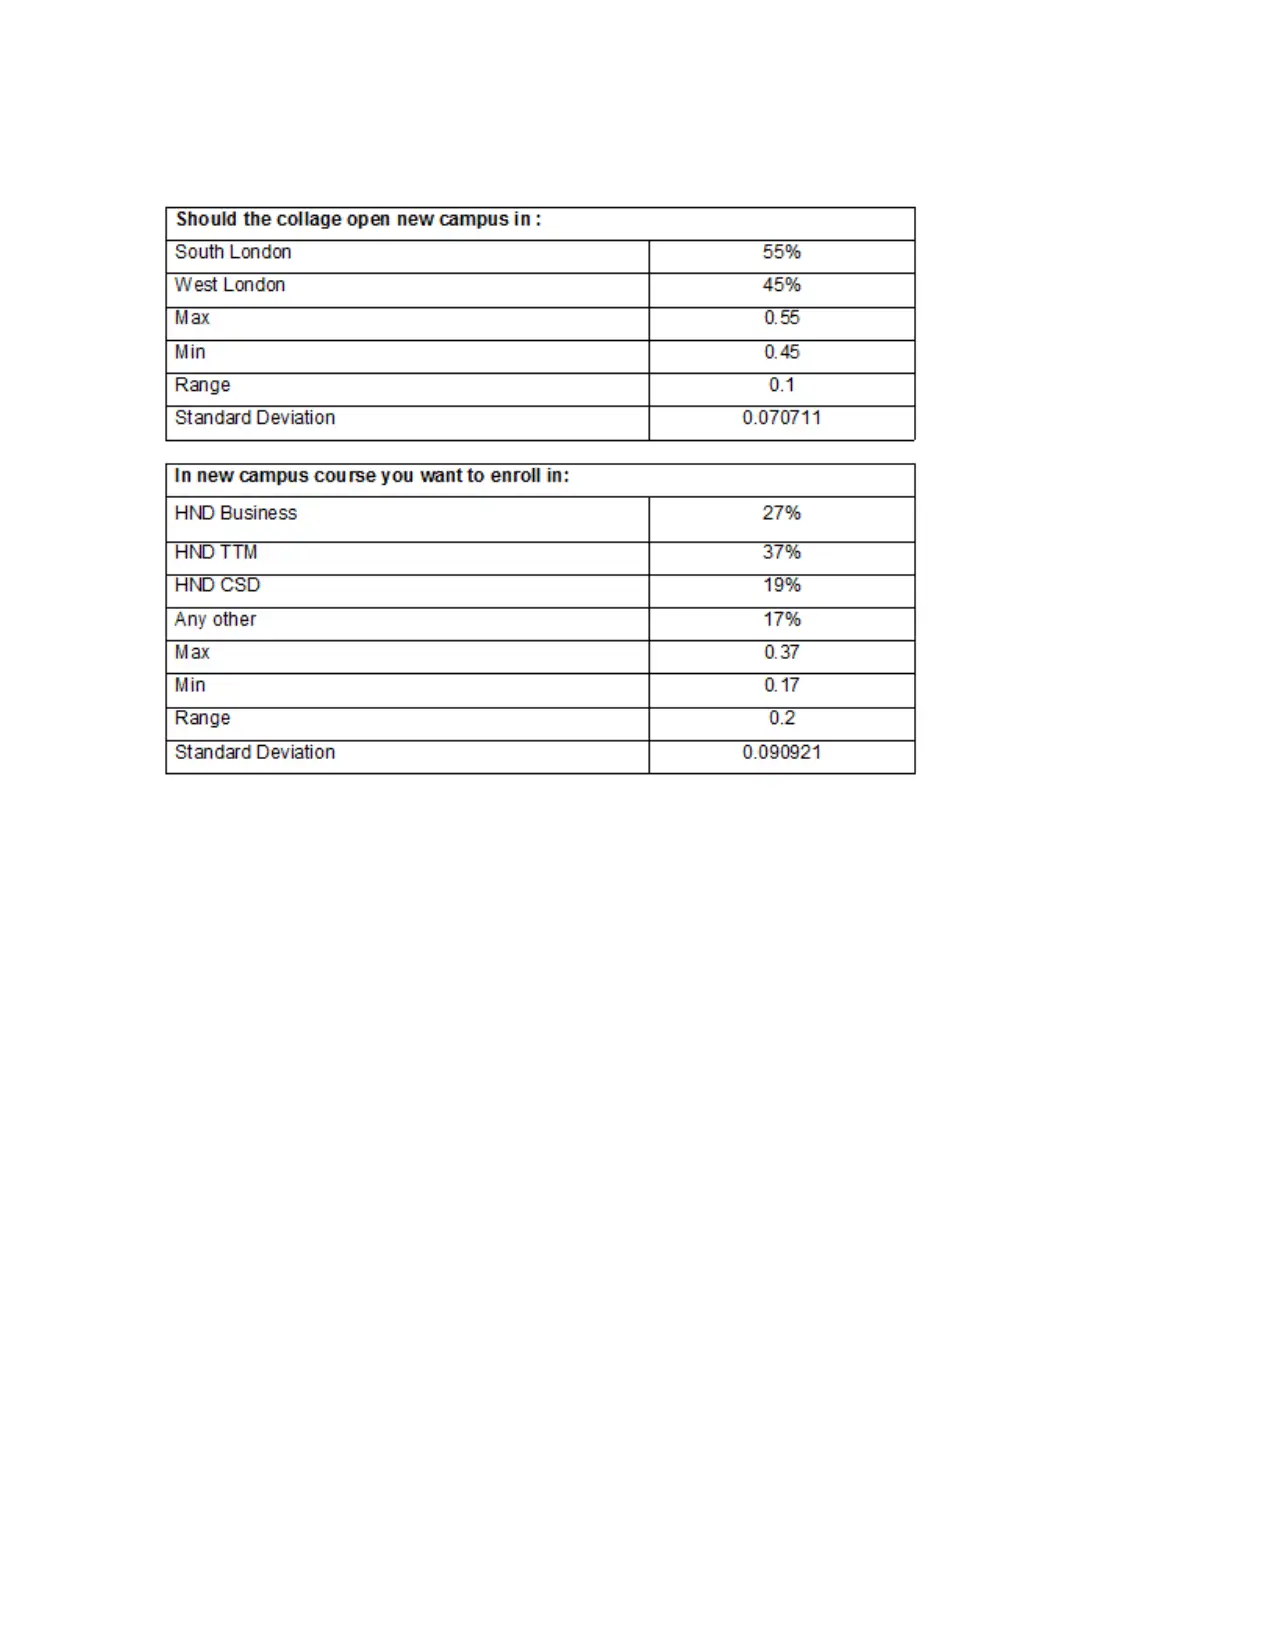
This report, focusing on UKCBC's expansion strategy, analyzes the feasibility of opening a new campus in either South or West London. The study employs both primary and secondary data collection methods, including questionnaires distributed to students to gauge their preferences for course offerings and campus locations. The report details the data collection process, including sampling techniques and the design of questionnaires. Furthermore, it presents the findings through statistical analysis, calculating mean, median, and mode, and exploring measures of dispersion such as range, variance, and standard deviation. The report also includes an overview of financial statements, comparing different formats and their appropriateness for various business types. Financial ratios are analyzed, including liquidity, profitability, efficiency, and investor ratios, to assess the financial health and performance of the college. The analysis provides valuable insights for UKCBC's management to make informed decisions regarding the expansion project, considering student needs, financial implications, and market opportunities.
Document Page
tabler-icon-diamond-filled.svg

Paraphrase This Document

Need a fresh take? Get an instant paraphrase of this document with our AI Paraphraser
Document Page
Introduction
This assignment is based on UK collage of business and computing (UKCBC). In the UK it is a
well reputed collage and has five campuses in Essex and London. The aim of the management of
the collage is to make it a leading collage in the UK. Management of the collage is focusing on
expansion opportunities in the west and East London. In this assignment different aspects if
investment will be considered for starting a new campus.
Task 1
1.1. Create a plan to collect primary and secondary data
Primary Research Data
Data that will be required by UKCBC can be collected using two main sources, which are
primary source and secondary source. Based on these sources data collection methods can be
categorized as Primary data collection and secondary data collection.
Primary Data Collection
In primary data collection all the data is collected from the original source such as experiment,
observation and evaluation. The information collected by this method is new information as the
information is not available in the market. As information is not available researcher has to
collect all the data by conducting survey (Fao, 2013).
Primary data can be collected by using instruments like questionnaire and interviews. For the
collection of information both these methods are considered as useful.
Secondary Data Collection
In secondary data is already available in the market. The information is previously collected by
some other researcher for a different purpose. Secondary source of data is considered as less
reliable then the primary data collection method (Investorwords, 2014).
To collect relevant information major focus is given to primary source of data collection as
accurate information is necessary to successfully complete this assignment. Secondary source of
Document Page
information is also used in this assignment to collect information about the market and
competitors.
1.2. Choose appropriate survey methods, sampling techniques and questionnaires
Sources
In this assignment primary data collection method is mainly used for collecting the data.
Methods used for primary data collection includes interviews and questionnaires.
Interviews
Interview is an important source of data collection as more reliable information can be collected
by directly interacting with the participants. Interview helps the research in identifying the key
points about the research topic that will improve the quality of research. Credibility of decision
making process is also increased by obtaining the perspectives of different people. Interviews
can be conducted face to face or on telephone. The result of face to face is more reliable then
telephonic interview. Hence face to face interviews of the students about the courses of the
collage were conducted in this assignment. Different question were asked during the interview
and the information was kept and a single point for decision making. Interview was not the main
focus of this research as main focus was place on questionnaire (Okstate, 2014).
Questionnaire
In questionnaire a set of questions are prepared by the researcher, which are then distributed
among the participants. The responses of the participants are then analyzed by the researcher to
make decisions (Okstate, 2014).
Name: _____________
Gender:
Male
Female
Status of the student:
Document Page
School Level
Level 3
College Level
Should the collage open new campus in:
South London
West London
In new campus course you want to enroll in:
HND Business
HND TTM
HND CSD
Any other
How will you rate the performance of the other five campuses of UKCBC?
Excellent
Good
Fair
How do you know about the performance of UKCBC?
Internet Source
Family source
Classmate talk about this
All the information collected is strictly for the purpose if research and will be kept confidential
1.3. Collect data using your plan and sampling methods
150 questionnaires were distributed among the students of the collage. Respondents of the
research were randomly selected. Out of 150 respondents only 120 were willing to provide
response to the questionnaire. 150 questionnaires were distributed in the areas of West and south
London
tabler-icon-diamond-filled.svg

Paraphrase This Document

Need a fresh take? Get an instant paraphrase of this document with our AI Paraphraser
Document Page
Preparing the report for the management of the collage is the main objective of this research.
This report will help the management of the collage to make accurate decisions regarding the
expansion of the collage. The report will elaborate the needs of the students and what they expect
from collage. If the results of the research are positive then UKCBC can start the expansion
project. In case the results are negative then collage must not opt for this expansion project and
must look for other opportunities (LE.AC.UK, 2014).
1.4. Produce a report summarizing your findings, rationale and conclusions
Mean, Median, Mode
Document Page
The results indicate that students are interested in various fields such as accounting and finance,
business administration and information technology. Different sources were used for collecting
the information. However the main collages was applying the information in different situations.
Statistical analysis was used to better understand the information collected. Mean, mode and
median were calculated for the data collected. Among the respondents 60% were male and 40%
were females. Most of the participants prefer that the new campus opens in South London as
nearly 55% of the respondents opted for South London campus and only 45% selected West
London. 27% students want to enroll in Information technology courses, while 37% students
Document Page
want to enroll in business management courses and only 19% are willing to enroll in accounting
and finance courses.
Measure of Dispersion
The location of a particular data can be identified by using the measure of dispersion when the
values of mean, median and mode are same (LE.AC.UK, 2014).
Given below are the measurements included in measure of dispersion:
In range the highest and lowest value in the set of data are considered for calculation. However
the main disadvantage of range is all the value are not considered by it (Courtney Taylor,
2014). Range is a simple statistical tool in which is calculated by taking the difference in the
highest and lowest value of the data.
In variance all the values in the data set are considered hence it is useful in this research.
Variance helps in identifying how far the data is spread. Standard deviation is square root
variance. These method help in decision making process:
Standard deviation is calculated by following the following steps.
At first average of data is computed
In next step deviation is calculated
Square of deviations is calculated
Addition of square of the deviation
Result is divided
Square root of the result is calculated (Easycalculation, 2014).
tabler-icon-diamond-filled.svg

Paraphrase This Document

Need a fresh take? Get an instant paraphrase of this document with our AI Paraphraser
Document Page
Document Page
Quartiles, Percentiles and the Correlation Coefficient
Quartile: The entire data is divided into four equal groups or parts in quartile. The total value of
these four groups is equal to hundred percent of the data. 25% of cumulative data o is
encompassed in every group of quartile (Tibco, 2014). In other words, quartile divided the data is
a way that helps in easily understanding the data (Icoachmath, 2013).
Document Page
Percentiles: In percentile the data is separated in100 equal parts and helps in understanding the
relation of attractiveness in the data (Merriam Webster, 2015).
In statistics percentile is a measure used to calculate the value below a percentage of observation
is a given set of data. For instance 20th percentile is the score below which twenty percent of the
observation might be found. If student scores 85% in the test conducted in the class then it is
important to compare the score of 77% the student will be positioned at the 77th percentile.
(Education portal, 2014)
Correlation Coefficient: symbol “r” represents correlation and its results are between +1 and -1.
Correlation indicates the ration between the two variables. Value close of -1 show weak relation
and vice versa. The two variables that are related in the above case are the courses available and
satisfaction of the student (Easycalculation, 2014).
Task 2
2.1. Explanation and interpretation of the main types of financial statement
Financial statement helps the stakeholders in understanding the financial situation and
performance of the company. There are four basic financial statements, which are:
Income statement: Revenue, expenses and profits and loss earned by the company during a given
financial year is presented in this statement. As the operation outcome of the business are
presented in income statement hence it is considered are most significant financial statement.
Balance sheet: Assets, liability and equity of the business in the reporting date is presented by
this statement. The report is formatted in a way that total of all assets is equal to total of
liabilities and equity, which is also known as accounting equation. This statement provides the
information about the liquidity and capitalization of the company hence it is considered as
second most significant financial statements.
Statement of cash flows: All the cash inflow and outflow during the accounting period is
presented in this report. Useful comparison to income stamen can be provided by this
particularly the profit or loss reported by the company does not imitate the cash flow incurred by
the company.
tabler-icon-diamond-filled.svg

Paraphrase This Document

Need a fresh take? Get an instant paraphrase of this document with our AI Paraphraser
Document Page
Statement of retained earnings: Changes in the equity faced by the company during an
accounting period is presented by this statement. It includes sales, dividend payments, changes
due to profit and loss reported however the format of the report can vary. It is not usually used in
the company and is usually included in the audited financial statements.
2.2. Comparison of different formats of financial statements and their appropriateness for
different types of business
The formats of the income stamen and balance sheet are different for different types of
businesses like sole proprietorship, public limited company, and privet limited company.
Economic sector of every company are different hence different financial statements are used by
them following the formats that comply with standards of the economic sector. Financial
information like sales purchases, assets, taxes, profit and loss during an accounting period is
recorded in the financial statements.
Financial statements presented by sole trader are simple as the report is just helping the owner of
the company. The statements just have to provide information of the profit and loss generated by
the company. On the other hand public limited companies prepare financial statements that are
complex and are prepared following the IFRS (the international financial reporting standard
GAAP (generally accepted accounting principle) and IAS (international accounting standards).
Financial Ratios Analysis
Liquidity Analysis
There was a decrease in current ratio to 0.60 in year 2015 which is lower than the standard ratio
of 2:1. This decline in the current ration of the company indicates that liquidity position of the
company is not good. The reason of this the 168% increase in the provision in 2015 (AR
Boston, 2016).
Document Page
Current ratio increased by 16% in year 2015, which shows an improvement in the liquidity
position of the company. The reason of this improvement is the decline in the amount of loan;
improvement is customers and derivative financial instruments (AR Newburry, 2016)
Profitability Ratios
In the year 2015 the company had to face loss of 9.2% this indicates that company is in bad
position. This is mainly due to the 8% increase in cost of sales and 89% increase in taxation
expense and loss in the property items (AR Boston, 2016).
Profitability of Newbury Collage increased from 0.18% to 1.52% in year 2014-2015. The main
reason of this increased profitability is decline in taxation expense and increase in operating
profit margin by 27%
Efficiency Analysis:
In the year 2015 there is a slight increase in the receivable days indicating poor efficiency in the
performance of the company. It also shows that liquidity ratio of the company is increasing (AR
Boston, 2016).
chevron_up_icon
1 out of 19
circle_padding
hide_on_mobile
zoom_out_icon
[object Object]