Business Project: Student Satisfaction Analysis at UKCBC, London
VerifiedAdded on 2020/01/28
|29
|5343
|439
Project
AI Summary
This project report focuses on analyzing student satisfaction at UKCBC, a college. It begins by outlining the methodology for collecting data, including primary and secondary sources, and details the design and implementation of a student survey using questionnaires. The report then summarizes the collected data, presenting it through measures of central tendency, dispersion, and graphical representations. The analysis includes calculations of mean, median, mode, standard deviation, quartiles, percentiles, and correlation coefficients to understand student perceptions regarding various aspects of the college, such as course fees, extracurricular activities, lecture quality, IT lab facilities, and overall satisfaction. The findings aim to provide insights into student experiences and identify areas for potential improvement within the college environment.
INTRODUCTION
Business decision making is considered very much useful for achieving success. Business
considers the opinion of some of the experts for effective decision making. Best decisions may
lead company to achieve success, profitability and prosperity in competitive world. Choosing
among different alternatives and analysing them to select best alternative is main aim of decision
maker. Business decisions must be taken considering various tools and techniques. This project
report aims at assisting students experience and satisfaction. For analysing students satisfaction,
UKCBC is using various tools like measures of central tendency, measures of dispersion etc.
UKCBC is also measuring satisfaction level of student by conducting survey methods by
preparing questionnaire. UKCBC is conducting online survey of students to analyse the level of
satisfaction in college. This project report also aims at using networking techniques, gantt charts,
critical path method etc. For effective decision making.
TASK 1
1.1 Create a plan for collecting data from the students
UKCBC is measuring students experience and level of satisfaction and for this UKCBC
is planning to collect data from the students by primary as well as secondary method.
Primary data is a raw data which is collected for the first time by the researcher to gather
information from the customers directly. Primary data can be collected through conducting
surveys, interviews, observation, questionnaires etc. UKCBC is conducting survey by designing
a questionnaire and asking respondents face to face about their experience in the college. Large
companies generally use primary methods to gather information for obtaining authentic response
from the customers. Using primary sources removes biasness as primary method gives original
research quality. It does not involve any opinion of third parties which helps the researcher in
obtaining effective response from the customers. UKCBC is conductive an online survey by
asking questions from the students across all campuses about their experience and satisfaction
level(Merigó, J.M. and Gil-Lafuente, A.M.,)
Secondary sources of data is a second hand information which is already collected by
someone else other than the user. It has already been collected and researcher uses this type of
data for reference purposes. Secondary data can be collected through past records, magazines,
Paraphrase This Document
Need a fresh take? Get an instant paraphrase of this document with our AI Paraphraser

journals, library, internet etc. UKCBC is considering secondary data as it can measure the
satisfaction level through past records, records of admissions of past few years etc. Researcher
analyses records to find out what students prefer, what are their perceptions, what they think
about college etc. Researcher must consider competitors that what different facilities competitors
are offering to their students to keep them satisfied(Bhattacharya, A., 2014)
1.2 Present the survey methodology with sampling frame
Survey Methodology:
To assess the students attitudes and perceptions towards their colleges, survey must be
done by student representative on the basis of which students experience and satisfaction can be
measured. Survey must be done to evaluate the satisfaction level as for any educational
institution satisfaction of students should be the main aim. For conducting surveys in the campus,
questionnaire is considered to be the main instrument for analysing the students perception
towards college campus. Student representative of UKCBC is conducting online survey of
students through questionnaires to analyse the attitude of customers that whether they are
satisfied or not(Fraedrich, J., Ferrell, L. and Ferrell, O.C., 2013)
Sampling:
As the students base of UKCBC is very large and huge, so sampling is conducted by the
students representative. Sampling can be defined as a statistical tool or technique to determine
the attributes of some elements based on entire population. Sampling technique is considered as
a main tool for UKCBC as it has a diverse student base and it becomes very difficult to analyse
the large number of students. So satisfaction level can only be checked by conducting sampling
technique. Therefore, this technique is used so that on the basis of some elements, attitudes and
perception of entire population can be assessed and evaluated.
Student representative of UKCBC is using random sampling as there is equal chance of
selecting a student from the large student base. Random sampling is a popular technique of
sampling as there is no biasness as each student gets an equal chance of being selected.
In this report, student representative is considering the sample of 50 students.
1.3 Questionnaire
This survey is about checking the level of satisfaction of the students and their experience. This
questionnaire aims at knowing what are the attitudes and perception of the customers towards
this college(Graham, J.R., Harvey, C.R. and Pur)
Dear Participants
(we are interested in knowing your level of satisfaction and experience, so kindly spend few
minutes to fill the questionnaire, your response will be highly appreciated)
Q.1. What is the gender of the student?
Male
Female
Q.2. What is the age group of the student?
20-25
25-30
30-35
35-40
Above 40
Q.3. What is the stream of student?
Law
Business management
Engineering
Finance
Arts
Designing
Any other field
Q.4. How much you are satisfied with the services provided by us?
Extremely satisfied
Satisfied
Neutral
Dissatisfied
Extremely dissatisfied
⊘ This is a preview!⊘
Do you want full access?
Subscribe today to unlock all pages.
Trusted by 1+ million students worldwide
Q.5. Is UKCBC offering extra curricular activities other than course curriculum?
Yes
No
Q.6. How much would you like to pay for the courses offered by UKCBC?
High prices
Affordable
Low prices
Q.7. Are the lectures easy to understand?
Yes
No
Q.8. Are those lectures helpful for the students?
Very much
Neutral
Not helpful
Q.9. Are the students satisfied with the number of IT laboratories in the campus?
Yes
No
Q.10. What do you think that you find sufficient study material in the library?
Very often
Often
Occasionally
Never
Q.11. Is there sufficient interaction between faculties and students?
Yes
No
Q.12. How much clean are the lecture rooms and toilets in the campus?
Very clean
neutral
Not clean
Yes
No
Q.6. How much would you like to pay for the courses offered by UKCBC?
High prices
Affordable
Low prices
Q.7. Are the lectures easy to understand?
Yes
No
Q.8. Are those lectures helpful for the students?
Very much
Neutral
Not helpful
Q.9. Are the students satisfied with the number of IT laboratories in the campus?
Yes
No
Q.10. What do you think that you find sufficient study material in the library?
Very often
Often
Occasionally
Never
Q.11. Is there sufficient interaction between faculties and students?
Yes
No
Q.12. How much clean are the lecture rooms and toilets in the campus?
Very clean
neutral
Not clean
Paraphrase This Document
Need a fresh take? Get an instant paraphrase of this document with our AI Paraphraser
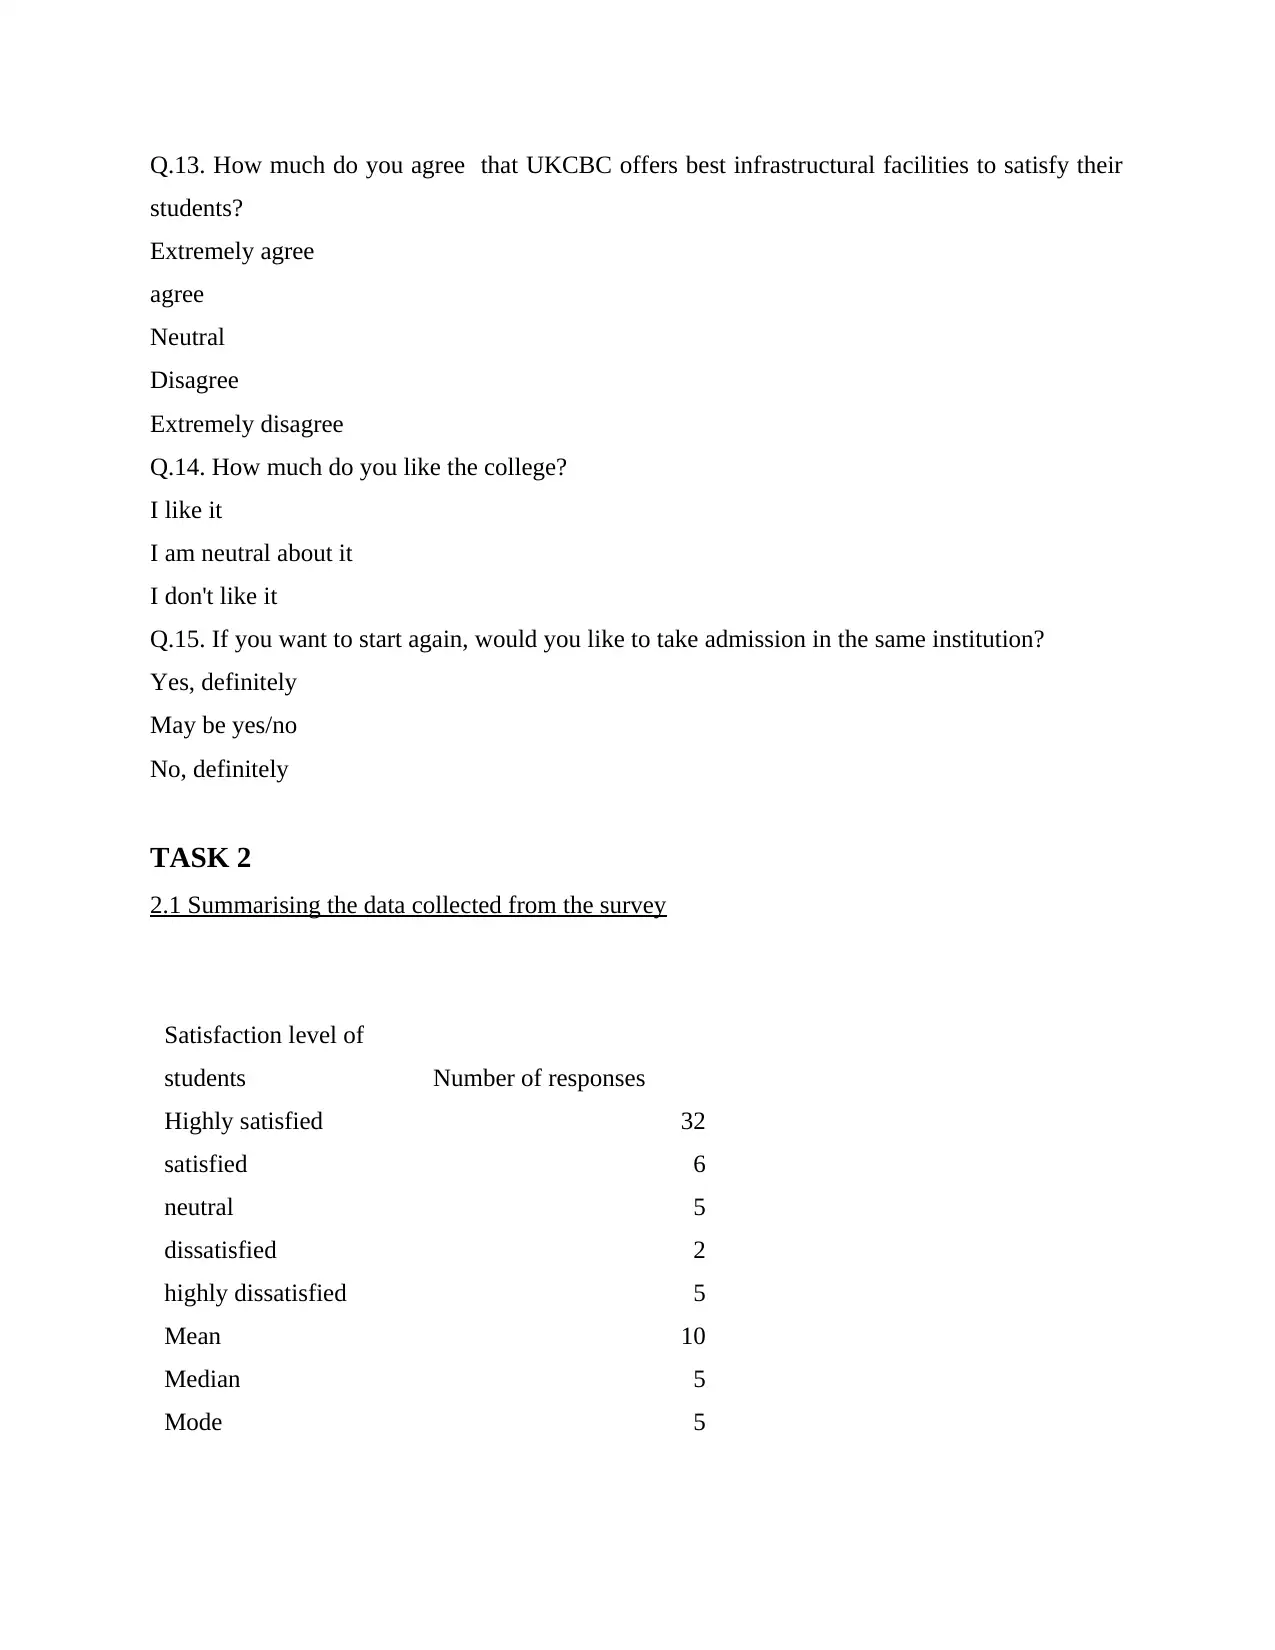
Q.13. How much do you agree that UKCBC offers best infrastructural facilities to satisfy their
students?
Extremely agree
agree
Neutral
Disagree
Extremely disagree
Q.14. How much do you like the college?
I like it
I am neutral about it
I don't like it
Q.15. If you want to start again, would you like to take admission in the same institution?
Yes, definitely
May be yes/no
No, definitely
TASK 2
2.1 Summarising the data collected from the survey
Satisfaction level of
students Number of responses
Highly satisfied 32
satisfied 6
neutral 5
dissatisfied 2
highly dissatisfied 5
Mean 10
Median 5
Mode 5
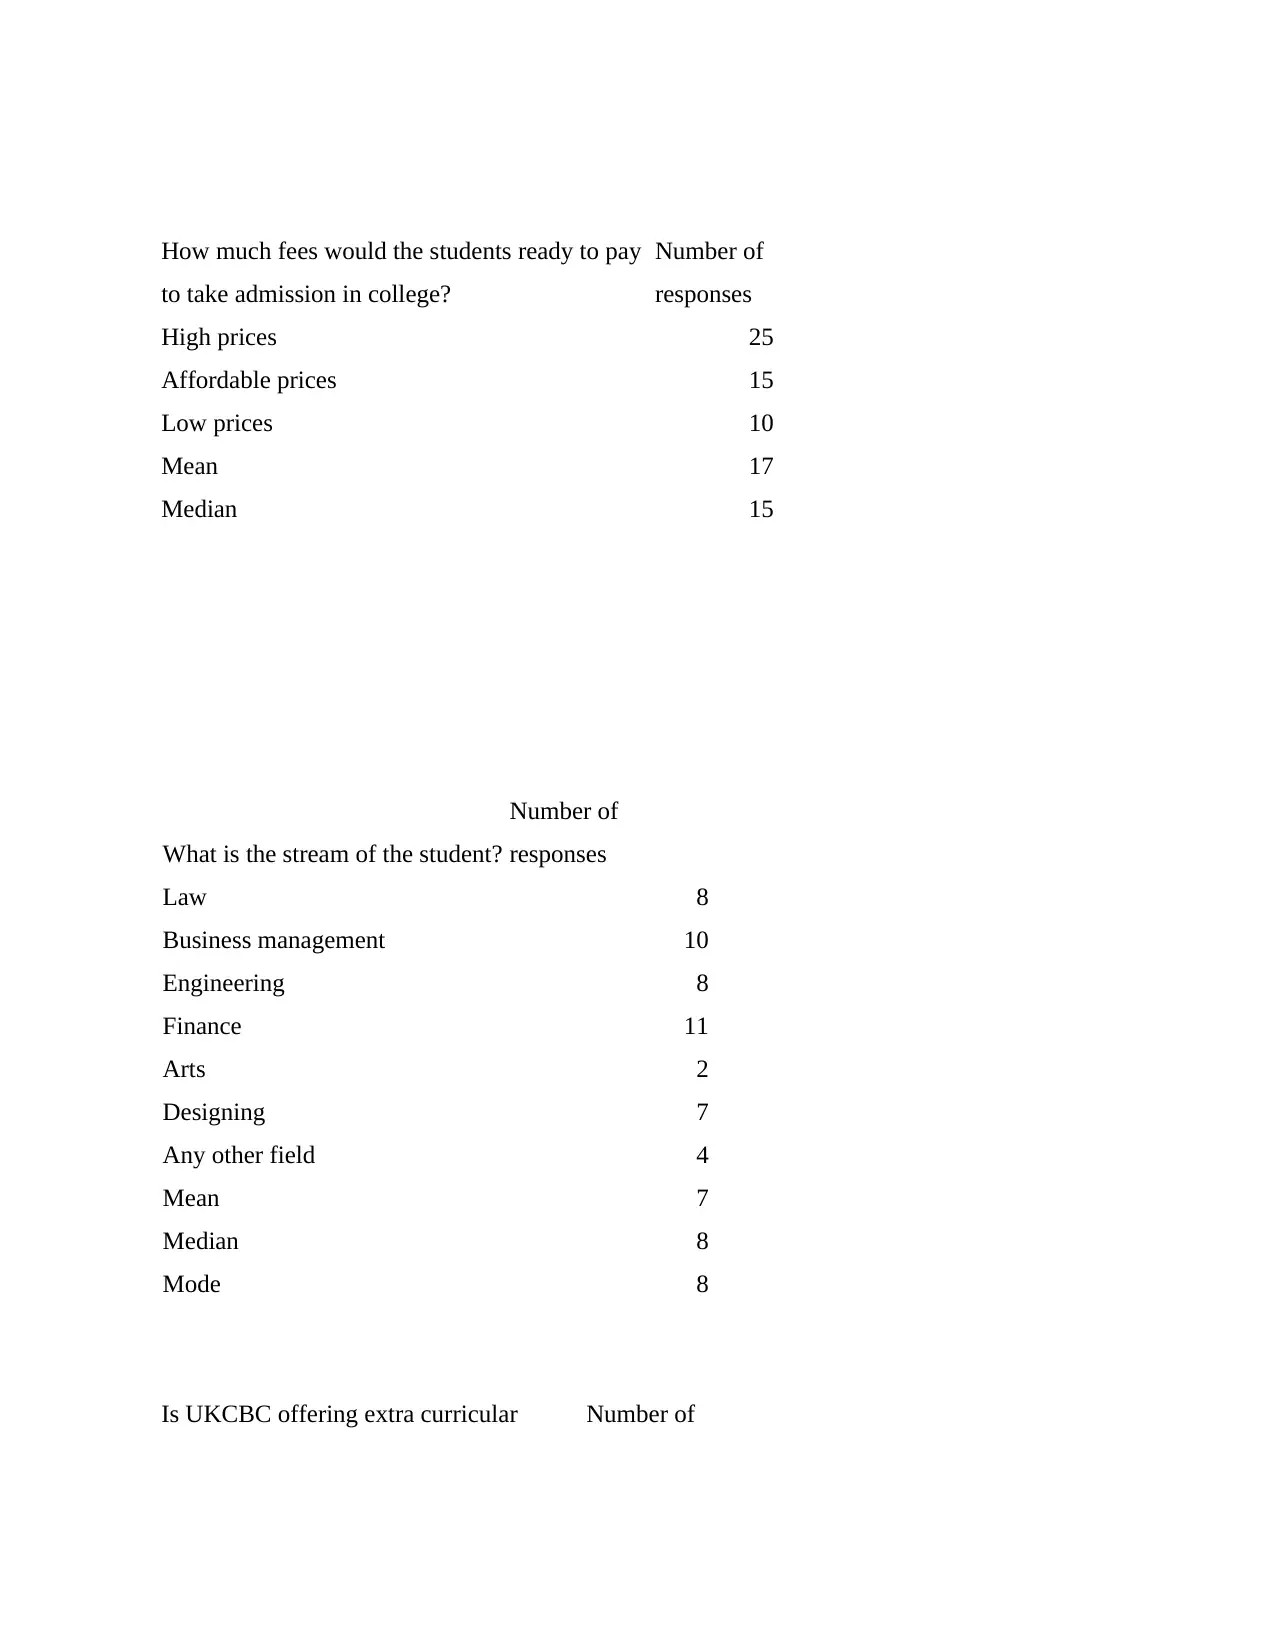
How much fees would the students ready to pay
to take admission in college?
Number of
responses
High prices 25
Affordable prices 15
Low prices 10
Mean 17
Median 15
What is the stream of the student?
Number of
responses
Law 8
Business management 10
Engineering 8
Finance 11
Arts 2
Designing 7
Any other field 4
Mean 7
Median 8
Mode 8
Is UKCBC offering extra curricular Number of
⊘ This is a preview!⊘
Do you want full access?
Subscribe today to unlock all pages.
Trusted by 1+ million students worldwide
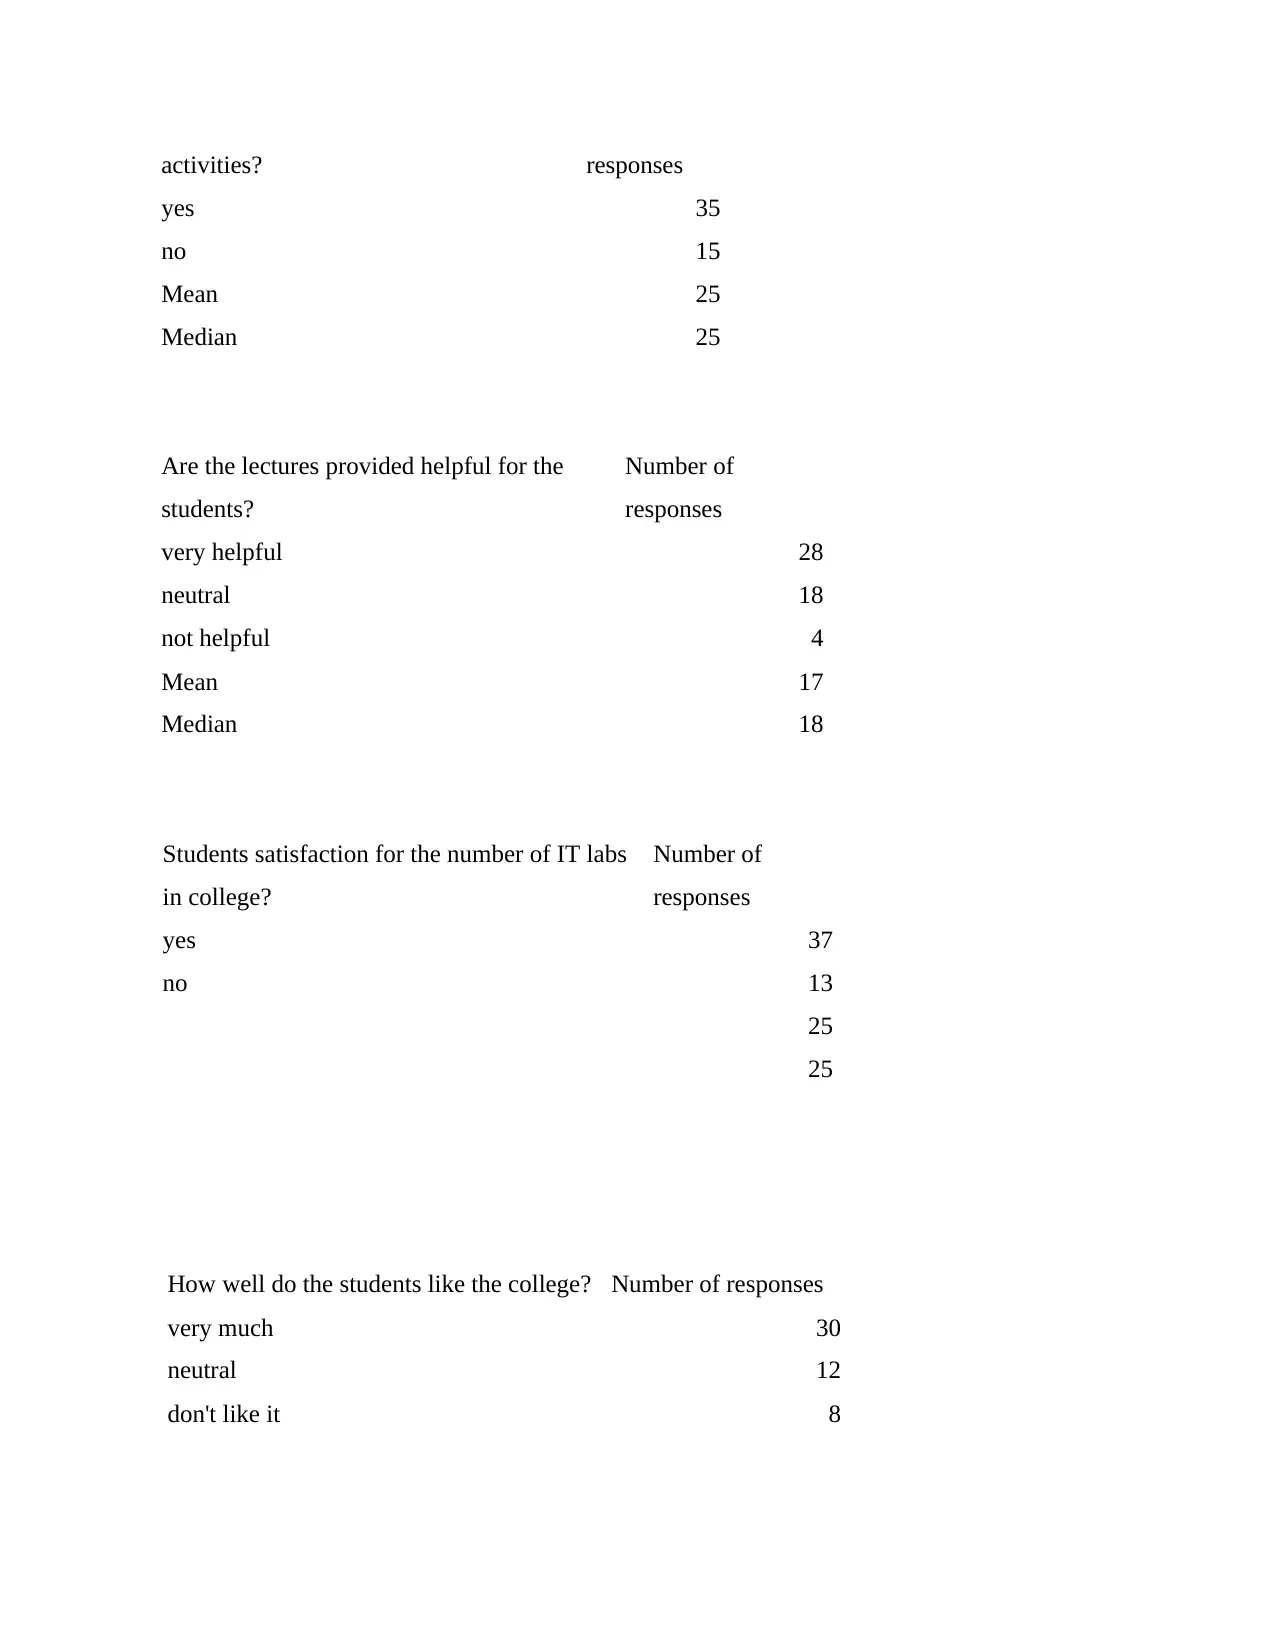
activities? responses
yes 35
no 15
Mean 25
Median 25
Are the lectures provided helpful for the
students?
Number of
responses
very helpful 28
neutral 18
not helpful 4
Mean 17
Median 18
Students satisfaction for the number of IT labs
in college?
Number of
responses
yes 37
no 13
25
25
How well do the students like the college? Number of responses
very much 30
neutral 12
don't like it 8
Paraphrase This Document
Need a fresh take? Get an instant paraphrase of this document with our AI Paraphraser
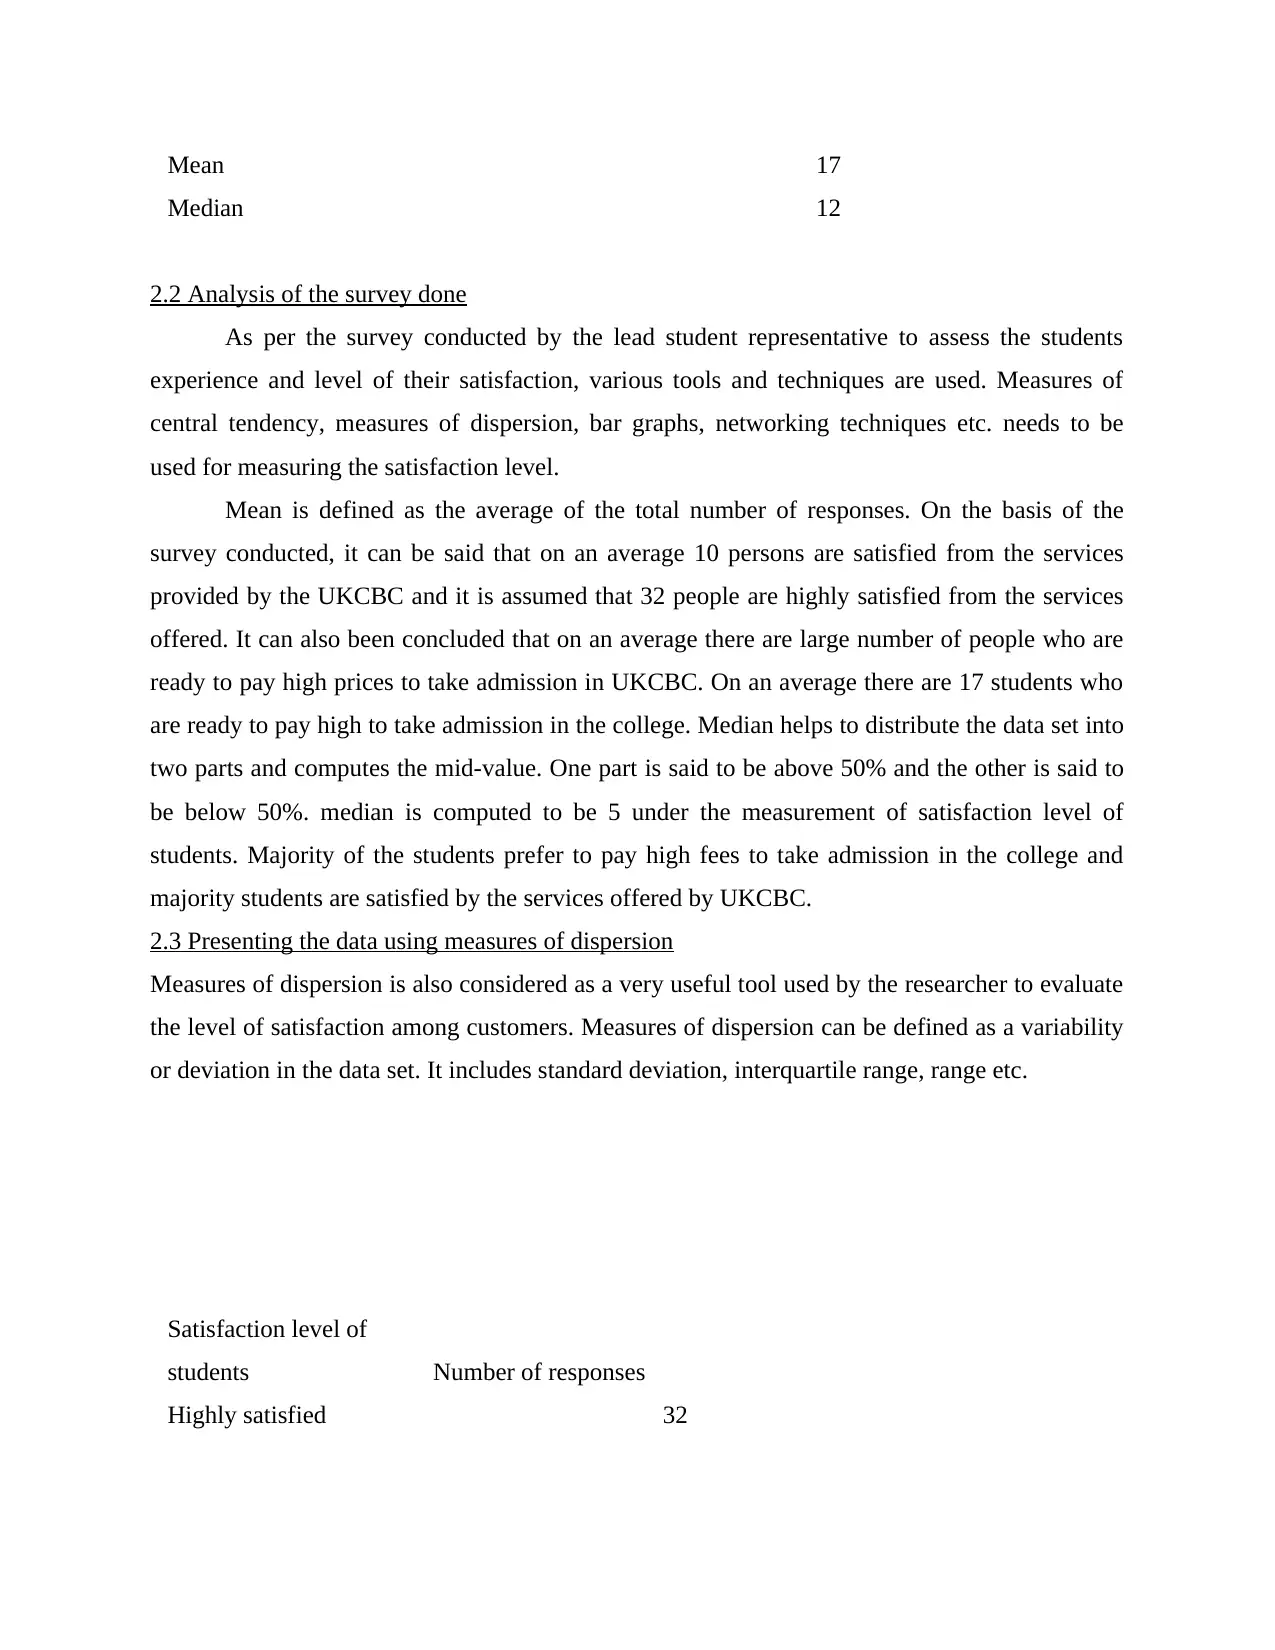
Mean 17
Median 12
2.2 Analysis of the survey done
As per the survey conducted by the lead student representative to assess the students
experience and level of their satisfaction, various tools and techniques are used. Measures of
central tendency, measures of dispersion, bar graphs, networking techniques etc. needs to be
used for measuring the satisfaction level.
Mean is defined as the average of the total number of responses. On the basis of the
survey conducted, it can be said that on an average 10 persons are satisfied from the services
provided by the UKCBC and it is assumed that 32 people are highly satisfied from the services
offered. It can also been concluded that on an average there are large number of people who are
ready to pay high prices to take admission in UKCBC. On an average there are 17 students who
are ready to pay high to take admission in the college. Median helps to distribute the data set into
two parts and computes the mid-value. One part is said to be above 50% and the other is said to
be below 50%. median is computed to be 5 under the measurement of satisfaction level of
students. Majority of the students prefer to pay high fees to take admission in the college and
majority students are satisfied by the services offered by UKCBC.
2.3 Presenting the data using measures of dispersion
Measures of dispersion is also considered as a very useful tool used by the researcher to evaluate
the level of satisfaction among customers. Measures of dispersion can be defined as a variability
or deviation in the data set. It includes standard deviation, interquartile range, range etc.
Satisfaction level of
students Number of responses
Highly satisfied 32
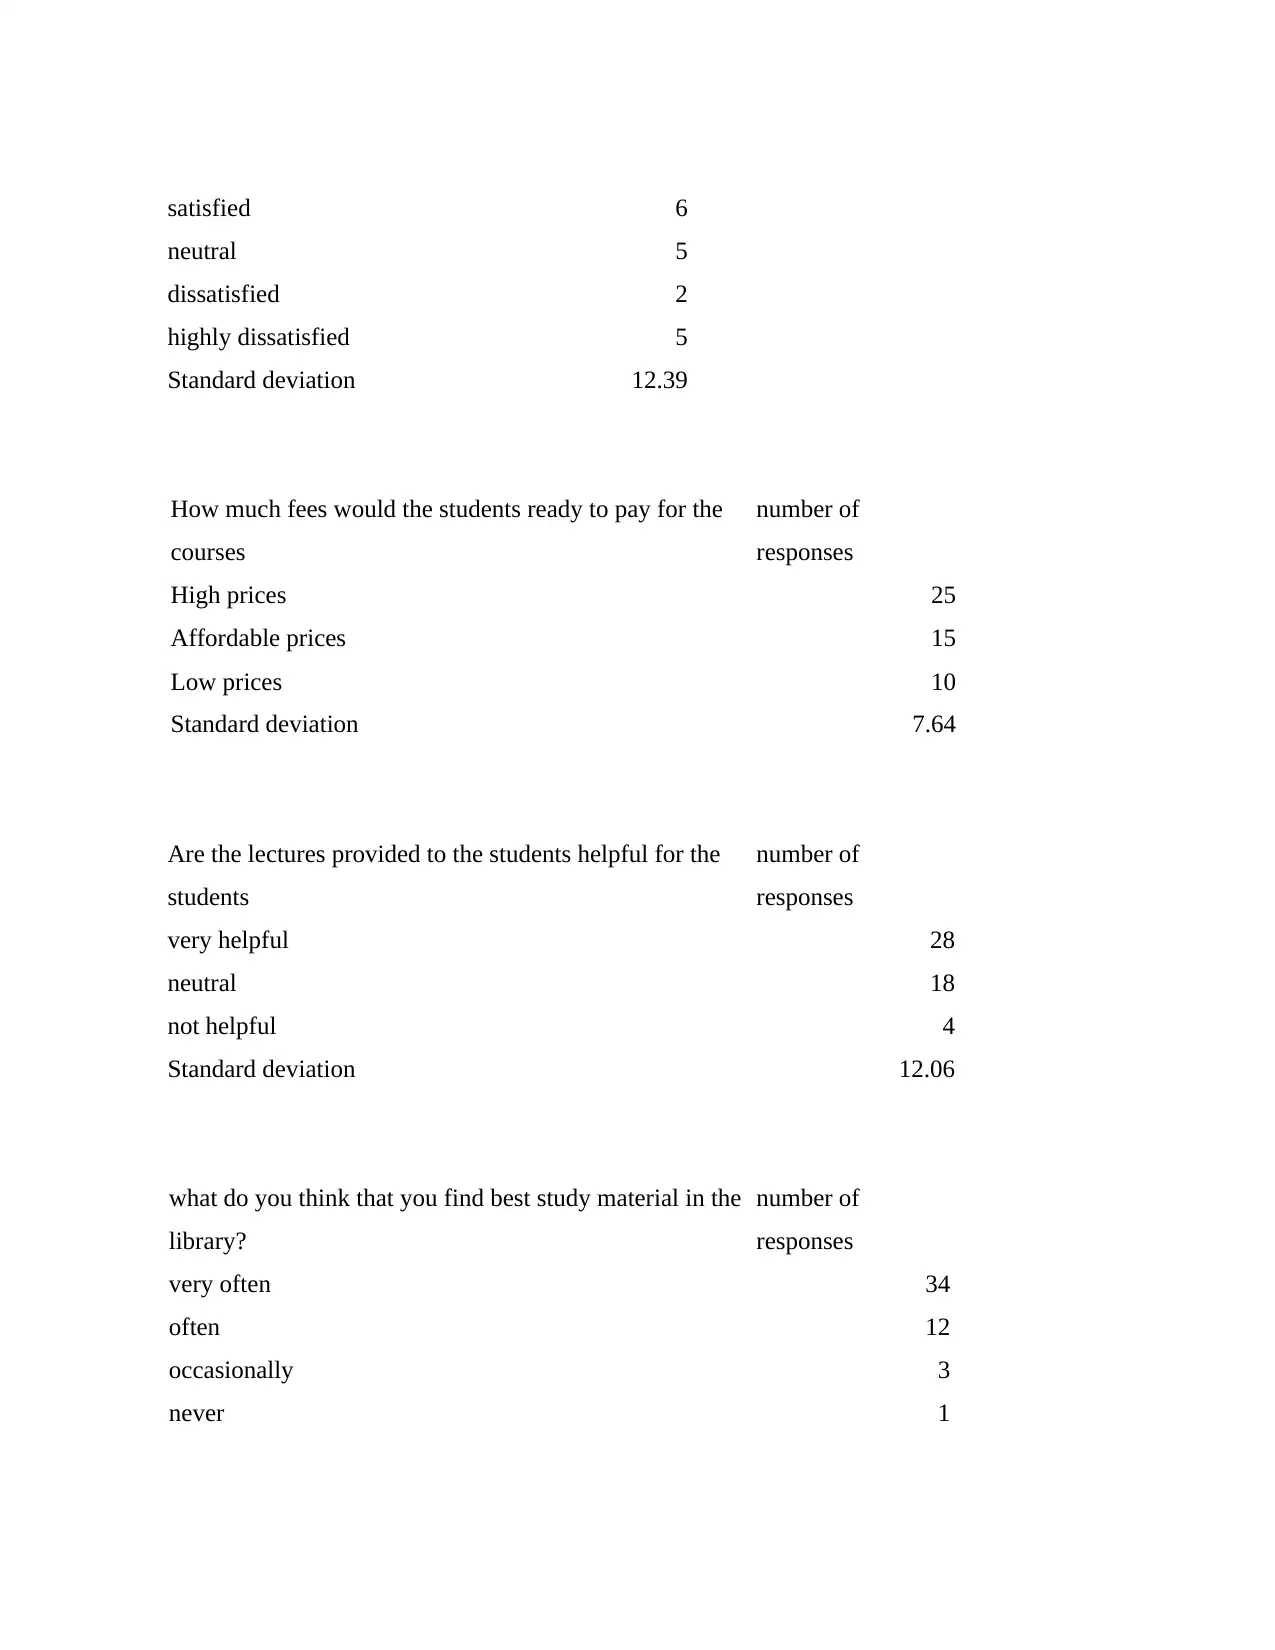
satisfied 6
neutral 5
dissatisfied 2
highly dissatisfied 5
Standard deviation 12.39
How much fees would the students ready to pay for the
courses
number of
responses
High prices 25
Affordable prices 15
Low prices 10
Standard deviation 7.64
Are the lectures provided to the students helpful for the
students
number of
responses
very helpful 28
neutral 18
not helpful 4
Standard deviation 12.06
what do you think that you find best study material in the
library?
number of
responses
very often 34
often 12
occasionally 3
never 1
⊘ This is a preview!⊘
Do you want full access?
Subscribe today to unlock all pages.
Trusted by 1+ million students worldwide
15.11
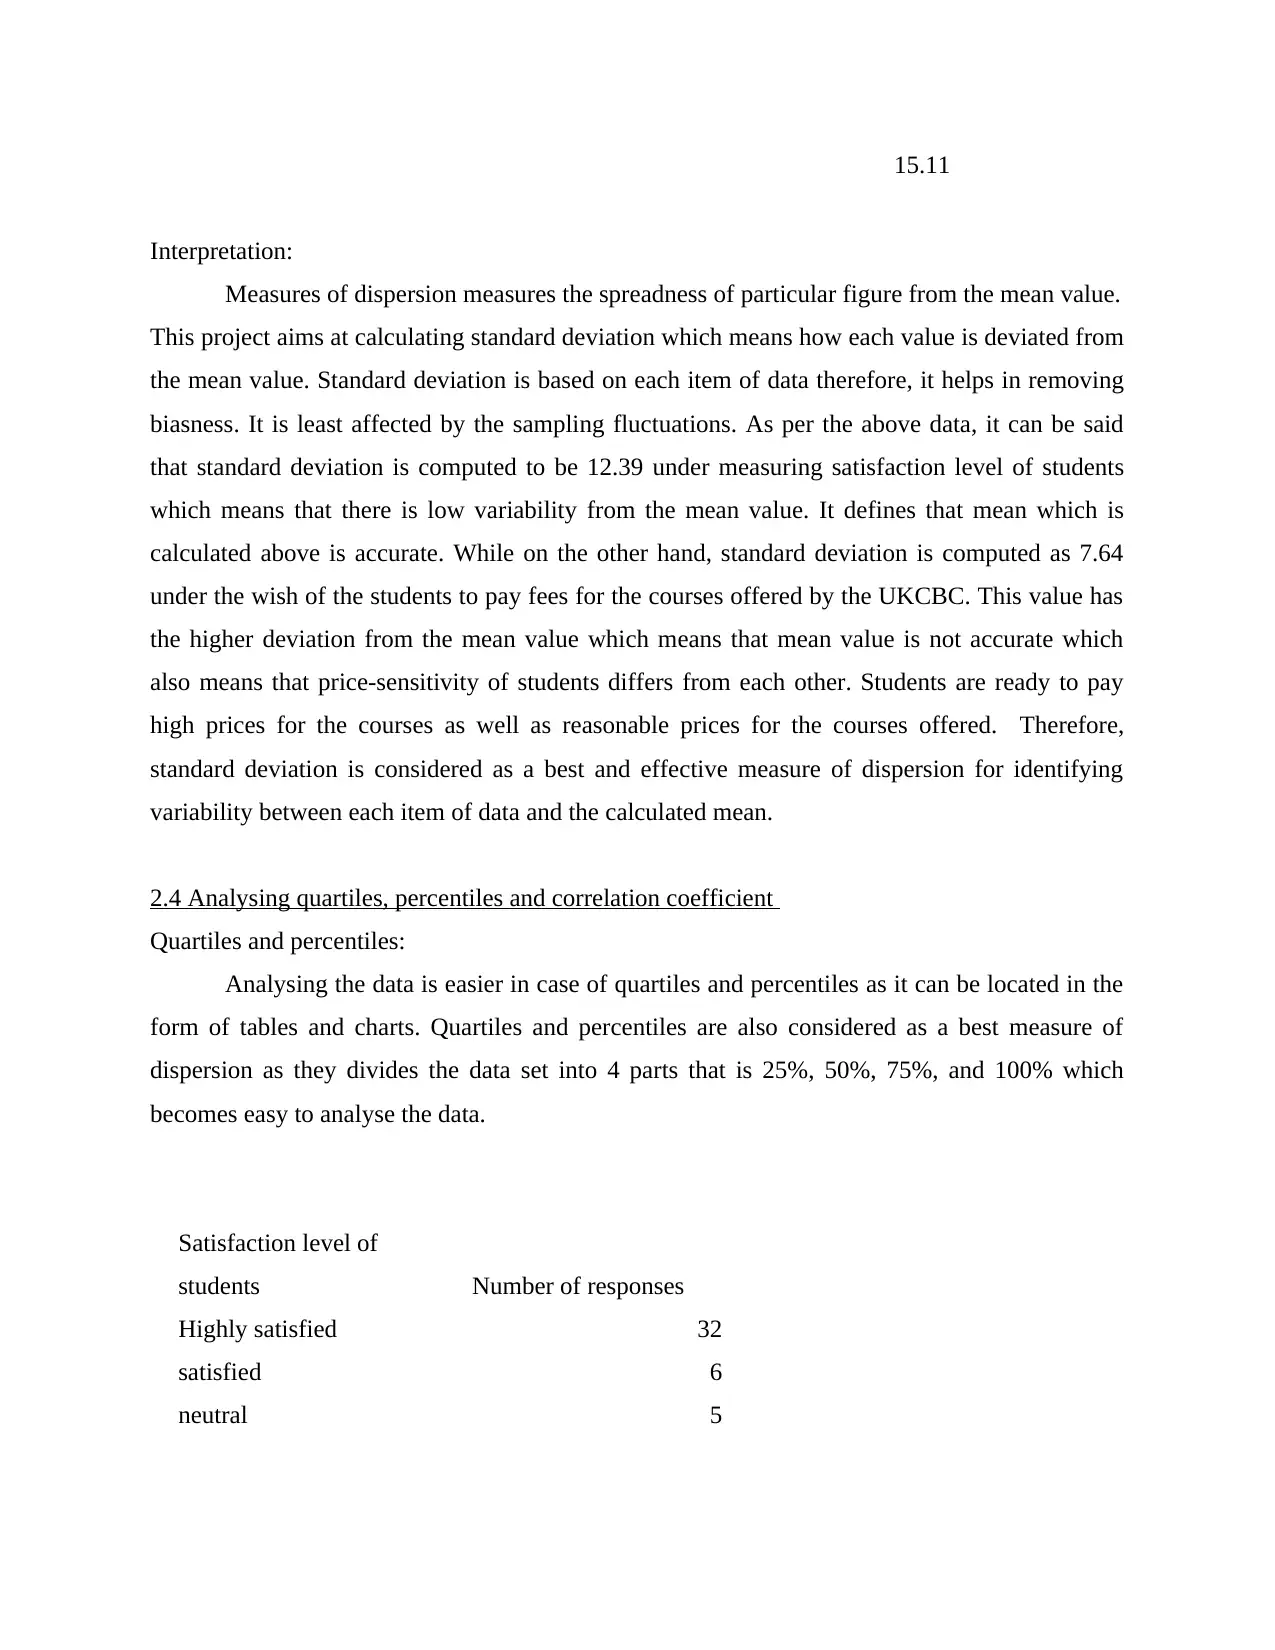
Interpretation:
Measures of dispersion measures the spreadness of particular figure from the mean value.
This project aims at calculating standard deviation which means how each value is deviated from
the mean value. Standard deviation is based on each item of data therefore, it helps in removing
biasness. It is least affected by the sampling fluctuations. As per the above data, it can be said
that standard deviation is computed to be 12.39 under measuring satisfaction level of students
which means that there is low variability from the mean value. It defines that mean which is
calculated above is accurate. While on the other hand, standard deviation is computed as 7.64
under the wish of the students to pay fees for the courses offered by the UKCBC. This value has
the higher deviation from the mean value which means that mean value is not accurate which
also means that price-sensitivity of students differs from each other. Students are ready to pay
high prices for the courses as well as reasonable prices for the courses offered. Therefore,
standard deviation is considered as a best and effective measure of dispersion for identifying
variability between each item of data and the calculated mean.
2.4 Analysing quartiles, percentiles and correlation coefficient
Quartiles and percentiles:
Analysing the data is easier in case of quartiles and percentiles as it can be located in the
form of tables and charts. Quartiles and percentiles are also considered as a best measure of
dispersion as they divides the data set into 4 parts that is 25%, 50%, 75%, and 100% which
becomes easy to analyse the data.
Satisfaction level of
students Number of responses
Highly satisfied 32
satisfied 6
neutral 5
Paraphrase This Document
Need a fresh take? Get an instant paraphrase of this document with our AI Paraphraser
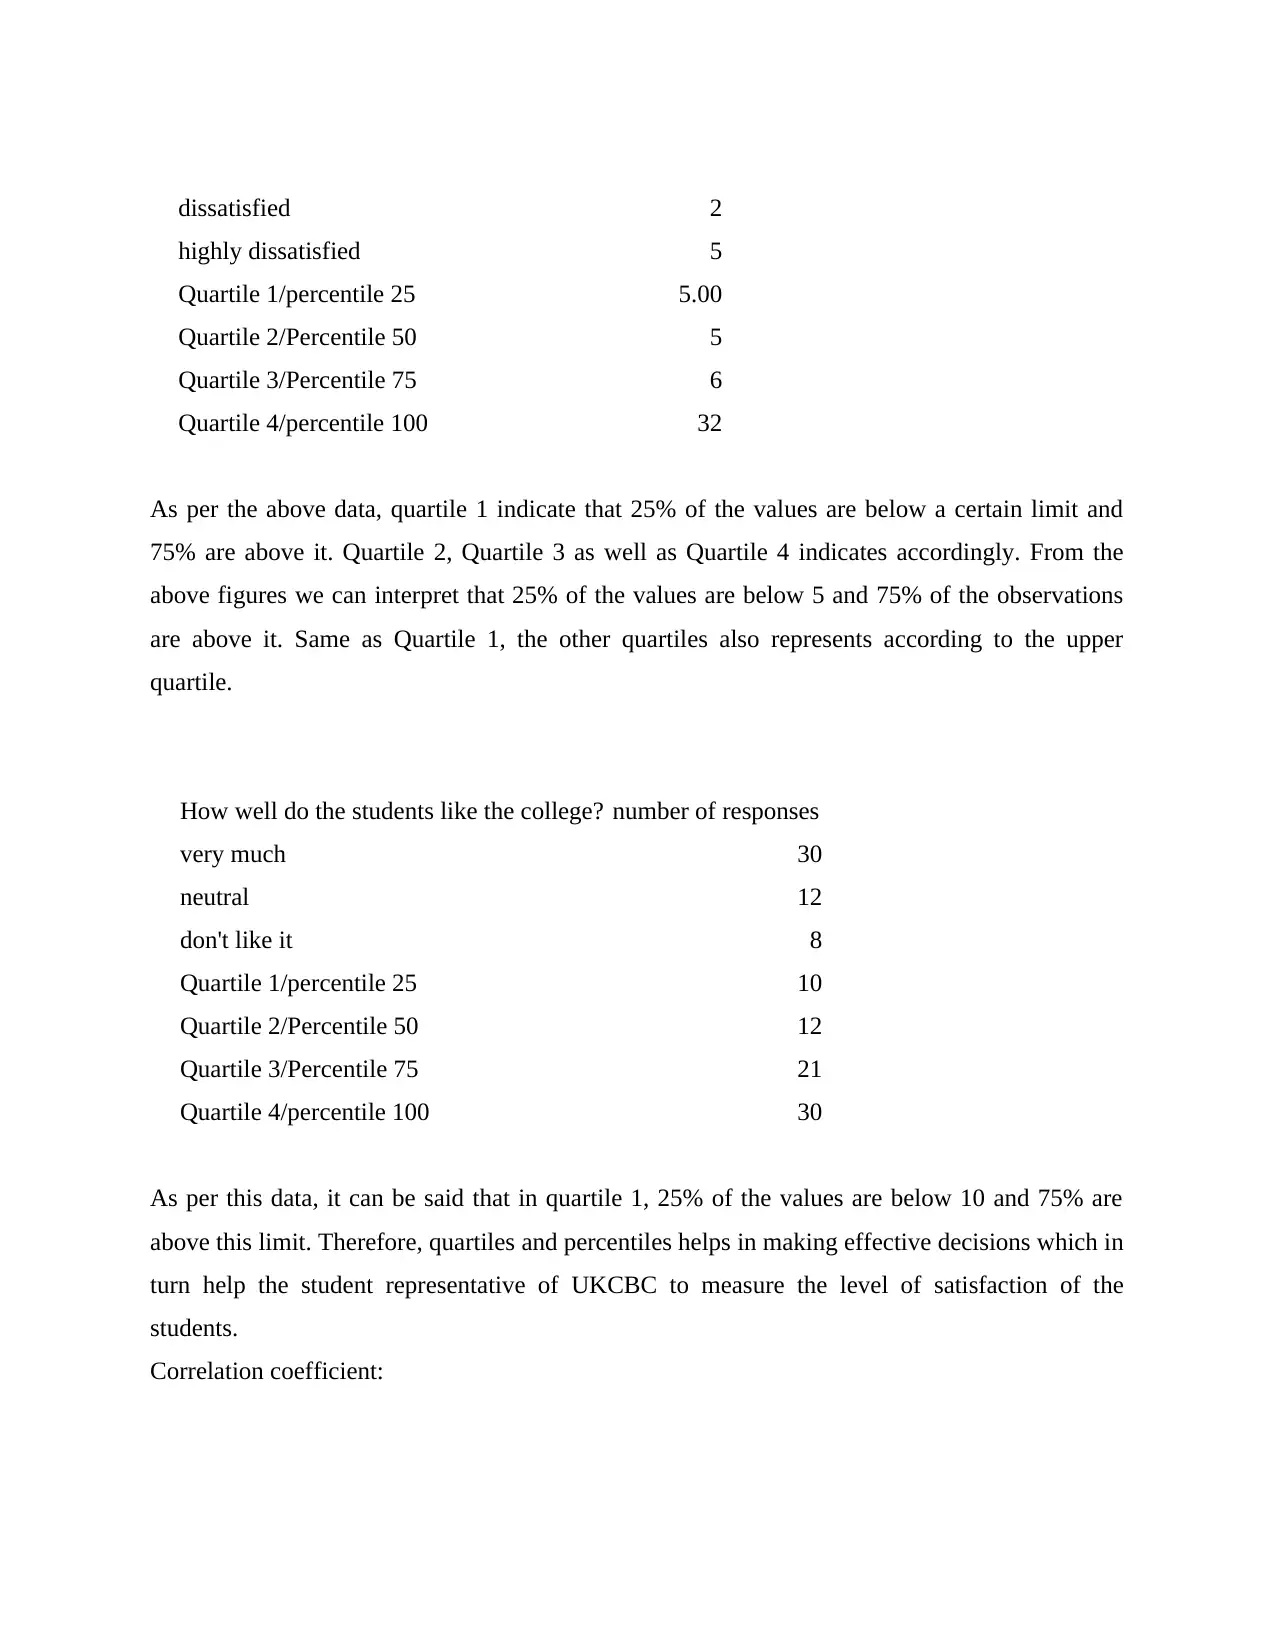
dissatisfied 2
highly dissatisfied 5
Quartile 1/percentile 25 5.00
Quartile 2/Percentile 50 5
Quartile 3/Percentile 75 6
Quartile 4/percentile 100 32
As per the above data, quartile 1 indicate that 25% of the values are below a certain limit and
75% are above it. Quartile 2, Quartile 3 as well as Quartile 4 indicates accordingly. From the
above figures we can interpret that 25% of the values are below 5 and 75% of the observations
are above it. Same as Quartile 1, the other quartiles also represents according to the upper
quartile.
How well do the students like the college? number of responses
very much 30
neutral 12
don't like it 8
Quartile 1/percentile 25 10
Quartile 2/Percentile 50 12
Quartile 3/Percentile 75 21
Quartile 4/percentile 100 30
As per this data, it can be said that in quartile 1, 25% of the values are below 10 and 75% are
above this limit. Therefore, quartiles and percentiles helps in making effective decisions which in
turn help the student representative of UKCBC to measure the level of satisfaction of the
students.
Correlation coefficient:
Correlation coefficient is also a best tool for decision-making. It measures the
relationship between two independent variables. It is represented by 'r'. Correlation coefficient
always lies between +1 and -1, if its value is closer to be +1 then it has a strong positive
relationship and if its value is closer to -1 then it has a strong negative relationship.
TASK 3
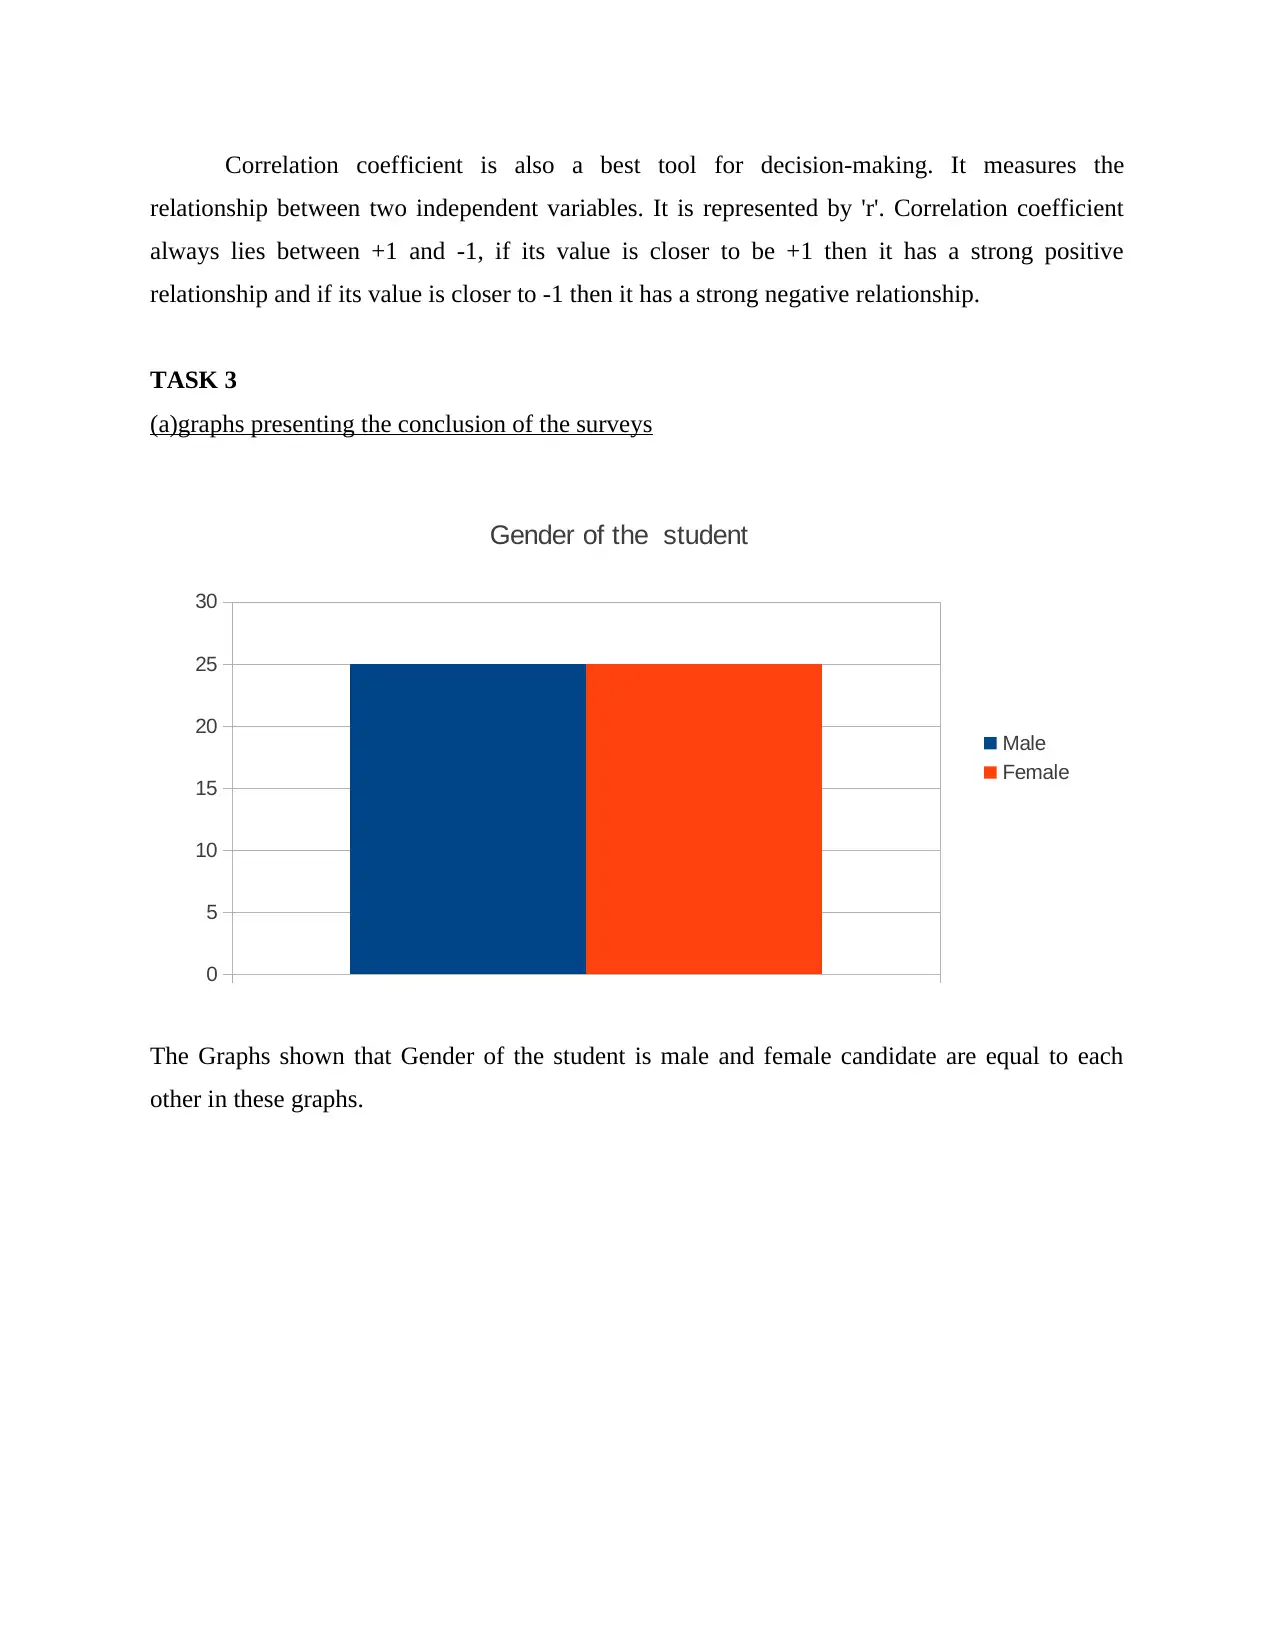
(a)graphs presenting the conclusion of the surveys
0
5
10
15
20
25
30
Gender of the student
Male
Female
The Graphs shown that Gender of the student is male and female candidate are equal to each
other in these graphs.
relationship between two independent variables. It is represented by 'r'. Correlation coefficient
always lies between +1 and -1, if its value is closer to be +1 then it has a strong positive
relationship and if its value is closer to -1 then it has a strong negative relationship.
TASK 3
(a)graphs presenting the conclusion of the surveys
0
5
10
15
20
25
30
Gender of the student
Male
Female
The Graphs shown that Gender of the student is male and female candidate are equal to each
other in these graphs.
⊘ This is a preview!⊘
Do you want full access?
Subscribe today to unlock all pages.
Trusted by 1+ million students worldwide
1 out of 29
Related Documents


Your All-in-One AI-Powered Toolkit for Academic Success.
+13062052269
info@desklib.com
Available 24*7 on WhatsApp / Email
![[object Object]](/_next/static/media/star-bottom.7253800d.svg)
Unlock your academic potential
Copyright © 2020–2026 A2Z Services. All Rights Reserved. Developed and managed by ZUCOL.