Analysis of UKCBC Student Survey Data for Business Decisions
VerifiedAdded on 2020/02/17
|21
|4859
|74
Report
AI Summary
This report presents an analysis of a student survey conducted at UKCBC to assess student experiences and satisfaction levels. The report outlines the data collection plan, survey methodology, and questionnaire design used to gather information from students across multiple campuses. It includes a detailed analysis of the collected data, employing representative values, measures of dispersion, and statistical tools such as mean, median, mode, quartiles, percentiles, and correlation coefficients. The findings are presented graphically, with trend lines and a formal report summarizing the key insights. Furthermore, the report discusses information processing tools, project plans, and investment decisions based on the survey results, culminating in a comprehensive conclusion and references.
BUSINESS DECISION
MAKING
MAKING
Paraphrase This Document
Need a fresh take? Get an instant paraphrase of this document with our AI Paraphraser
TABLE OF CONTENTS
INTRODUCTION...........................................................................................................................3
TASK 1............................................................................................................................................3
a) Create a plan for collecting data from students across all campuses.......................................3
b) Present the survey methodology and sampling frame used.....................................................4
c) Design questionnaire for collecting the data............................................................................4
TASK 2............................................................................................................................................6
a) Summarize the data collected from the survey by using representative values.......................6
b) Analyze the results of the survey and draw conclusion...........................................................8
c) Analyze the data using measures of dispersion.......................................................................8
d) Calculation of quartiles, percentiles and the correlation coefficient.......................................9
Task 3.............................................................................................................................................10
a) Graphical presentation...........................................................................................................10
b) Trend line...............................................................................................................................15
C) Presentation...........................................................................................................................16
d) Formal report.........................................................................................................................16
Task 4.............................................................................................................................................17
a) Information processing tools.................................................................................................17
b) Project plan and critical path.................................................................................................17
c) Investment decisions..............................................................................................................18
CONCLUSION..............................................................................................................................19
References......................................................................................................................................21
INTRODUCTION
Analytic are most important that are used by most of the firms, industry, organisation and
other agencies for the purpose of enhancing the business performance. In the present assignment
there is a discussion on the UKCBC In which there is a survey is done under which the
researcher has been investigating to understand the students experienced and satisfaction level.
For this UKCBC adopts the 20 sampling method for which they prepare questionnaire that are
distributed among the college students. Furthermore, there are various statistical tools are used
mean, mode, median, correlation, percentile and quartile is adopted.
TASK 1
a) Create a plan for collecting data from students across all campuses
The researcher require to conducting investigation to analyze the situation of research
subject. Thus, to carry out the research in most effective manner there are two collection data
primary and secondary sources. It is one the best tool to gathered a data and these two method
are different from each other. Therefore, the secondary data are required by the investigator at
that time when they have to carry out research quicker than they gathered from various sources.
Thus, these source are already used by some other person which has been collected from various
sources such as journals, books, newspaper, magazines and other reports etc. The most
significance of obtaining data is that it consist all relevant information that are based upon the
historical data (Siemens and Long, 2011). Further, to carry out the research properly the
secondary sources are one of the best method that results are based upon the past year data. It
gives an overview of past conditions of a company and provides direction that are required to
carrying out the research. Beside this, there is a one more data collection method that is primary
sources which is also significant to carry out investigation in most desired way. Thus, it
facilitates present and past situation of a company that are not remains same as consistently
changing. Henceforth, past information is not sufficient to carry out investigation for a future as
it is only useful to understand the past situation of a firm. Apart from primary source data
collection there is also an equally important of secondary data. In the present case scenario the
data are obtained from 20 respondents which are of students of UKCBC to know their
experience and also satisfaction level.
⊘ This is a preview!⊘
Do you want full access?
Subscribe today to unlock all pages.
Trusted by 1+ million students worldwide
b) Present the survey methodology and sampling frame used
The survey methodology is a technique that are associated with the survey data collection
that are mainly involves a questionnaire construction, it is a process of ask more than question
that can be say yes or not or even not answer by respondents. The survey includes all important
data regards to public information and research fields such as health professionals, psychology,
sociology and marketing research.
There are various sampling methods for conducting research adopted by UKCBC that are
mentioned as follows:- Simple random sampling: It is that that type of sampling which is used commonly to
conduct research which is relating to government projects. Most of the higher level of
authorities carry out survey time to time that is considered to general public. Under this,
for the sample used in simple random sampling population is to be taken which is used on
random basis. It can be said in other words that the sample units are taken under this
methods that is based upon random basis from sample of population of the particular
geographic area. Stratified random sampling: It is the unique sampling units that are taken from the
population for this investigator set out some parameters. It is based upon same population
for the investigator as the main purpose of research study is that to understand the
experience and Satisfaction level of UKCBC 's students. Therefore, it is most vital to
selecting a several types of population that are different from each other that are
considered of education and income level etc (Zikopoulos and Eaton, 2011). Thus, to
gather information on various different parameters to understand the experience of
UKCBC students.
Cluster sampling: It is that type of sampling method which is similar to stratified random
sampling method. Under this method, a particular specific area is taken for the purpose of
divide them into a smaller parts. It is the most useful method for the investigator and the
sample units are to be select from the various geographical area.
c) Design questionnaire for collecting the data
Questionnaire
Students experience and satisfaction information of UKCBC
Paraphrase This Document
Need a fresh take? Get an instant paraphrase of this document with our AI Paraphraser
Name.....
Age.......
Gender...
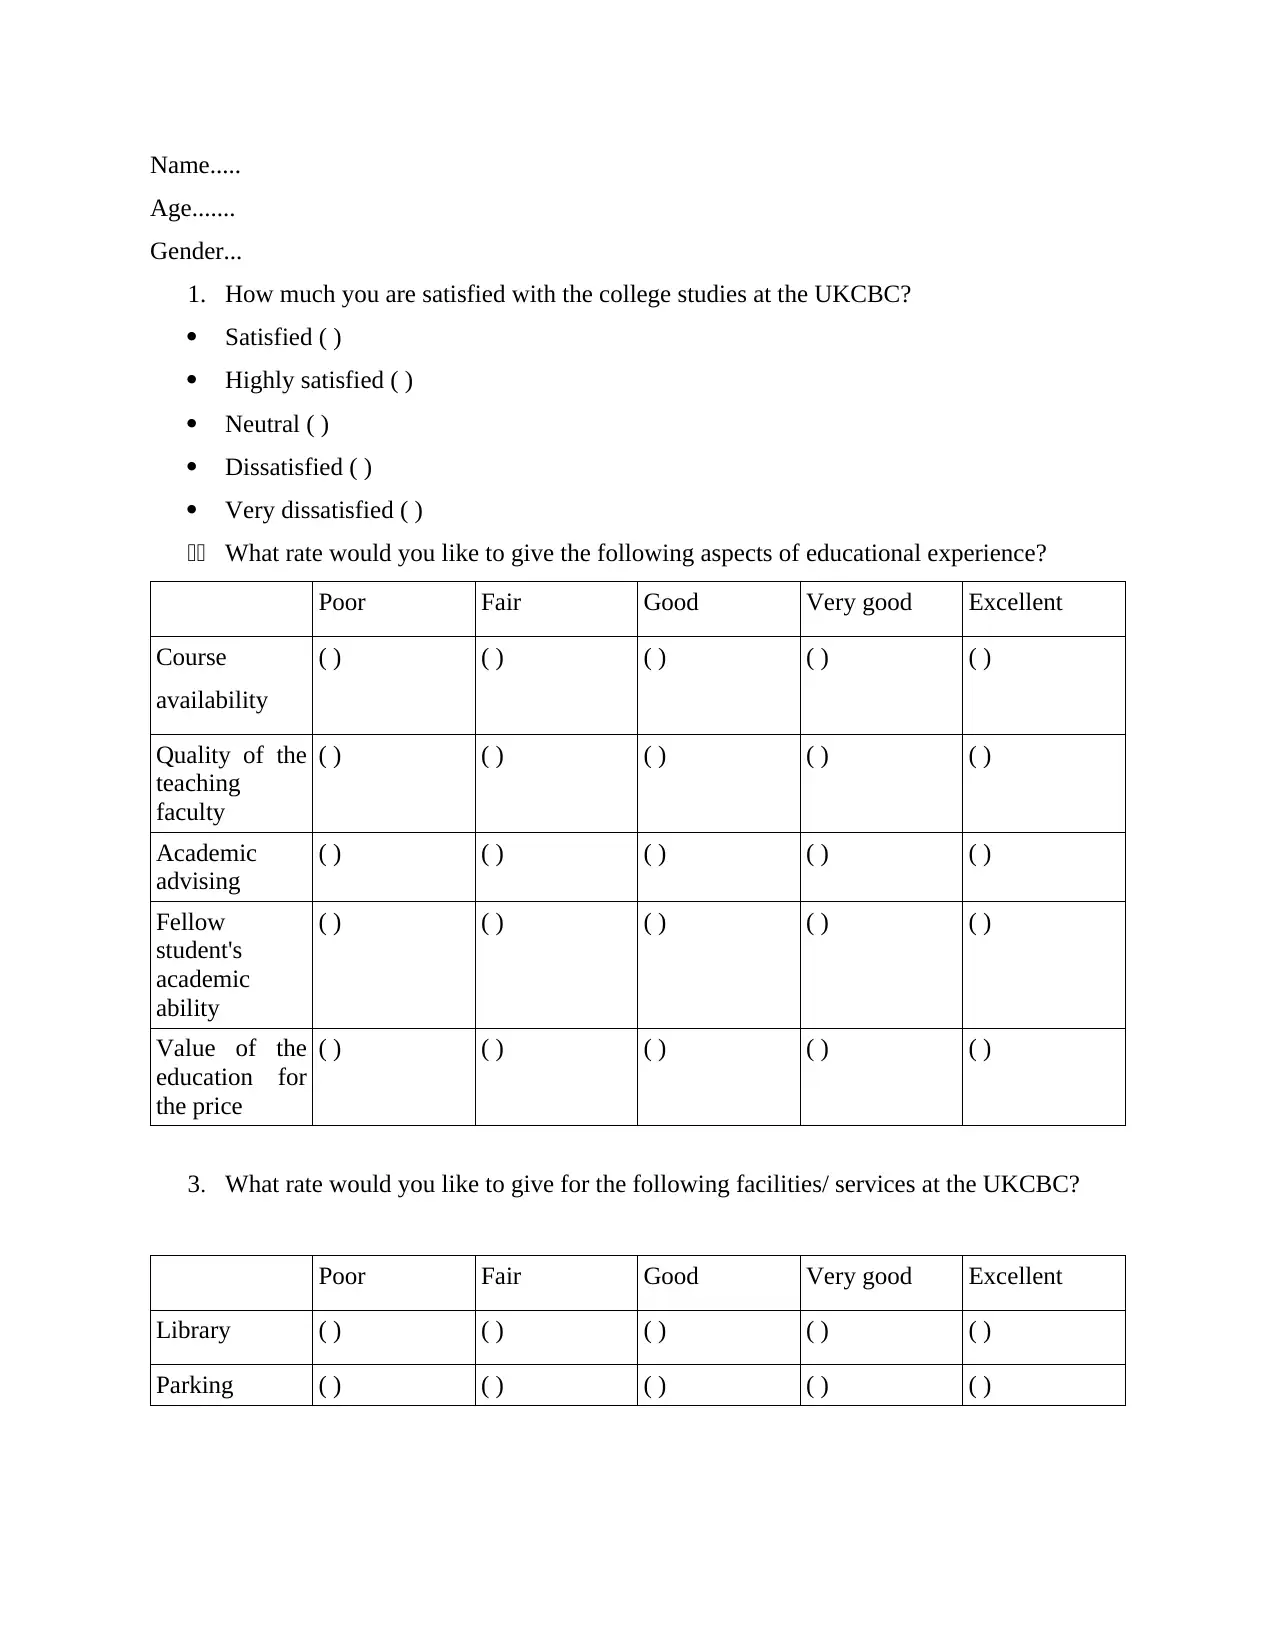
1. How much you are satisfied with the college studies at the UKCBC?
Satisfied ( )
Highly satisfied ( )
Neutral ( )
Dissatisfied ( )
Very dissatisfied ( )
22 What rate would you like to give the following aspects of educational experience?
Poor Fair Good Very good Excellent
Course
availability
( ) ( ) ( ) ( ) ( )
Quality of the
teaching
faculty
( ) ( ) ( ) ( ) ( )
Academic
advising
( ) ( ) ( ) ( ) ( )
Fellow
student's
academic
ability
( ) ( ) ( ) ( ) ( )
Value of the
education for
the price
( ) ( ) ( ) ( ) ( )
3. What rate would you like to give for the following facilities/ services at the UKCBC?
Poor Fair Good Very good Excellent
Library ( ) ( ) ( ) ( ) ( )
Parking ( ) ( ) ( ) ( ) ( )
Age.......
Gender...
1. How much you are satisfied with the college studies at the UKCBC?
Satisfied ( )
Highly satisfied ( )
Neutral ( )
Dissatisfied ( )
Very dissatisfied ( )
22 What rate would you like to give the following aspects of educational experience?
Poor Fair Good Very good Excellent
Course
availability
( ) ( ) ( ) ( ) ( )
Quality of the
teaching
faculty
( ) ( ) ( ) ( ) ( )
Academic
advising
( ) ( ) ( ) ( ) ( )
Fellow
student's
academic
ability
( ) ( ) ( ) ( ) ( )
Value of the
education for
the price
( ) ( ) ( ) ( ) ( )
3. What rate would you like to give for the following facilities/ services at the UKCBC?
Poor Fair Good Very good Excellent
Library ( ) ( ) ( ) ( ) ( )
Parking ( ) ( ) ( ) ( ) ( )
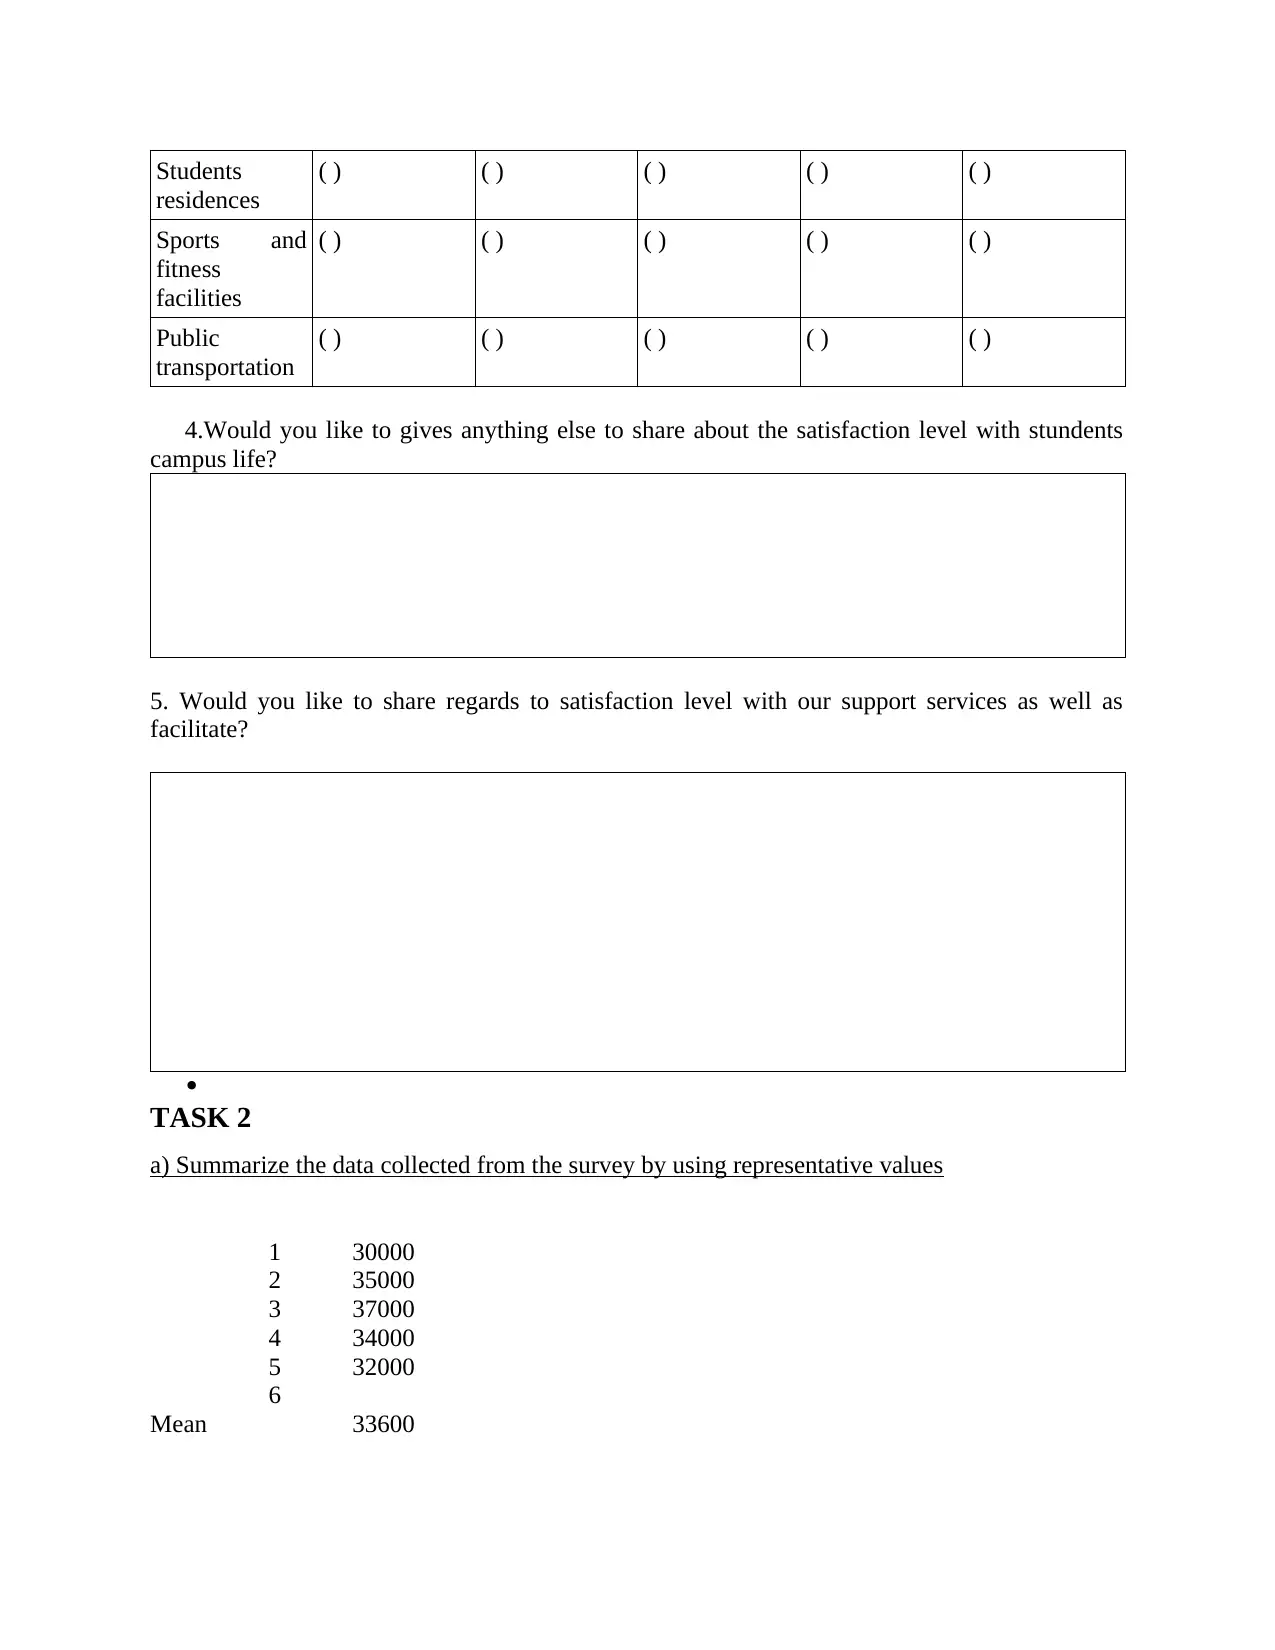
Students
residences
( ) ( ) ( ) ( ) ( )
Sports and
fitness
facilities
( ) ( ) ( ) ( ) ( )
Public
transportation
( ) ( ) ( ) ( ) ( )
4.Would you like to gives anything else to share about the satisfaction level with stundents
campus life?
5. Would you like to share regards to satisfaction level with our support services as well as
facilitate?
TASK 2
a) Summarize the data collected from the survey by using representative values
1 30000
2 35000
3 37000
4 34000
5 32000
6
Mean 33600
⊘ This is a preview!⊘
Do you want full access?
Subscribe today to unlock all pages.
Trusted by 1+ million students worldwide
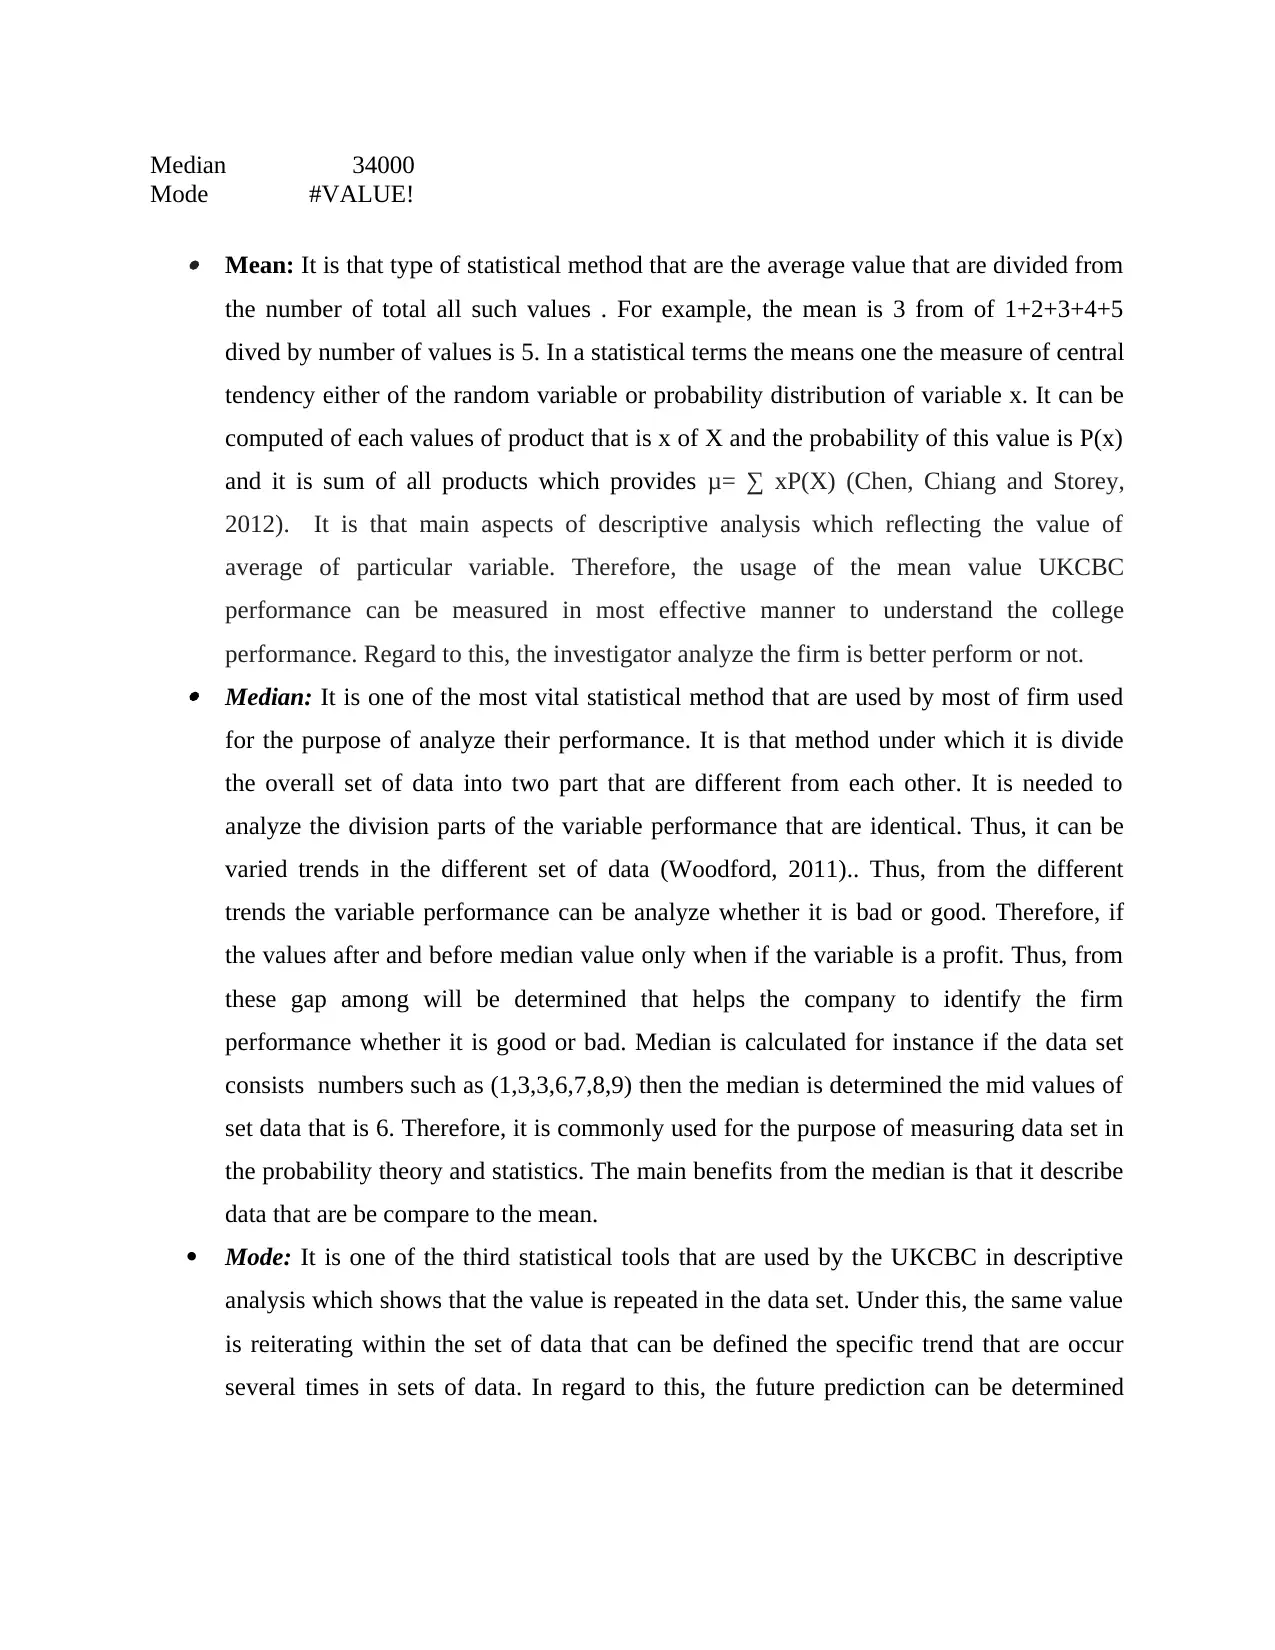
Median 34000
Mode #VALUE!
Mean: It is that type of statistical method that are the average value that are divided from
the number of total all such values . For example, the mean is 3 from of 1+2+3+4+5
dived by number of values is 5. In a statistical terms the means one the measure of central
tendency either of the random variable or probability distribution of variable x. It can be
computed of each values of product that is x of X and the probability of this value is P(x)
and it is sum of all products which provides μ= ∑ xP(X) (Chen, Chiang and Storey,
2012). It is that main aspects of descriptive analysis which reflecting the value of
average of particular variable. Therefore, the usage of the mean value UKCBC
performance can be measured in most effective manner to understand the college
performance. Regard to this, the investigator analyze the firm is better perform or not. Median: It is one of the most vital statistical method that are used by most of firm used
for the purpose of analyze their performance. It is that method under which it is divide
the overall set of data into two part that are different from each other. It is needed to
analyze the division parts of the variable performance that are identical. Thus, it can be
varied trends in the different set of data (Woodford, 2011).. Thus, from the different
trends the variable performance can be analyze whether it is bad or good. Therefore, if
the values after and before median value only when if the variable is a profit. Thus, from
these gap among will be determined that helps the company to identify the firm
performance whether it is good or bad. Median is calculated for instance if the data set
consists numbers such as (1,3,3,6,7,8,9) then the median is determined the mid values of
set data that is 6. Therefore, it is commonly used for the purpose of measuring data set in
the probability theory and statistics. The main benefits from the median is that it describe
data that are be compare to the mean.
Mode: It is one of the third statistical tools that are used by the UKCBC in descriptive
analysis which shows that the value is repeated in the data set. Under this, the same value
is reiterating within the set of data that can be defined the specific trend that are occur
several times in sets of data. In regard to this, the future prediction can be determined
Paraphrase This Document
Need a fresh take? Get an instant paraphrase of this document with our AI Paraphraser
through analysis the business performance. Therefore, it can said that mode is one of the
significant tool for the purpose of analysis the business performance.
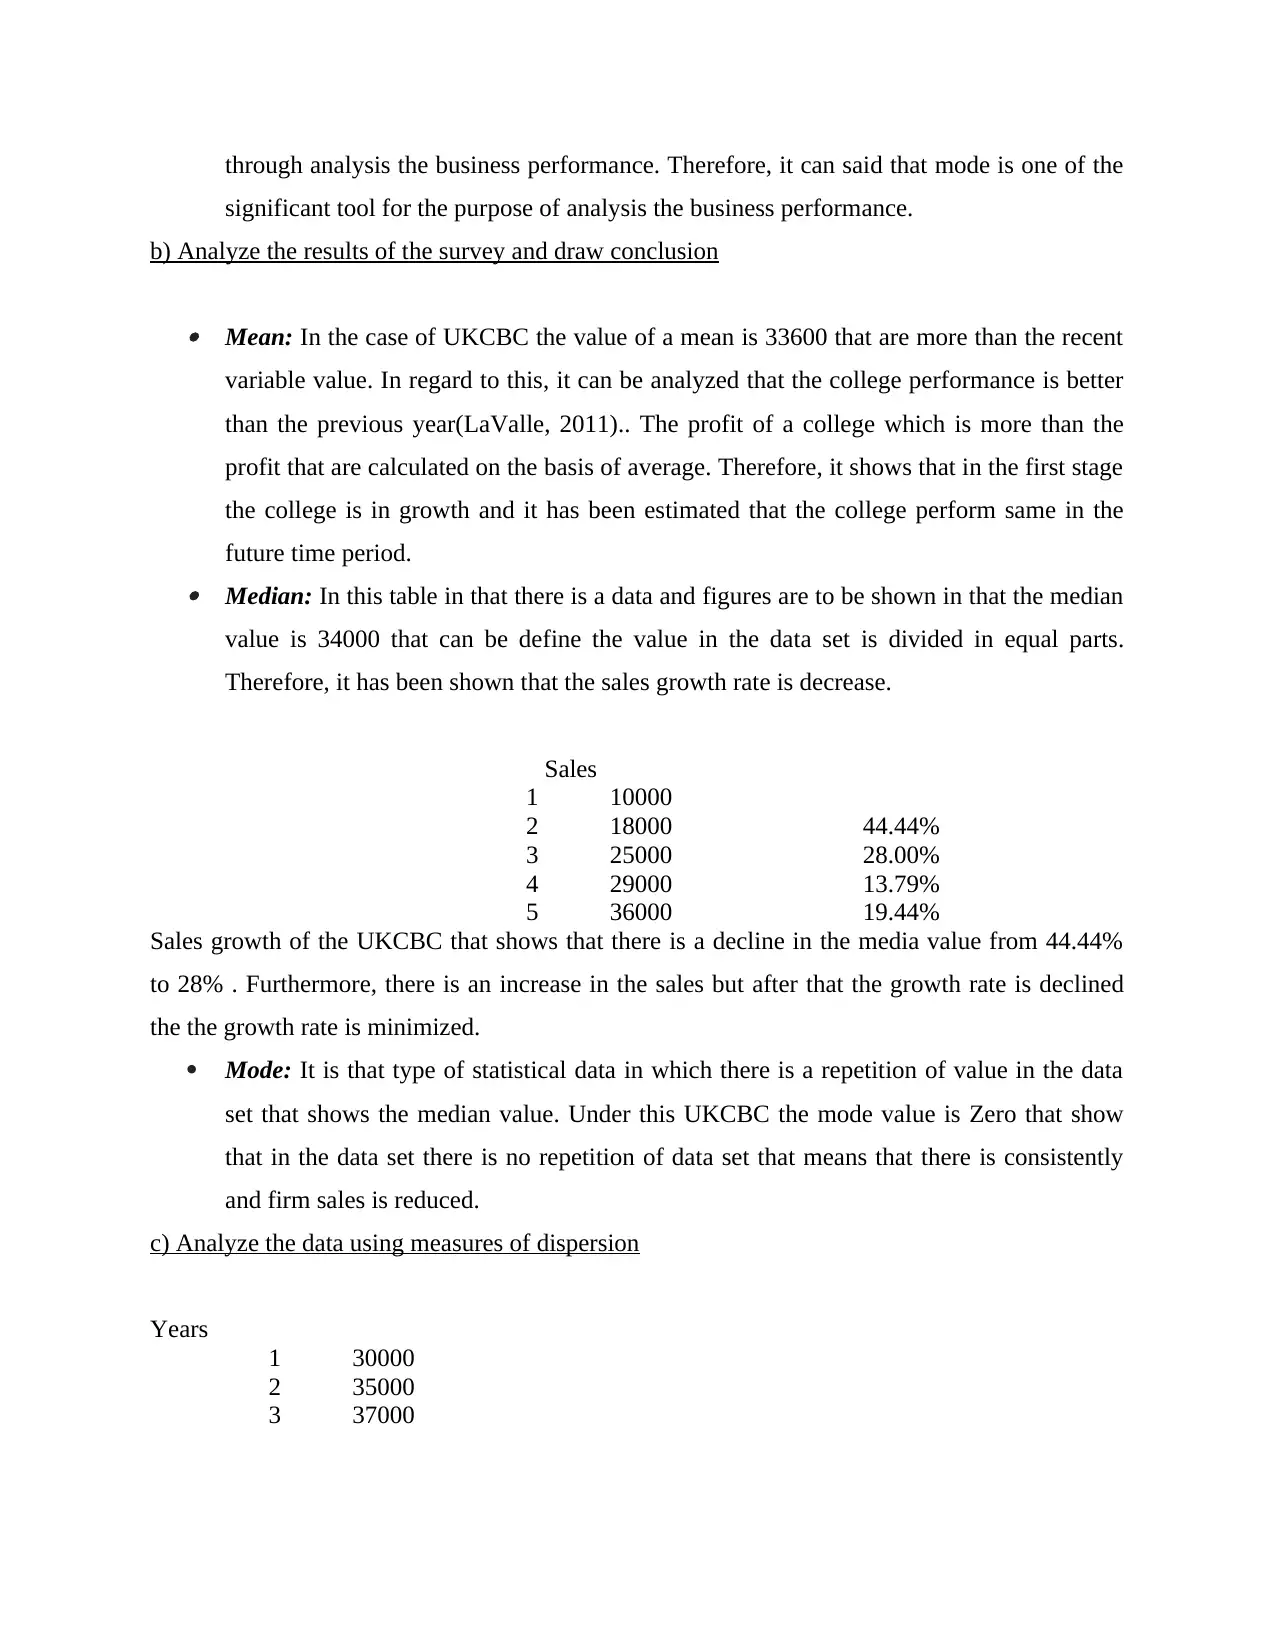
b) Analyze the results of the survey and draw conclusion
Mean: In the case of UKCBC the value of a mean is 33600 that are more than the recent
variable value. In regard to this, it can be analyzed that the college performance is better
than the previous year(LaValle, 2011).. The profit of a college which is more than the
profit that are calculated on the basis of average. Therefore, it shows that in the first stage
the college is in growth and it has been estimated that the college perform same in the
future time period. Median: In this table in that there is a data and figures are to be shown in that the median
value is 34000 that can be define the value in the data set is divided in equal parts.
Therefore, it has been shown that the sales growth rate is decrease.
Sales
1 10000
2 18000 44.44%
3 25000 28.00%
4 29000 13.79%
5 36000 19.44%
Sales growth of the UKCBC that shows that there is a decline in the media value from 44.44%
to 28% . Furthermore, there is an increase in the sales but after that the growth rate is declined
the the growth rate is minimized.
Mode: It is that type of statistical data in which there is a repetition of value in the data
set that shows the median value. Under this UKCBC the mode value is Zero that show
that in the data set there is no repetition of data set that means that there is consistently
and firm sales is reduced.
c) Analyze the data using measures of dispersion
Years
1 30000
2 35000
3 37000
significant tool for the purpose of analysis the business performance.
b) Analyze the results of the survey and draw conclusion
Mean: In the case of UKCBC the value of a mean is 33600 that are more than the recent
variable value. In regard to this, it can be analyzed that the college performance is better
than the previous year(LaValle, 2011).. The profit of a college which is more than the
profit that are calculated on the basis of average. Therefore, it shows that in the first stage
the college is in growth and it has been estimated that the college perform same in the
future time period. Median: In this table in that there is a data and figures are to be shown in that the median
value is 34000 that can be define the value in the data set is divided in equal parts.
Therefore, it has been shown that the sales growth rate is decrease.
Sales
1 10000
2 18000 44.44%
3 25000 28.00%
4 29000 13.79%
5 36000 19.44%
Sales growth of the UKCBC that shows that there is a decline in the media value from 44.44%
to 28% . Furthermore, there is an increase in the sales but after that the growth rate is declined
the the growth rate is minimized.
Mode: It is that type of statistical data in which there is a repetition of value in the data
set that shows the median value. Under this UKCBC the mode value is Zero that show
that in the data set there is no repetition of data set that means that there is consistently
and firm sales is reduced.
c) Analyze the data using measures of dispersion
Years
1 30000
2 35000
3 37000
4 34000
5 32000
6
Mean 33600
Median 34000
Mode #VALUE!
STDEV 2701.85121
72213
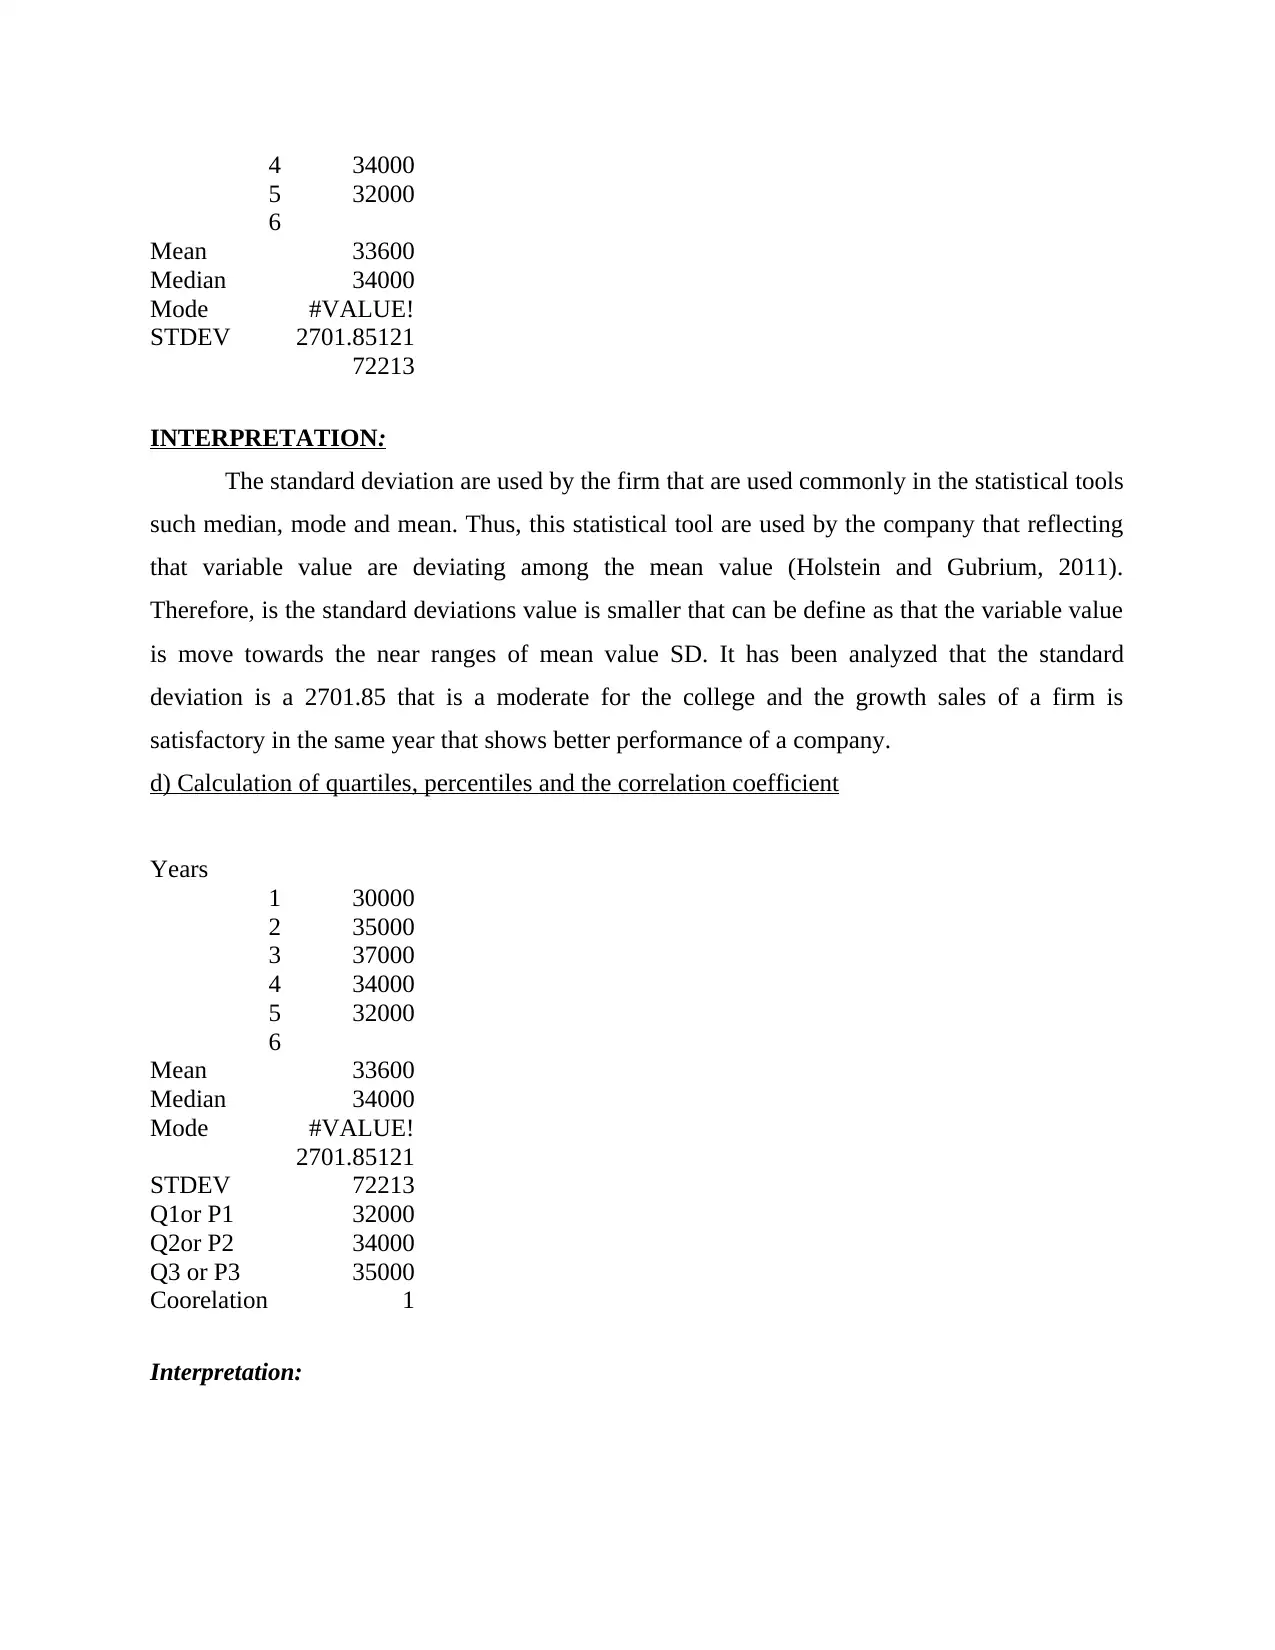
INTERPRETATION:
The standard deviation are used by the firm that are used commonly in the statistical tools
such median, mode and mean. Thus, this statistical tool are used by the company that reflecting
that variable value are deviating among the mean value (Holstein and Gubrium, 2011).
Therefore, is the standard deviations value is smaller that can be define as that the variable value
is move towards the near ranges of mean value SD. It has been analyzed that the standard
deviation is a 2701.85 that is a moderate for the college and the growth sales of a firm is
satisfactory in the same year that shows better performance of a company.
d) Calculation of quartiles, percentiles and the correlation coefficient
Years
1 30000
2 35000
3 37000
4 34000
5 32000
6
Mean 33600
Median 34000
Mode #VALUE!
STDEV
2701.85121
72213
Q1or P1 32000
Q2or P2 34000
Q3 or P3 35000
Coorelation 1
Interpretation:
5 32000
6
Mean 33600
Median 34000
Mode #VALUE!
STDEV 2701.85121
72213
INTERPRETATION:
The standard deviation are used by the firm that are used commonly in the statistical tools
such median, mode and mean. Thus, this statistical tool are used by the company that reflecting
that variable value are deviating among the mean value (Holstein and Gubrium, 2011).
Therefore, is the standard deviations value is smaller that can be define as that the variable value
is move towards the near ranges of mean value SD. It has been analyzed that the standard
deviation is a 2701.85 that is a moderate for the college and the growth sales of a firm is
satisfactory in the same year that shows better performance of a company.
d) Calculation of quartiles, percentiles and the correlation coefficient
Years
1 30000
2 35000
3 37000
4 34000
5 32000
6
Mean 33600
Median 34000
Mode #VALUE!
STDEV
2701.85121
72213
Q1or P1 32000
Q2or P2 34000
Q3 or P3 35000
Coorelation 1
Interpretation:
⊘ This is a preview!⊘
Do you want full access?
Subscribe today to unlock all pages.
Trusted by 1+ million students worldwide
Correlation that shows the relationship among the two variables that shows the
relationship among the variables that reflects through correlation value. It said that if the
correlation value is positive than it can be def(Holstein and Gubrium, 2011ine that the variables
from each other are correlated. The value is lies between -1,0 and +1 if the value of correlation
is negative then the variables are negatively correlated from each other. It is also defined as that
the variable value one is increase and other variable is decrease. In the above table the
correlation value of a UKCBC is a positive that is 1 which show that the college is depend upon
the sales.
Percentile &Quartile
Interpretation:
Percentile and quartile both are the statistical method and these are divided in multiple
parts in the sets of data (Aggarwal, 2011). From the above table there is a data and figures
shows that value of quartile is inclined and value among the percentile among q2 and q3 that
shows that the growth rate of UKCBC is increased.
TASK 3
a) Graphical presentation
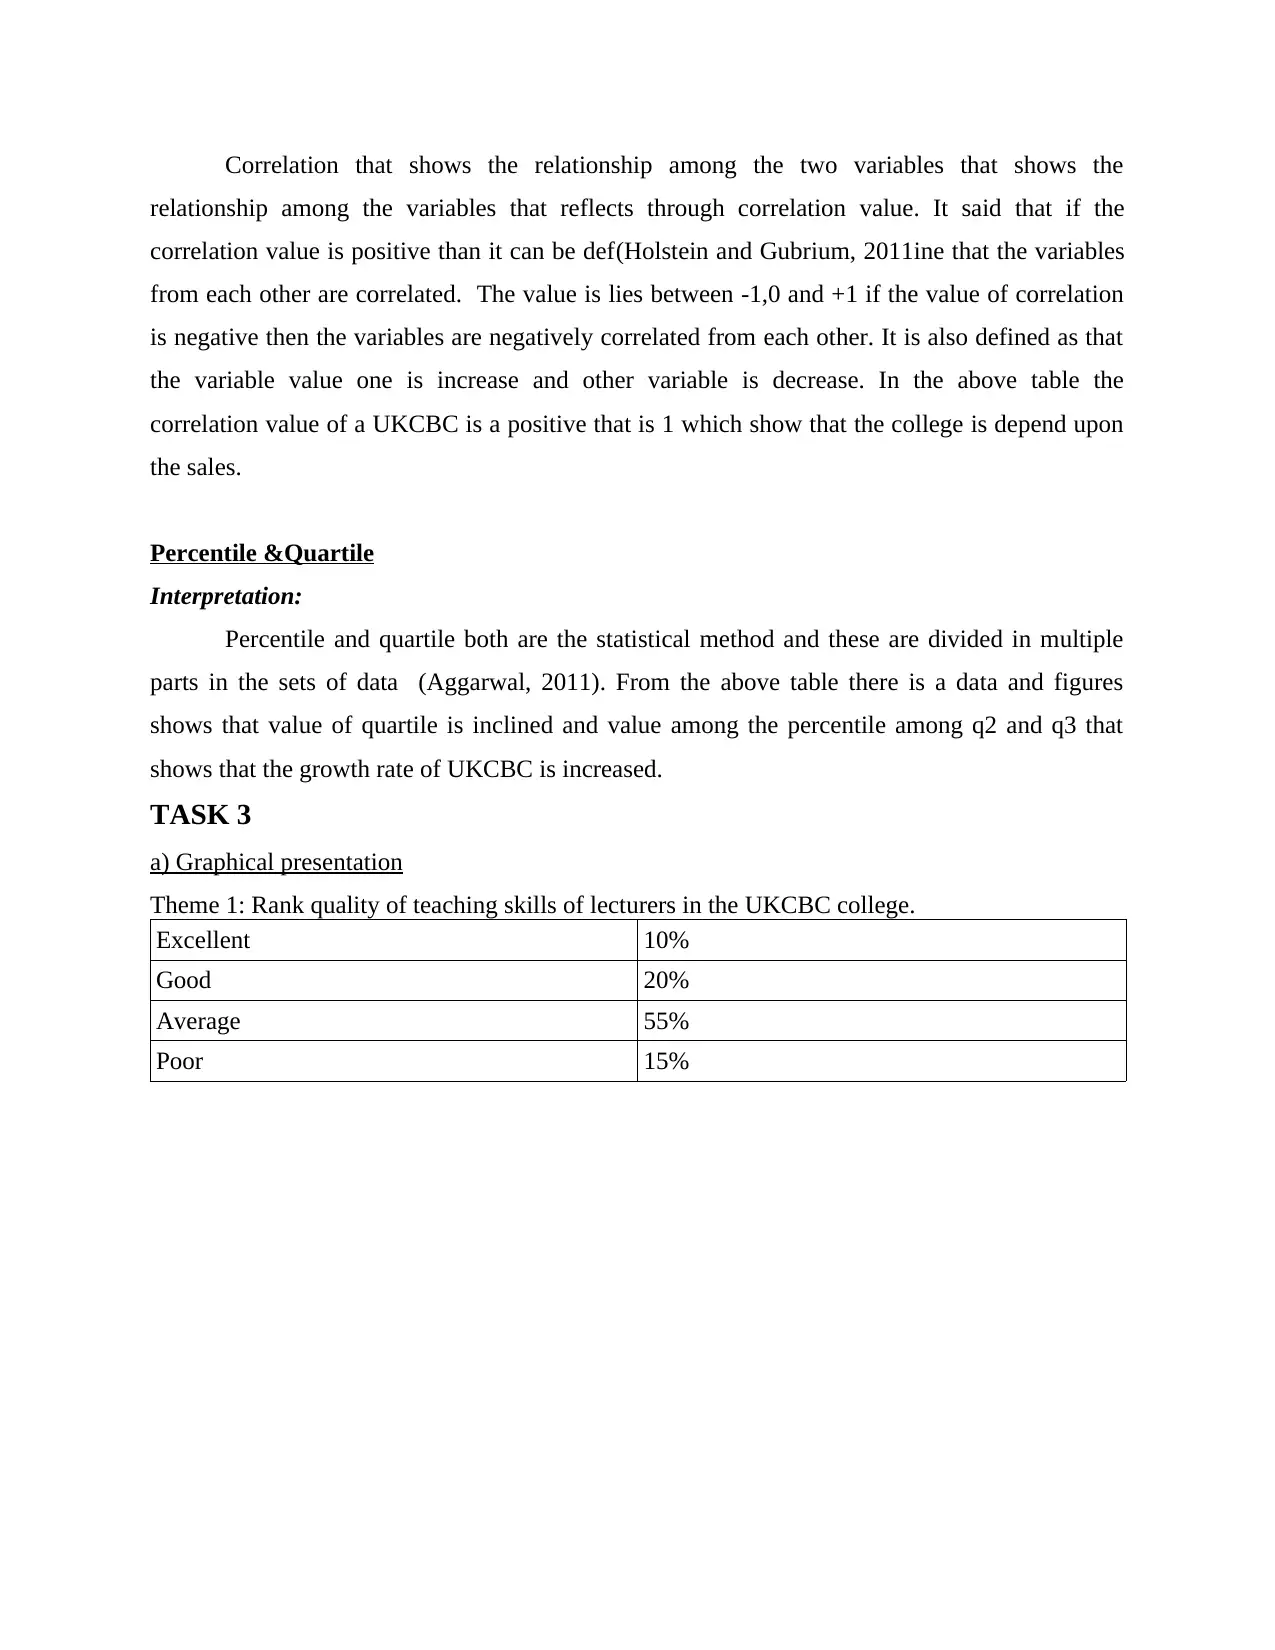
Theme 1: Rank quality of teaching skills of lecturers in the UKCBC college.
Excellent 10%
Good 20%
Average 55%
Poor 15%
relationship among the variables that reflects through correlation value. It said that if the
correlation value is positive than it can be def(Holstein and Gubrium, 2011ine that the variables
from each other are correlated. The value is lies between -1,0 and +1 if the value of correlation
is negative then the variables are negatively correlated from each other. It is also defined as that
the variable value one is increase and other variable is decrease. In the above table the
correlation value of a UKCBC is a positive that is 1 which show that the college is depend upon
the sales.
Percentile &Quartile
Interpretation:
Percentile and quartile both are the statistical method and these are divided in multiple
parts in the sets of data (Aggarwal, 2011). From the above table there is a data and figures
shows that value of quartile is inclined and value among the percentile among q2 and q3 that
shows that the growth rate of UKCBC is increased.
TASK 3
a) Graphical presentation
Theme 1: Rank quality of teaching skills of lecturers in the UKCBC college.
Excellent 10%
Good 20%
Average 55%
Poor 15%
Paraphrase This Document
Need a fresh take? Get an instant paraphrase of this document with our AI Paraphraser
Interpretation: From the above discussion it can be concluded that 10% respondents rank the
teaching skills of lectures of UKCBC excellent. In addition, 20% answers have viewed it good
but 55% students have ranked is average (Bierer and et.al, 2015). From the discussion it can be
interpreted that teachers are not delivering good knowledge to the learners and their way of
teaching is not that much appropriate. So college needs to work upon that and it needs to train its
teachers so that they can know about new teaching techniques and involve practical experience
in mid of the teaching. That will enhance their quality and by this way students will get good
knowledge.
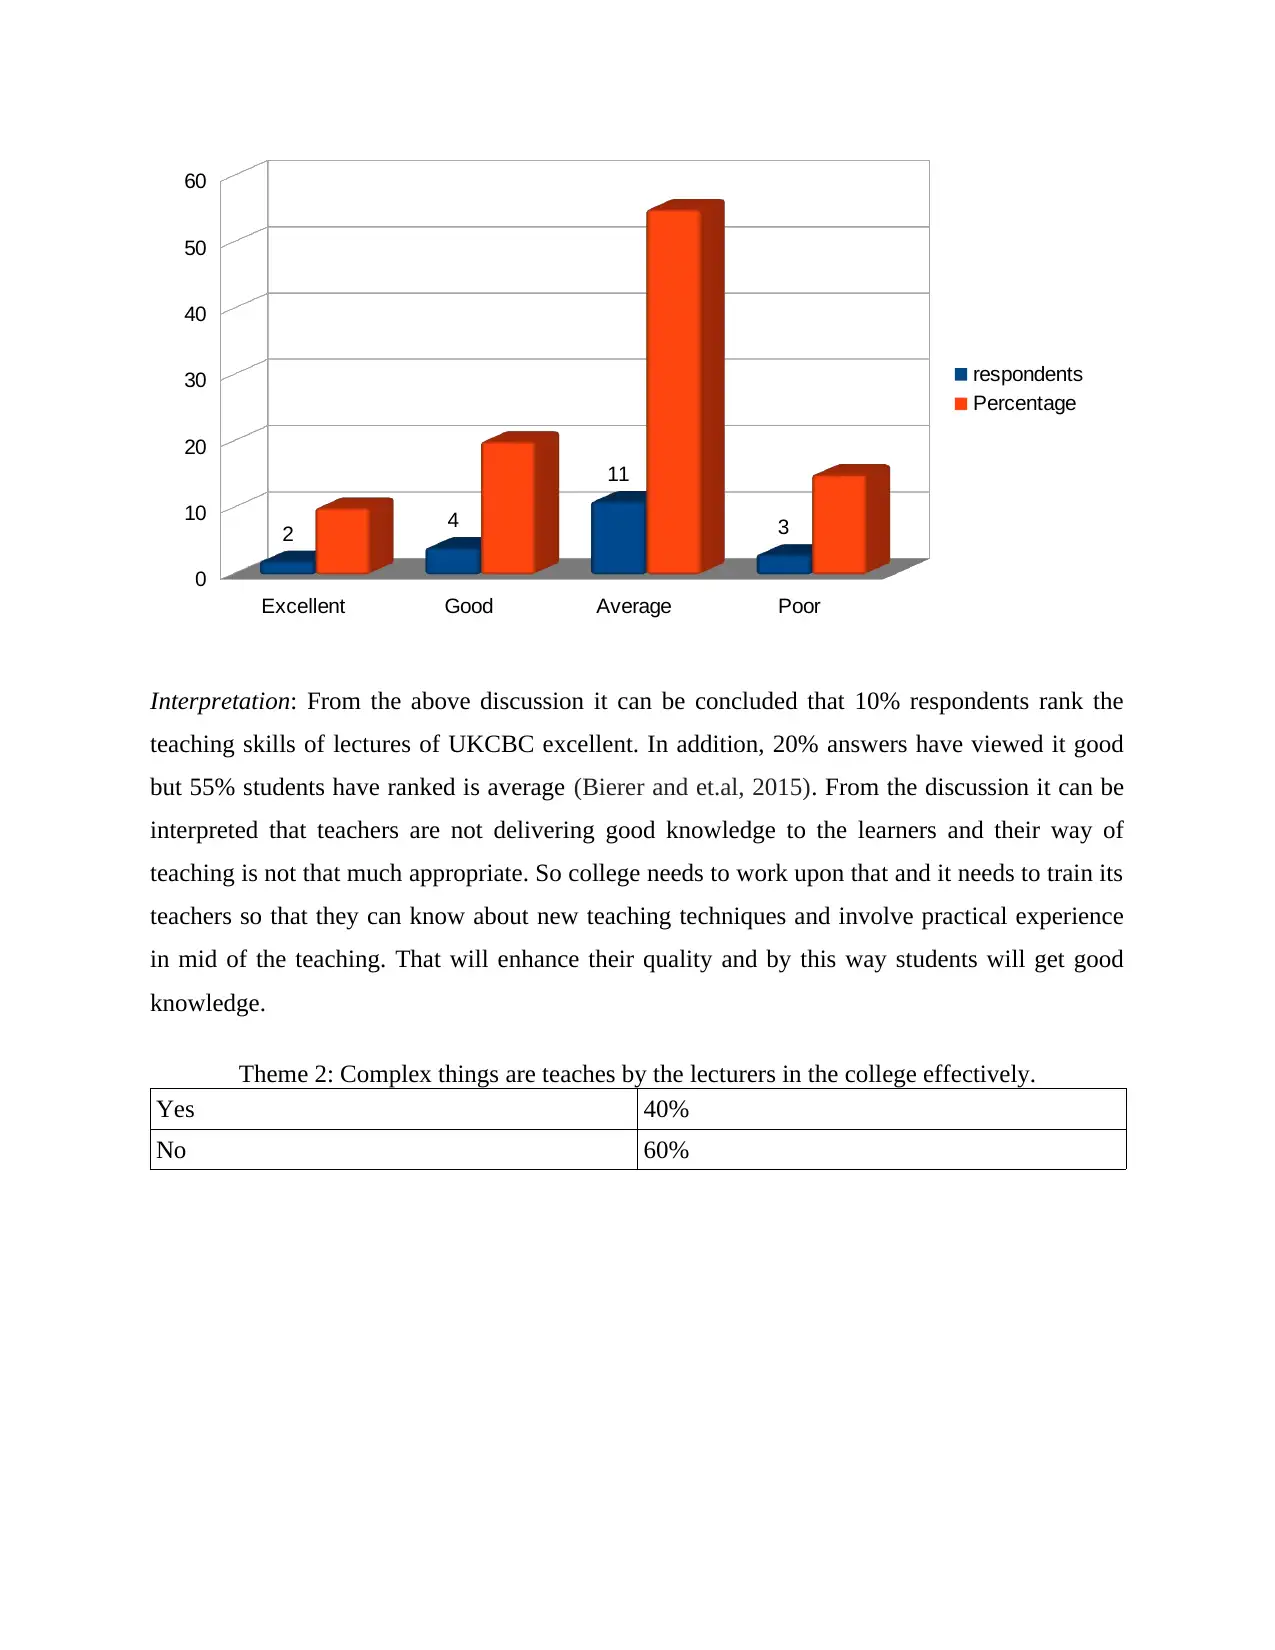
Theme 2: Complex things are teaches by the lecturers in the college effectively.
Yes 40%
No 60%
Excellent Good Average Poor
0
10
20
30
40
50
60
2 4
11
3
respondents
Percentage
teaching skills of lectures of UKCBC excellent. In addition, 20% answers have viewed it good
but 55% students have ranked is average (Bierer and et.al, 2015). From the discussion it can be
interpreted that teachers are not delivering good knowledge to the learners and their way of
teaching is not that much appropriate. So college needs to work upon that and it needs to train its
teachers so that they can know about new teaching techniques and involve practical experience
in mid of the teaching. That will enhance their quality and by this way students will get good
knowledge.
Theme 2: Complex things are teaches by the lecturers in the college effectively.
Yes 40%
No 60%
Excellent Good Average Poor
0
10
20
30
40
50
60
2 4
11
3
respondents
Percentage
Interpretation: From the above discussion it is found that lectures in the UKCBC college are not
teaching the complex things in the college well. 60% respondents have viewed that lecture are
giving them theoretical knowledge and that is why they are unable to get in depth information
about the subject (Hillebrand and et.al, 2014). 40% answers have said that teachers are teaching
them well and giving complex information significantly. From the discussion it can be
interpreted that lecturers are required to improve their knowledge so that they can give good
information about complex files well.
Theme 3: Satisfaction level of students with studies if UKCBC
Satisfied 20%
Highly satisfied 10%
Neutral 45%
Dissatisfied 15%
Highly dissatisfied 10%
8
12
Yes
No
⊘ This is a preview!⊘
Do you want full access?
Subscribe today to unlock all pages.
Trusted by 1+ million students worldwide
1 out of 21
Related Documents


Your All-in-One AI-Powered Toolkit for Academic Success.
+13062052269
info@desklib.com
Available 24*7 on WhatsApp / Email
![[object Object]](/_next/static/media/star-bottom.7253800d.svg)
Unlock your academic potential
Copyright © 2020–2026 A2Z Services. All Rights Reserved. Developed and managed by ZUCOL.