Comprehensive Report on UKCBC Student Experience and Satisfaction
VerifiedAdded on 2020/06/04
|21
|5108
|63
Report
AI Summary
This report presents an analysis of student experiences and satisfaction at the UK College of Computing and Business (UKCBC). It details the methodology used to collect data from students across four campuses, including questionnaire design, sampling techniques, and survey methods. The report summarizes and analyzes the collected data using representative values like mean, median, mode, and standard deviation to assess student satisfaction with academic programs, faculty quality, information resources, and campus security. Furthermore, the report explores the application of information processing and financial tools for strategic decision-making, culminating in the presentation of findings and recommendations for UKCBC's management. The report is designed to provide insights that will aid in making informed decisions for the growth and development of UKCBC, based on the feedback and experiences of its students.

BUSINESS DECISION
MAKING
MAKING
Paraphrase This Document
Need a fresh take? Get an instant paraphrase of this document with our AI Paraphraser
Table of Contents
INTRODUCTION...........................................................................................................................1
TASK 1............................................................................................................................................1
1.1 Prepare a plan for collecting data..........................................................................................1
1.2 Use of sample framing and survey methodology..................................................................2
1.3 Designing a questionnaire.....................................................................................................3
TASK 2............................................................................................................................................5
2.1, 2.2 & 2.3 Summarise and analyse the data by using representative value...........................5
2.4 Use of quartile, percentile and correlation coefficient..........................................................8
TASK 3............................................................................................................................................9
3.1 & 3.2 Creation of graphs and trend line by consulting data.................................................9
3.3 Power point presentation for appropriate findings..............................................................13
3.4 Preparation of formal student report...................................................................................13
TASK 4..........................................................................................................................................13
4.1 Use of information processing tool in relation to formulate strategy.................................13
4.2 Prepare a project plan and determine critical path .............................................................14
...................................................................................................................................................16
4.3 Use of financial tool at the time of decision making..........................................................16
CONCLUSION..............................................................................................................................18
REFERENCES..............................................................................................................................19

⊘ This is a preview!⊘
Do you want full access?
Subscribe today to unlock all pages.
Trusted by 1+ million students worldwide
INTRODUCTION
For any idea, it is compulsory for an individual to prepare a plan which is helpful in
executing the task properly. Business is a idea in which variety number of ideas are discussed
with a aim to generate more and more profit. Management have to consider their financial
statement and preference of their users so that they can frame such sort of strategies which are
helpful for them in their long term. For any business decision making some reports and data have
to get collected which enable in take any beneficial decision. The main agenda of this file is all
about appropriate decision which has taken by the UK college of computing and business.
Student representative have to prepare a report for which appropriate amount of data get
collected through various number of students around the all 4 campus of college. The survey get
conducted through questionnaire by selecting number of respondent through sample framing.
Once the data get collected a major analysis get done on that through which appropriate
conclusion get draw. By suitable finding, management can take appropriate decision for growth
and development. All these things lead to discuss in this assignment (Gabrielsson, 2013).
TASK 1
1.1 Prepare a plan for collecting data
Appropriate plan is necessary for conducting any research. This enable in collecting
appropriate amount of data through various number of sources. Student representative of
UKCBC, have to prepare a plan under which the results which get conclude become useful for
preparing their strategies. Hence, appropriate plan for collecting data through number of students
are as follow:
Time: To conduct the research, the plan of collecting required data from different
departments had been prepared. Review has been analysed with the assistance of research
company Quality Assurance Agency (QAA) which has contributed the college in analysis
and collecting the data and information. The research has gone with the process of survey
which will be completed within one month.
Locations: The sample of research has been collected from all four campus of UK college
of business and computing(UKCBC) which are Main campus of UKCBC at Gants Hill,
The Lords House Campus at Gants Hill, Windermere House at Park Royal (West
London) and Victory Park near Cricklewood (North West London).
1
Paraphrase This Document
Need a fresh take? Get an instant paraphrase of this document with our AI Paraphraser
Survey methods: For data collection process, a researcher have to use various number of
techniques which are helpful in collecting appropriate information from various number
of respondents. Personal interviews, telephonic interviews, questionnaire etc. are some
major approaches which are helpful in data collection process. For this research,
questionnaire is used as a best method (García-Peñalvo and Gabrielsson, 2013).
Types of data: The study has contained the Primary data and both quantitative and
qualitative research which has been use to analyse the research's final outcome. The
research is a descriptive research using survey method to find out the experiences and
satisfaction level of students from different campuses of UKCBC.
Resources: The questionnaires were mailed out to all 200 representatives UK College of
Business and Computing. Participants has filled form separately. This research has been
completed with the assistance of research organisation 'Quality Assurance Agency
(QAA)' which is contributing to gather the data from the student of university and
analyse it.
Budget: Budget is an essential element which aid in identify the areas for expense so that
an individual can spend according to requirement of project. Every organisation allocate
some amount of fund to their department with a single objective which is just to attain
high profit. Same thing is going to be done in UKCBC report with a aim to increase the
reliability of data. Budget of this research project was 2000$ which include all the
financial, paper work and other expenses. Thus, these factors are helpful in such a
manner to make research successful (Richardson and Ford, 2010).
1.2 Use of sample framing and survey methodology
Survey method is technique of collecting data by utilizing various survey tools and
techniques such as questionnaire, interview, observation etc. in order to contact with the sample
and gather the desired information helpful for the research. In this study, survey method has
attempted to collect primary data to get attitude of students, to examine their level of experiences
and their facilities provided by the college union and conduct segmentation research. The
questionnaire methodology will be used in order to get the responses by asking question using
social media such as emails, Facebook text messaging, google questionnaire, and fill the
questionnaire papers in the campuses as the mode of communication.
2
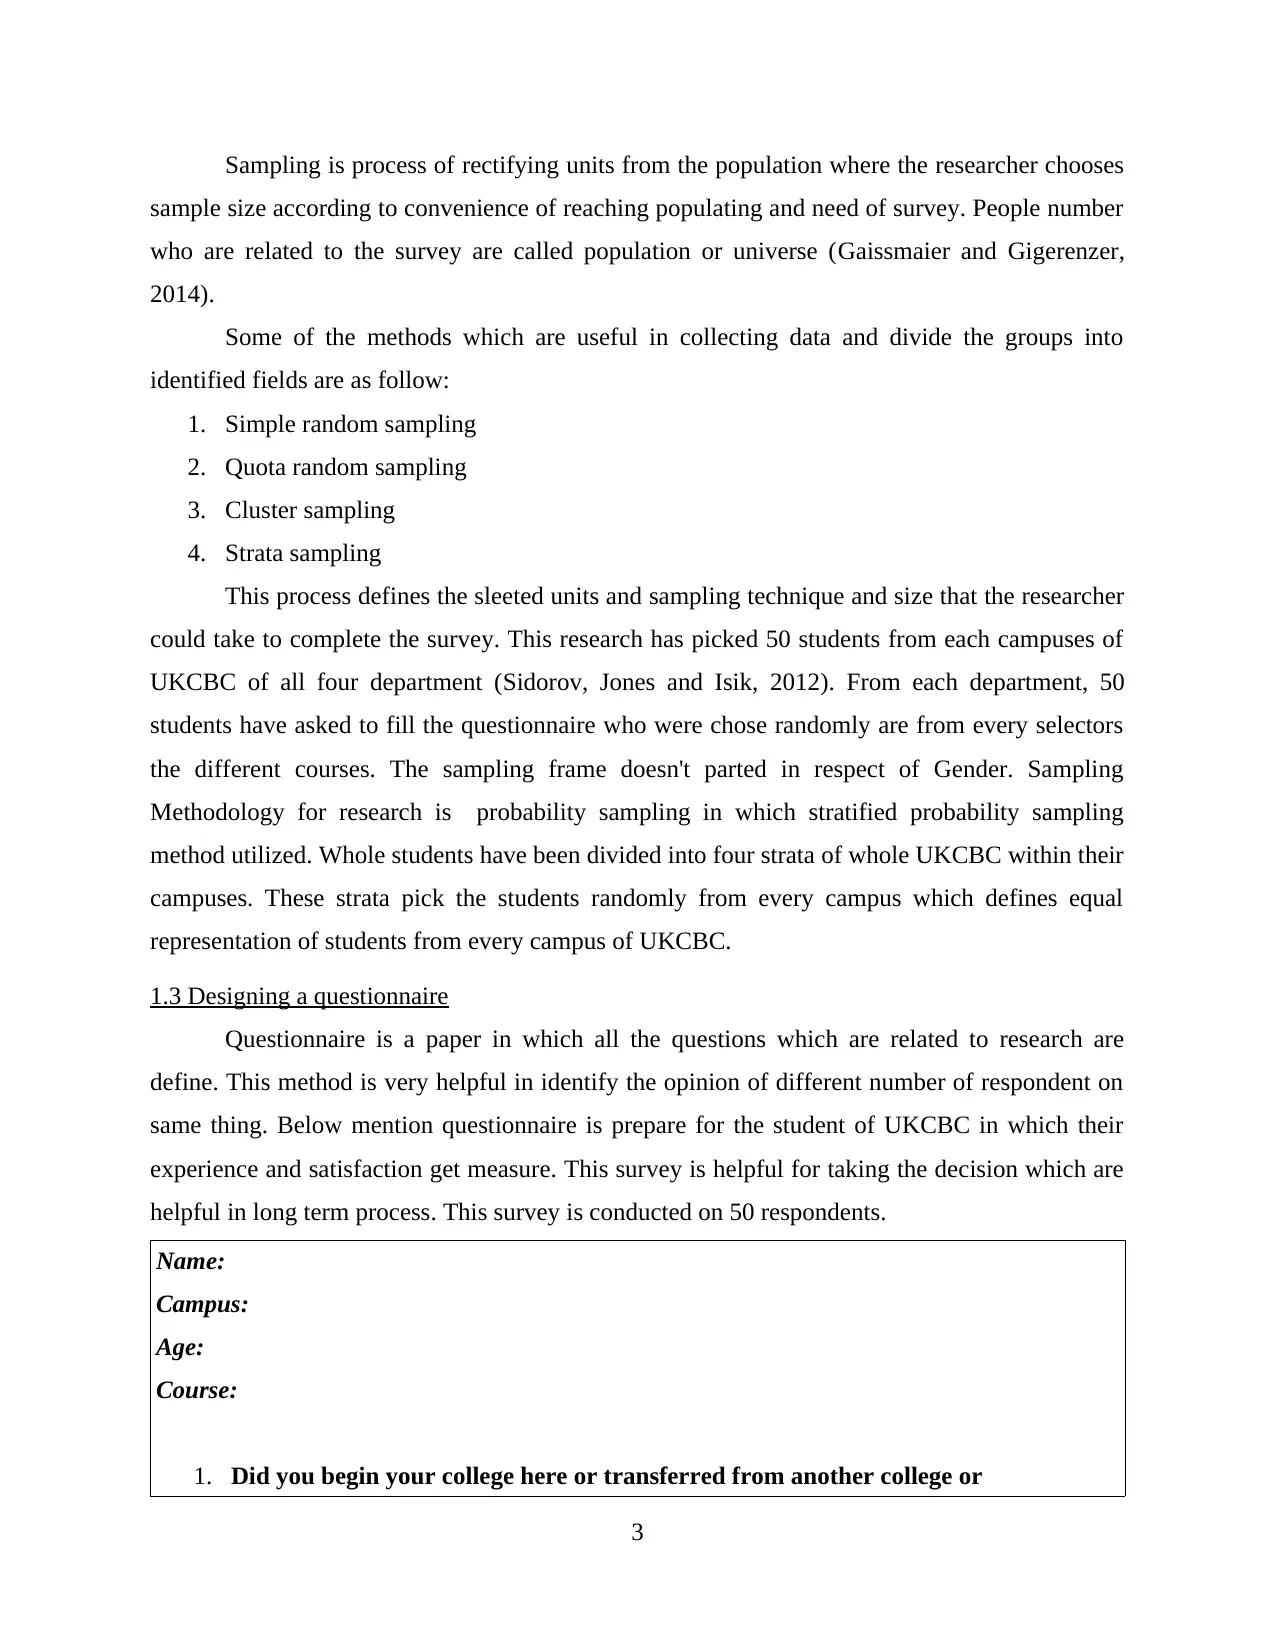
Sampling is process of rectifying units from the population where the researcher chooses
sample size according to convenience of reaching populating and need of survey. People number
who are related to the survey are called population or universe (Gaissmaier and Gigerenzer,
2014).
Some of the methods which are useful in collecting data and divide the groups into
identified fields are as follow:
1. Simple random sampling
2. Quota random sampling
3. Cluster sampling
4. Strata sampling
This process defines the sleeted units and sampling technique and size that the researcher
could take to complete the survey. This research has picked 50 students from each campuses of
UKCBC of all four department (Sidorov, Jones and Isik, 2012). From each department, 50
students have asked to fill the questionnaire who were chose randomly are from every selectors
the different courses. The sampling frame doesn't parted in respect of Gender. Sampling
Methodology for research is probability sampling in which stratified probability sampling
method utilized. Whole students have been divided into four strata of whole UKCBC within their
campuses. These strata pick the students randomly from every campus which defines equal
representation of students from every campus of UKCBC.
1.3 Designing a questionnaire
Questionnaire is a paper in which all the questions which are related to research are
define. This method is very helpful in identify the opinion of different number of respondent on
same thing. Below mention questionnaire is prepare for the student of UKCBC in which their
experience and satisfaction get measure. This survey is helpful for taking the decision which are
helpful in long term process. This survey is conducted on 50 respondents.
Name:
Campus:
Age:
Course:
1. Did you begin your college here or transferred from another college or
3
⊘ This is a preview!⊘
Do you want full access?
Subscribe today to unlock all pages.
Trusted by 1+ million students worldwide
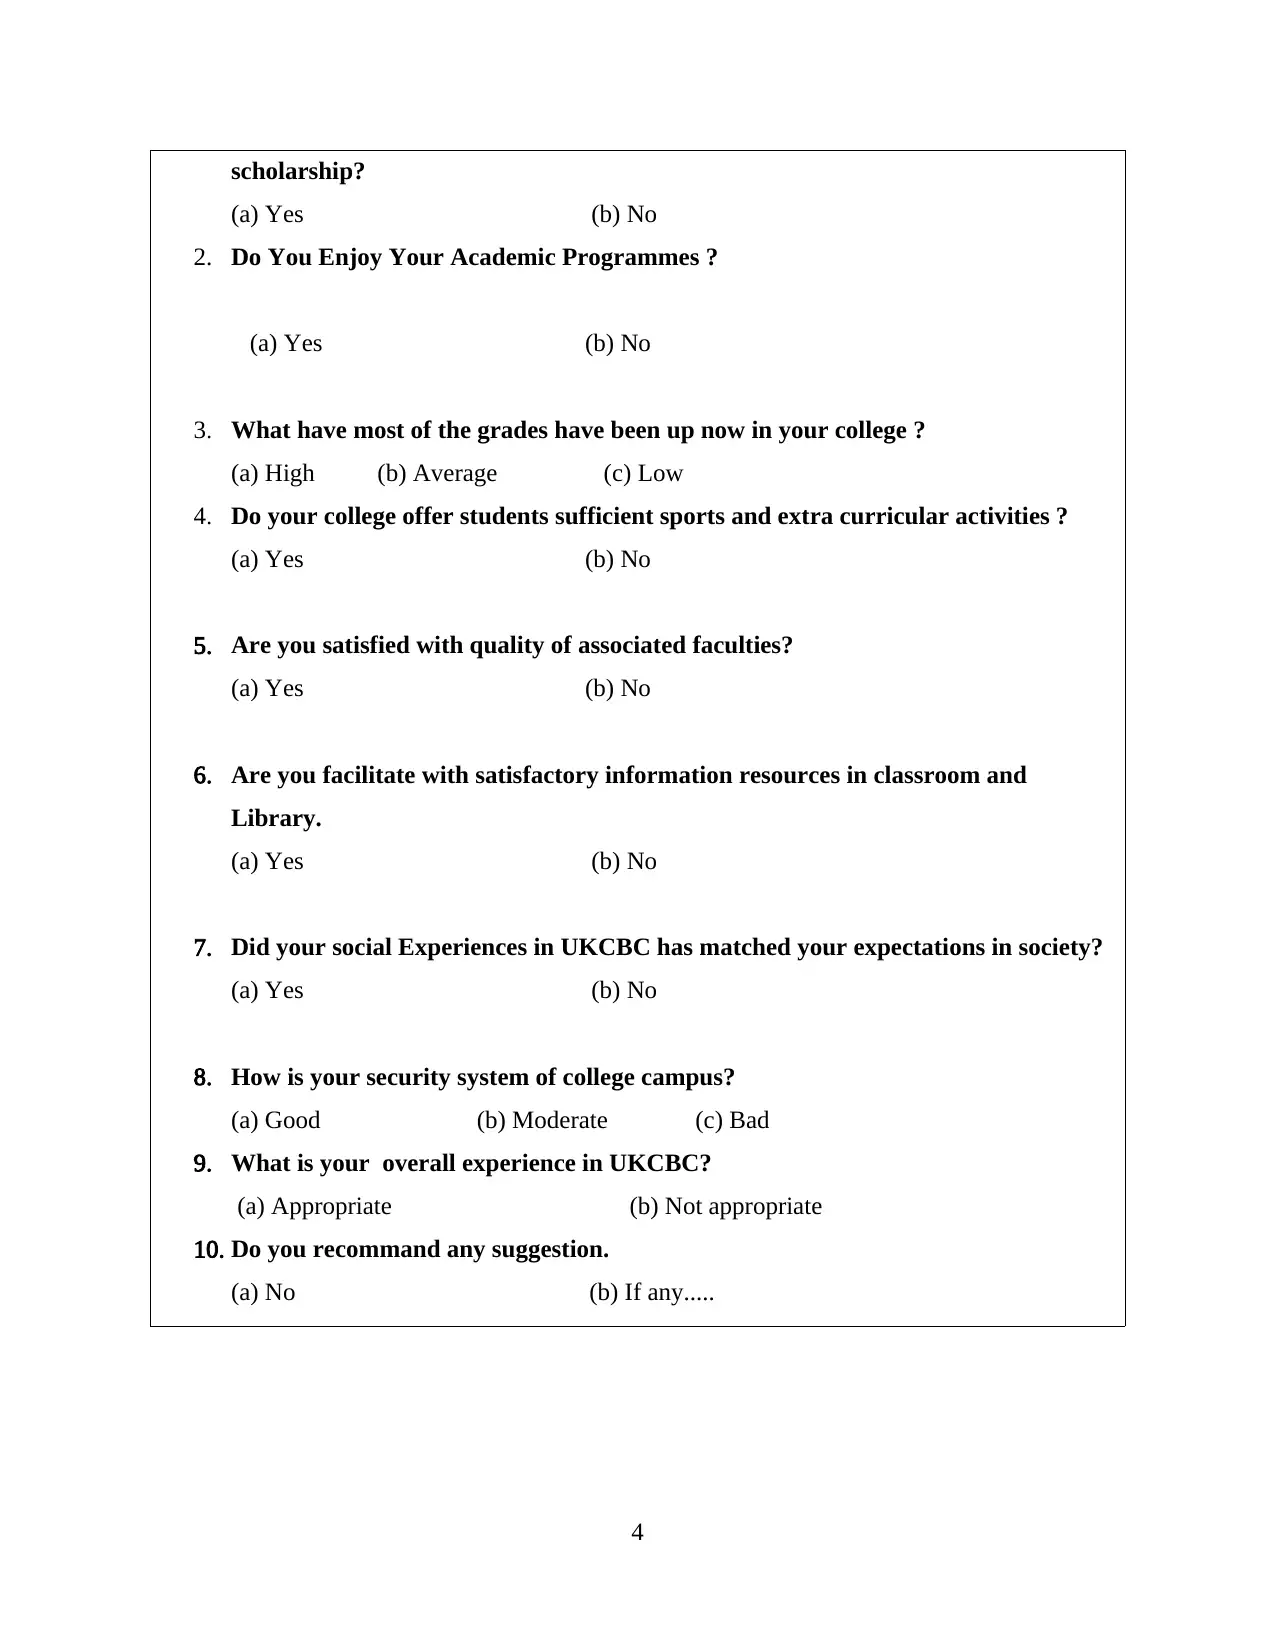
scholarship?
(a) Yes (b) No
2. Do You Enjoy Your Academic Programmes ?
(a) Yes (b) No
3. What have most of the grades have been up now in your college ?
(a) High (b) Average (c) Low
4. Do your college offer students sufficient sports and extra curricular activities ?
(a) Yes (b) No
5. Are you satisfied with quality of associated faculties?
(a) Yes (b) No
6. Are you facilitate with satisfactory information resources in classroom and
Library.
(a) Yes (b) No
7. Did your social Experiences in UKCBC has matched your expectations in society?
(a) Yes (b) No
8. How is your security system of college campus?
(a) Good (b) Moderate (c) Bad
9. What is your overall experience in UKCBC?
(a) Appropriate (b) Not appropriate
10. Do you recommand any suggestion.
(a) No (b) If any.....
4
(a) Yes (b) No
2. Do You Enjoy Your Academic Programmes ?
(a) Yes (b) No
3. What have most of the grades have been up now in your college ?
(a) High (b) Average (c) Low
4. Do your college offer students sufficient sports and extra curricular activities ?
(a) Yes (b) No
5. Are you satisfied with quality of associated faculties?
(a) Yes (b) No
6. Are you facilitate with satisfactory information resources in classroom and
Library.
(a) Yes (b) No
7. Did your social Experiences in UKCBC has matched your expectations in society?
(a) Yes (b) No
8. How is your security system of college campus?
(a) Good (b) Moderate (c) Bad
9. What is your overall experience in UKCBC?
(a) Appropriate (b) Not appropriate
10. Do you recommand any suggestion.
(a) No (b) If any.....
4
Paraphrase This Document
Need a fresh take? Get an instant paraphrase of this document with our AI Paraphraser
TASK 2
2.1, 2.2 & 2.3 Summarise and analyse the data by using representative value
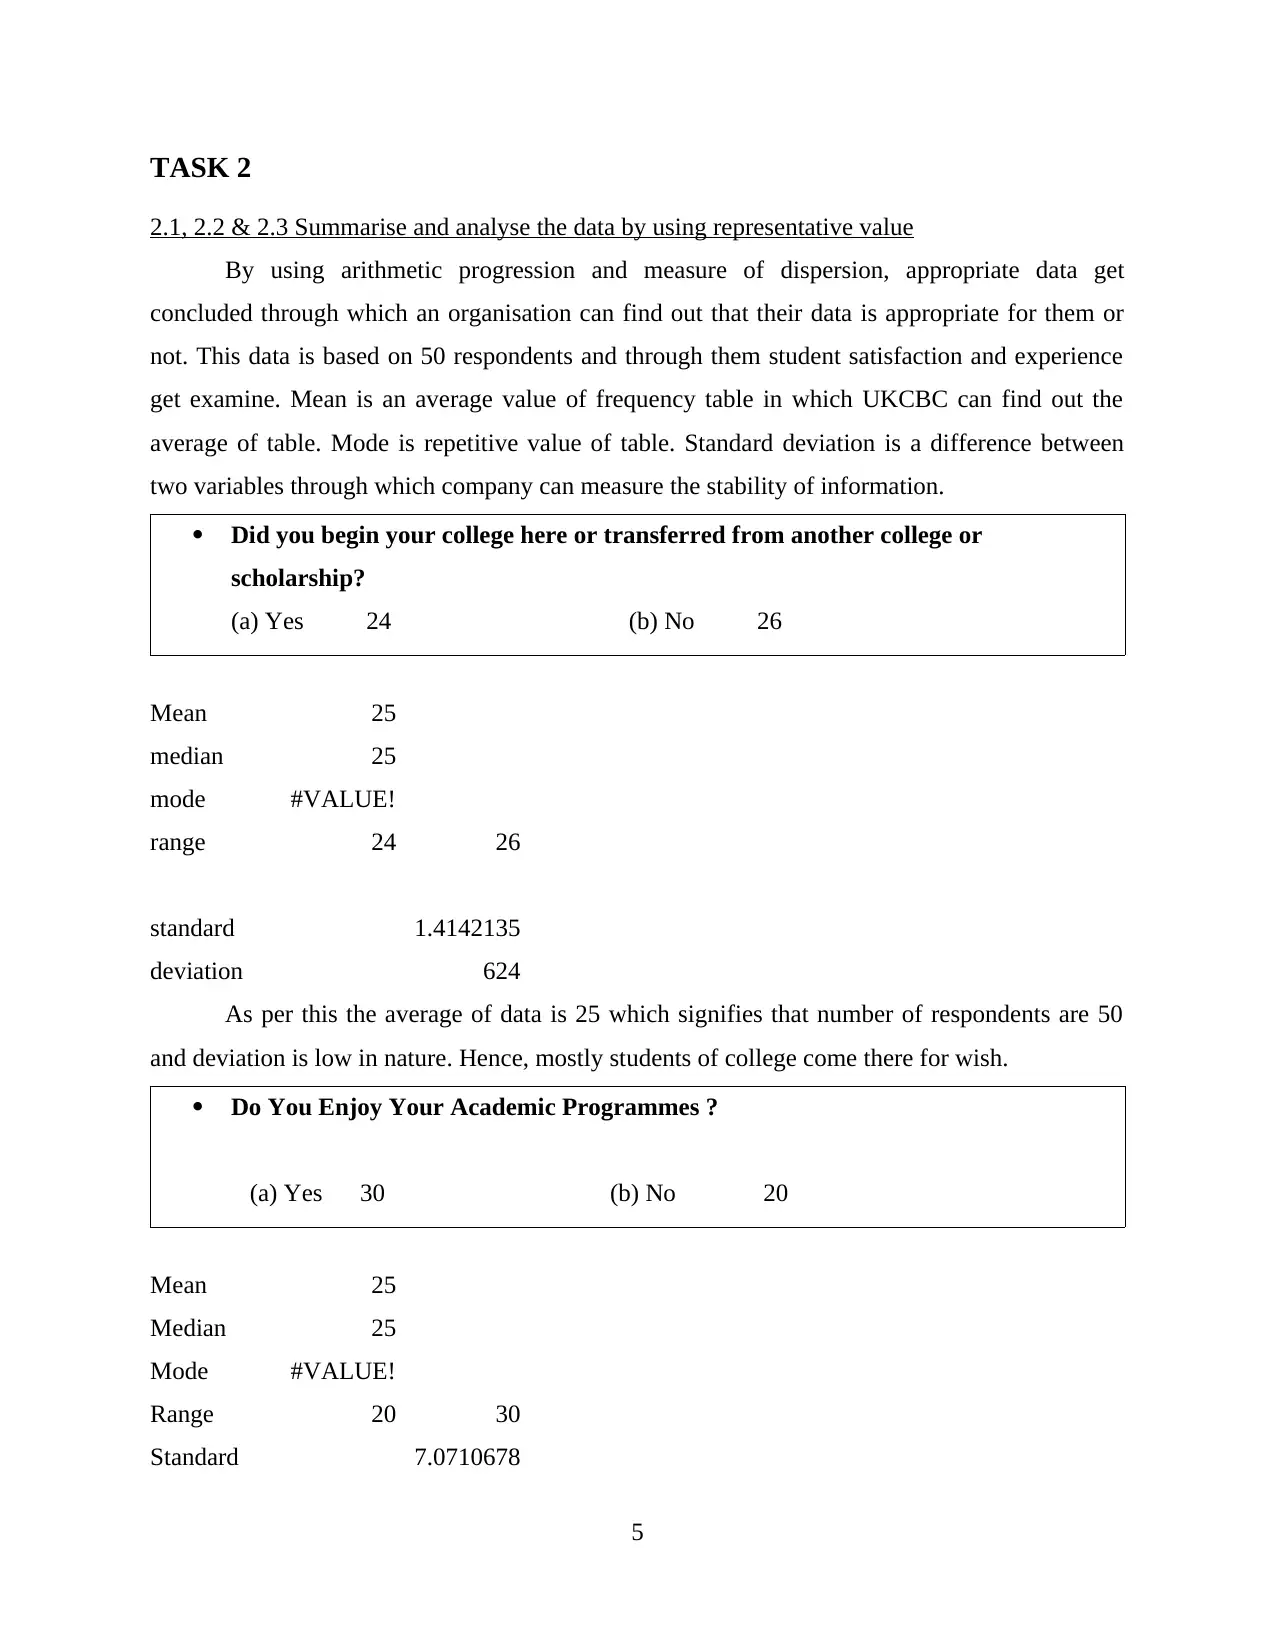
By using arithmetic progression and measure of dispersion, appropriate data get
concluded through which an organisation can find out that their data is appropriate for them or
not. This data is based on 50 respondents and through them student satisfaction and experience
get examine. Mean is an average value of frequency table in which UKCBC can find out the
average of table. Mode is repetitive value of table. Standard deviation is a difference between
two variables through which company can measure the stability of information.
Did you begin your college here or transferred from another college or
scholarship?
(a) Yes 24 (b) No 26
Mean 25
median 25
mode #VALUE!
range 24 26
standard
deviation
1.4142135
624
As per this the average of data is 25 which signifies that number of respondents are 50
and deviation is low in nature. Hence, mostly students of college come there for wish.
Do You Enjoy Your Academic Programmes ?
(a) Yes 30 (b) No 20
Mean 25
Median 25
Mode #VALUE!
Range 20 30
Standard 7.0710678
5
2.1, 2.2 & 2.3 Summarise and analyse the data by using representative value
By using arithmetic progression and measure of dispersion, appropriate data get
concluded through which an organisation can find out that their data is appropriate for them or
not. This data is based on 50 respondents and through them student satisfaction and experience
get examine. Mean is an average value of frequency table in which UKCBC can find out the
average of table. Mode is repetitive value of table. Standard deviation is a difference between
two variables through which company can measure the stability of information.
Did you begin your college here or transferred from another college or
scholarship?
(a) Yes 24 (b) No 26
Mean 25
median 25
mode #VALUE!
range 24 26
standard
deviation
1.4142135
624
As per this the average of data is 25 which signifies that number of respondents are 50
and deviation is low in nature. Hence, mostly students of college come there for wish.
Do You Enjoy Your Academic Programmes ?
(a) Yes 30 (b) No 20
Mean 25
Median 25
Mode #VALUE!
Range 20 30
Standard 7.0710678
5
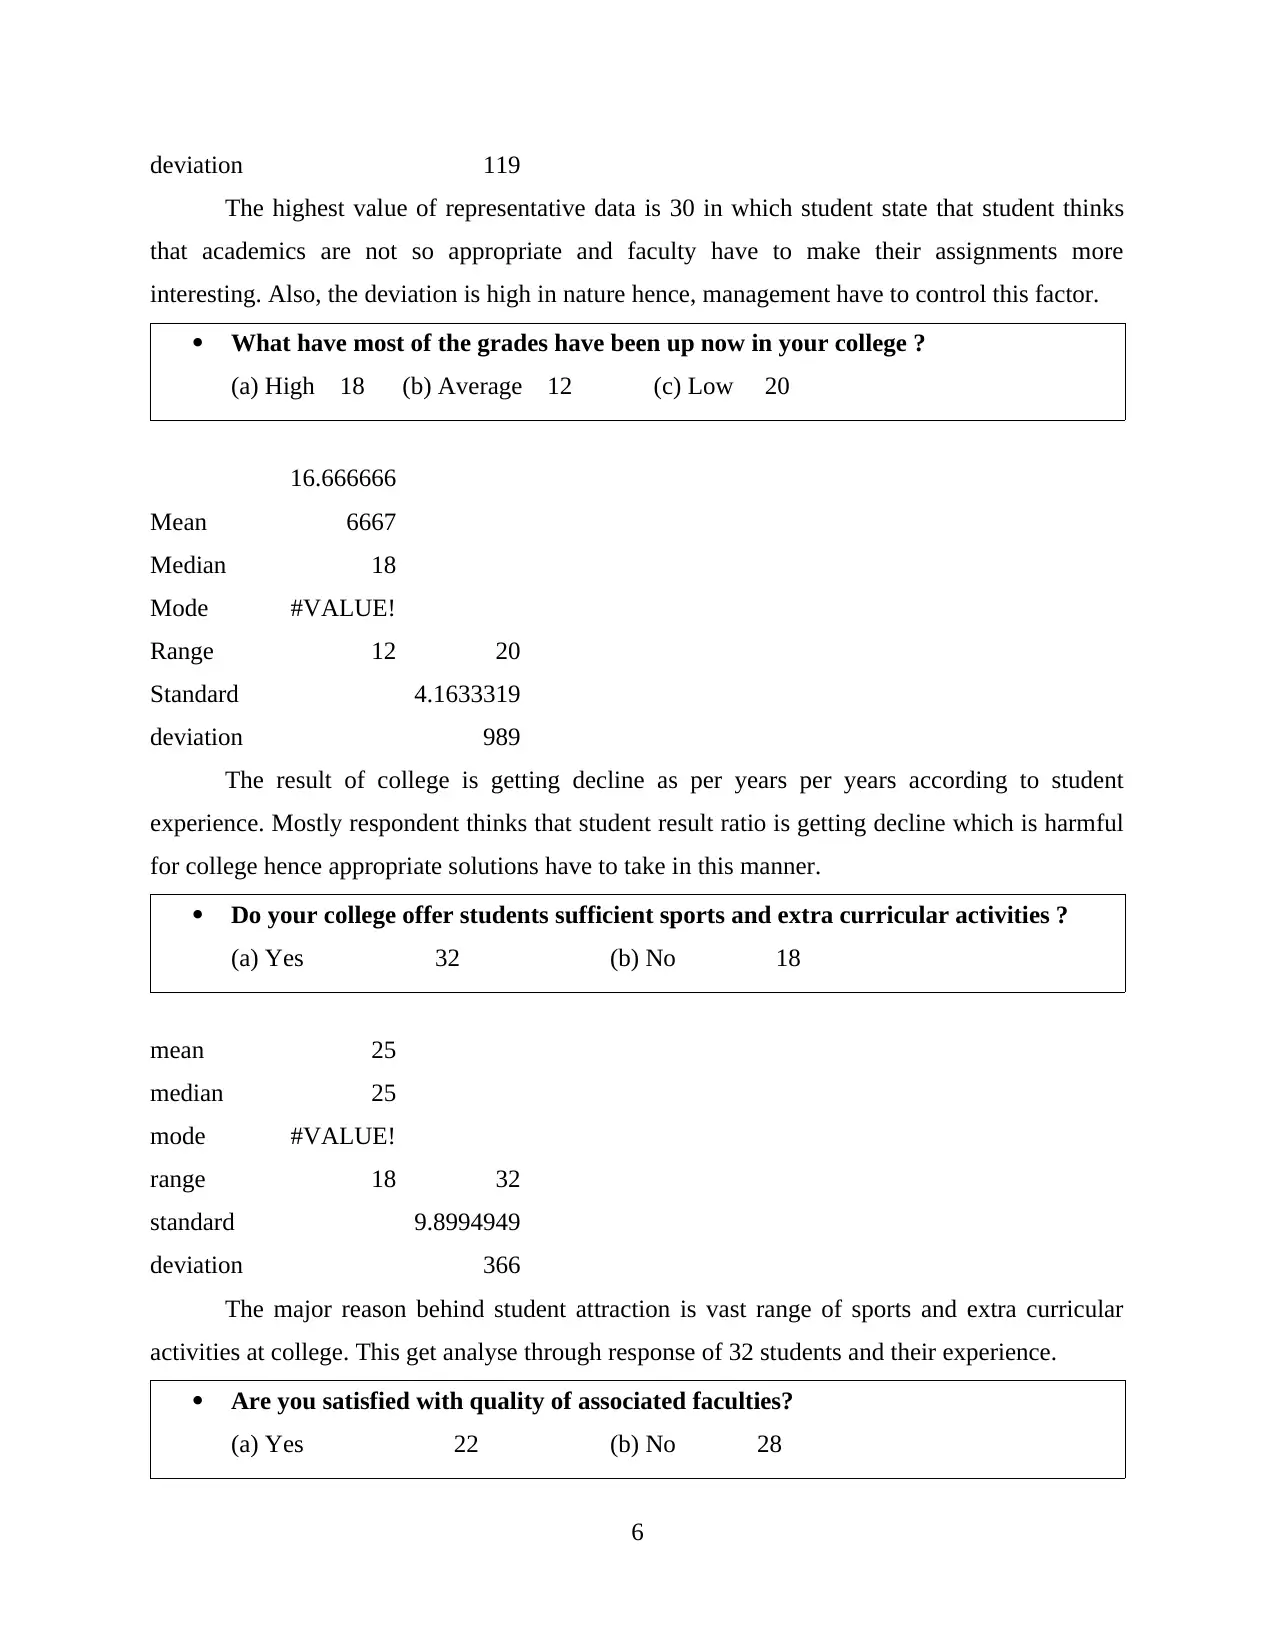
deviation 119
The highest value of representative data is 30 in which student state that student thinks
that academics are not so appropriate and faculty have to make their assignments more
interesting. Also, the deviation is high in nature hence, management have to control this factor.
What have most of the grades have been up now in your college ?
(a) High 18 (b) Average 12 (c) Low 20
Mean
16.666666
6667
Median 18
Mode #VALUE!
Range 12 20
Standard
deviation
4.1633319
989
The result of college is getting decline as per years per years according to student
experience. Mostly respondent thinks that student result ratio is getting decline which is harmful
for college hence appropriate solutions have to take in this manner.
Do your college offer students sufficient sports and extra curricular activities ?
(a) Yes 32 (b) No 18
mean 25
median 25
mode #VALUE!
range 18 32
standard
deviation
9.8994949
366
The major reason behind student attraction is vast range of sports and extra curricular
activities at college. This get analyse through response of 32 students and their experience.
Are you satisfied with quality of associated faculties?
(a) Yes 22 (b) No 28
6
⊘ This is a preview!⊘
Do you want full access?
Subscribe today to unlock all pages.
Trusted by 1+ million students worldwide
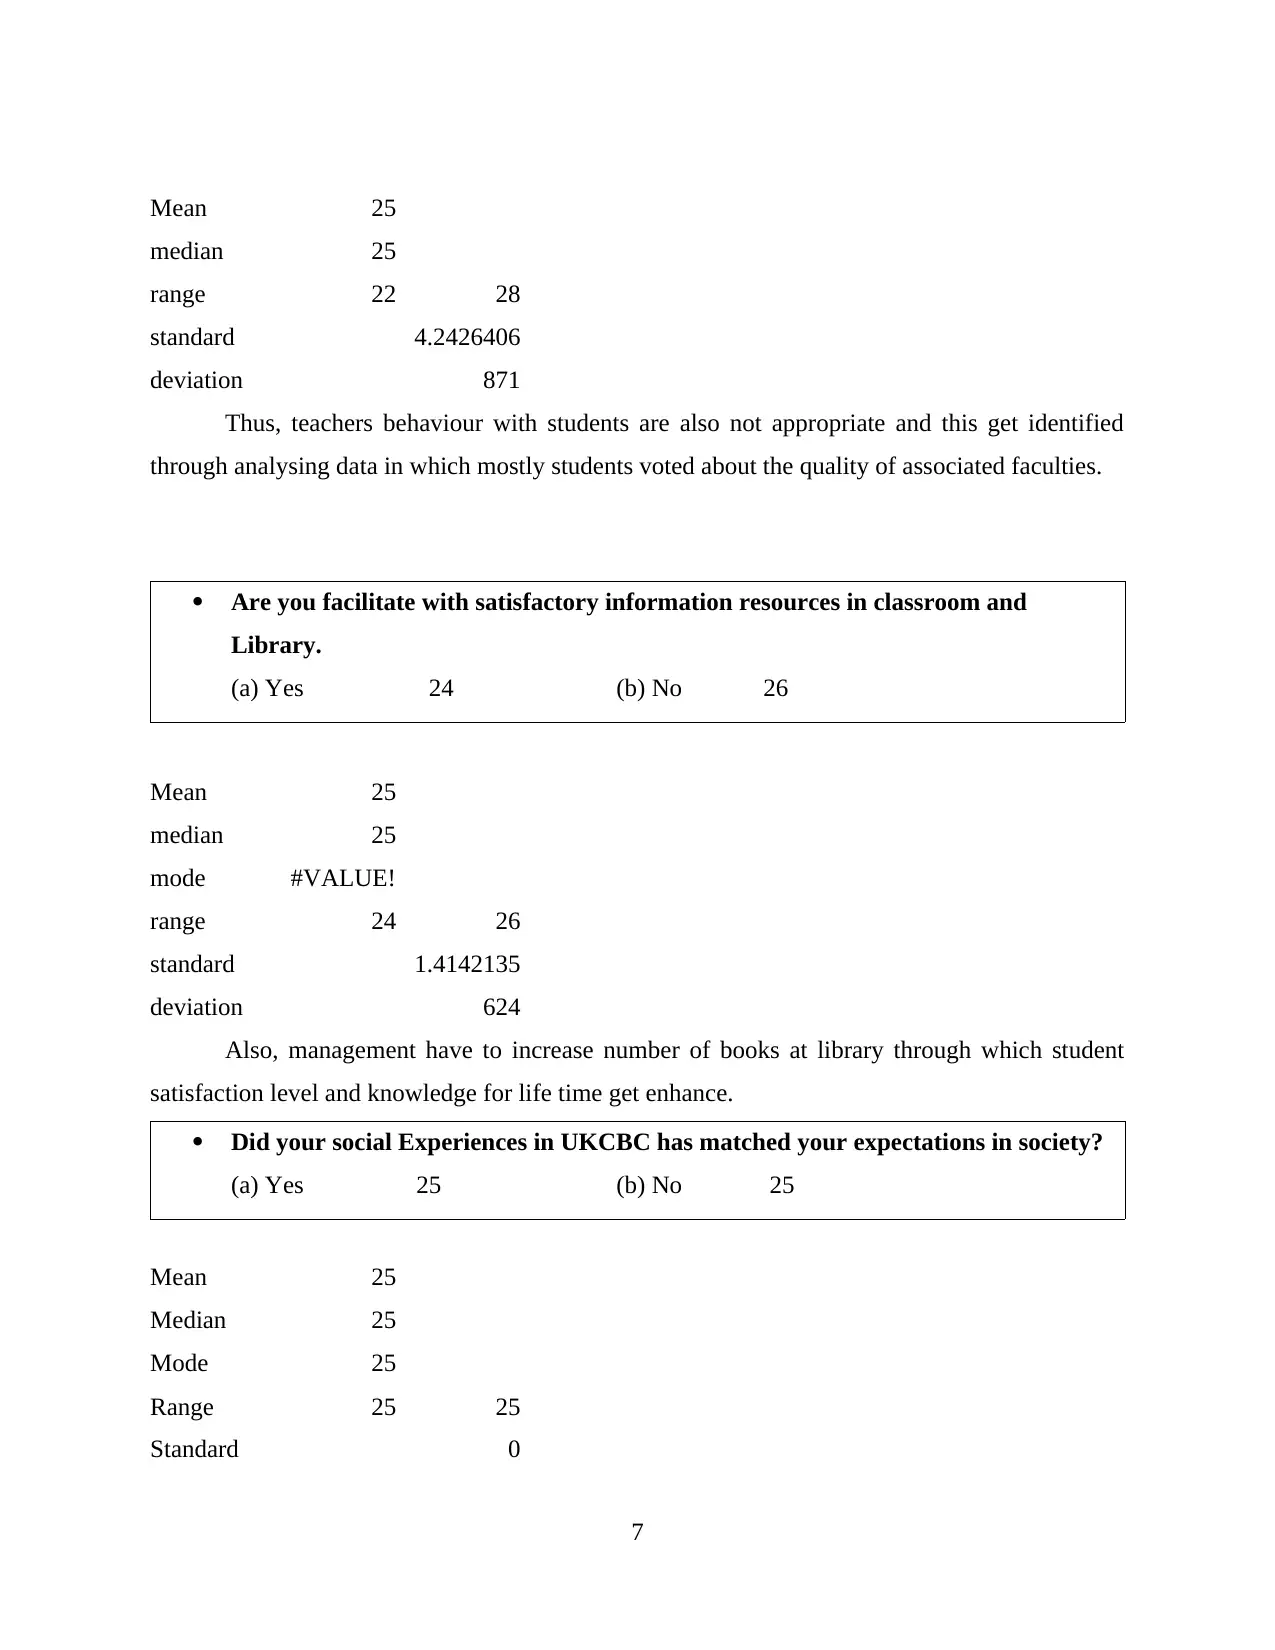
Mean 25
median 25
range 22 28
standard
deviation
4.2426406
871
Thus, teachers behaviour with students are also not appropriate and this get identified
through analysing data in which mostly students voted about the quality of associated faculties.
Are you facilitate with satisfactory information resources in classroom and
Library.
(a) Yes 24 (b) No 26
Mean 25
median 25
mode #VALUE!
range 24 26
standard
deviation
1.4142135
624
Also, management have to increase number of books at library through which student
satisfaction level and knowledge for life time get enhance.
Did your social Experiences in UKCBC has matched your expectations in society?
(a) Yes 25 (b) No 25
Mean 25
Median 25
Mode 25
Range 25 25
Standard 0
7
median 25
range 22 28
standard
deviation
4.2426406
871
Thus, teachers behaviour with students are also not appropriate and this get identified
through analysing data in which mostly students voted about the quality of associated faculties.
Are you facilitate with satisfactory information resources in classroom and
Library.
(a) Yes 24 (b) No 26
Mean 25
median 25
mode #VALUE!
range 24 26
standard
deviation
1.4142135
624
Also, management have to increase number of books at library through which student
satisfaction level and knowledge for life time get enhance.
Did your social Experiences in UKCBC has matched your expectations in society?
(a) Yes 25 (b) No 25
Mean 25
Median 25
Mode 25
Range 25 25
Standard 0
7
Paraphrase This Document
Need a fresh take? Get an instant paraphrase of this document with our AI Paraphraser
deviation
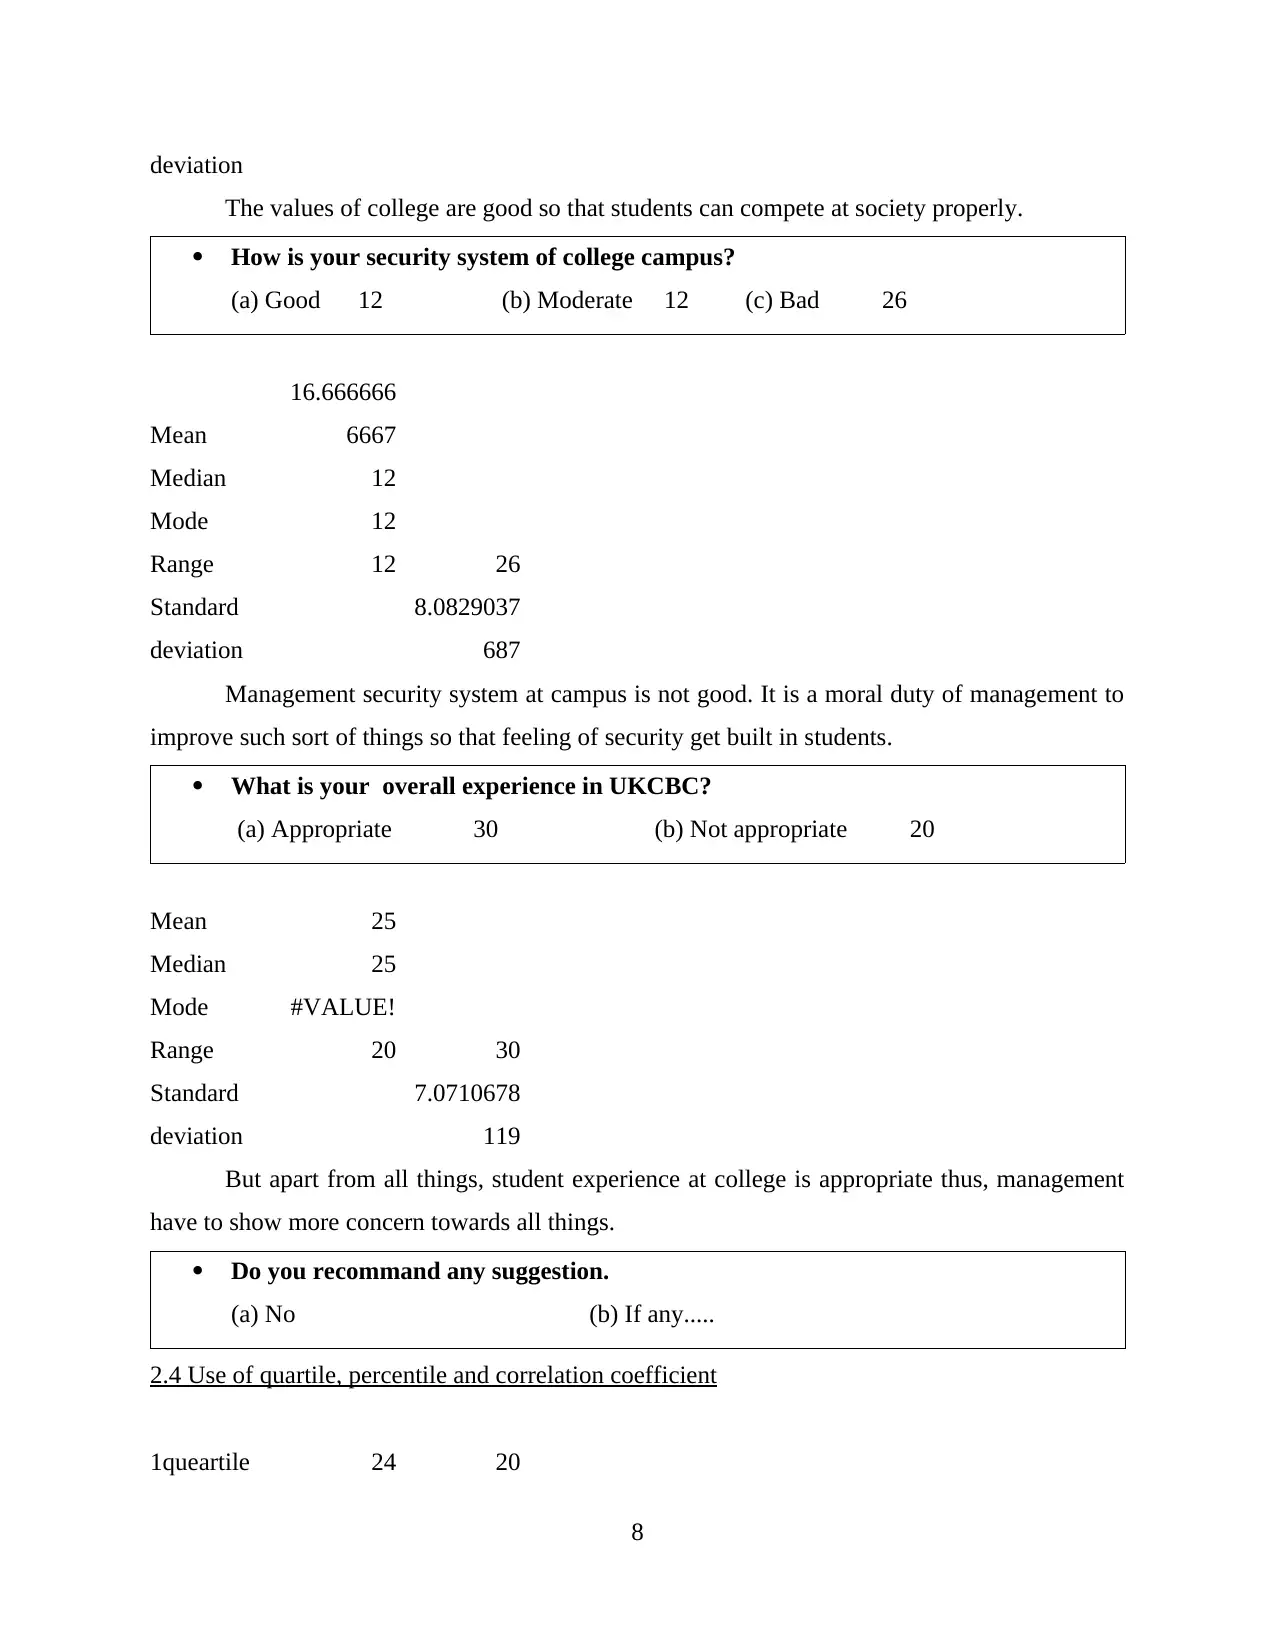
The values of college are good so that students can compete at society properly.
How is your security system of college campus?
(a) Good 12 (b) Moderate 12 (c) Bad 26
Mean
16.666666
6667
Median 12
Mode 12
Range 12 26
Standard
deviation
8.0829037
687
Management security system at campus is not good. It is a moral duty of management to
improve such sort of things so that feeling of security get built in students.
What is your overall experience in UKCBC?
(a) Appropriate 30 (b) Not appropriate 20
Mean 25
Median 25
Mode #VALUE!
Range 20 30
Standard
deviation
7.0710678
119
But apart from all things, student experience at college is appropriate thus, management
have to show more concern towards all things.
Do you recommand any suggestion.
(a) No (b) If any.....
2.4 Use of quartile, percentile and correlation coefficient
1queartile 24 20
8
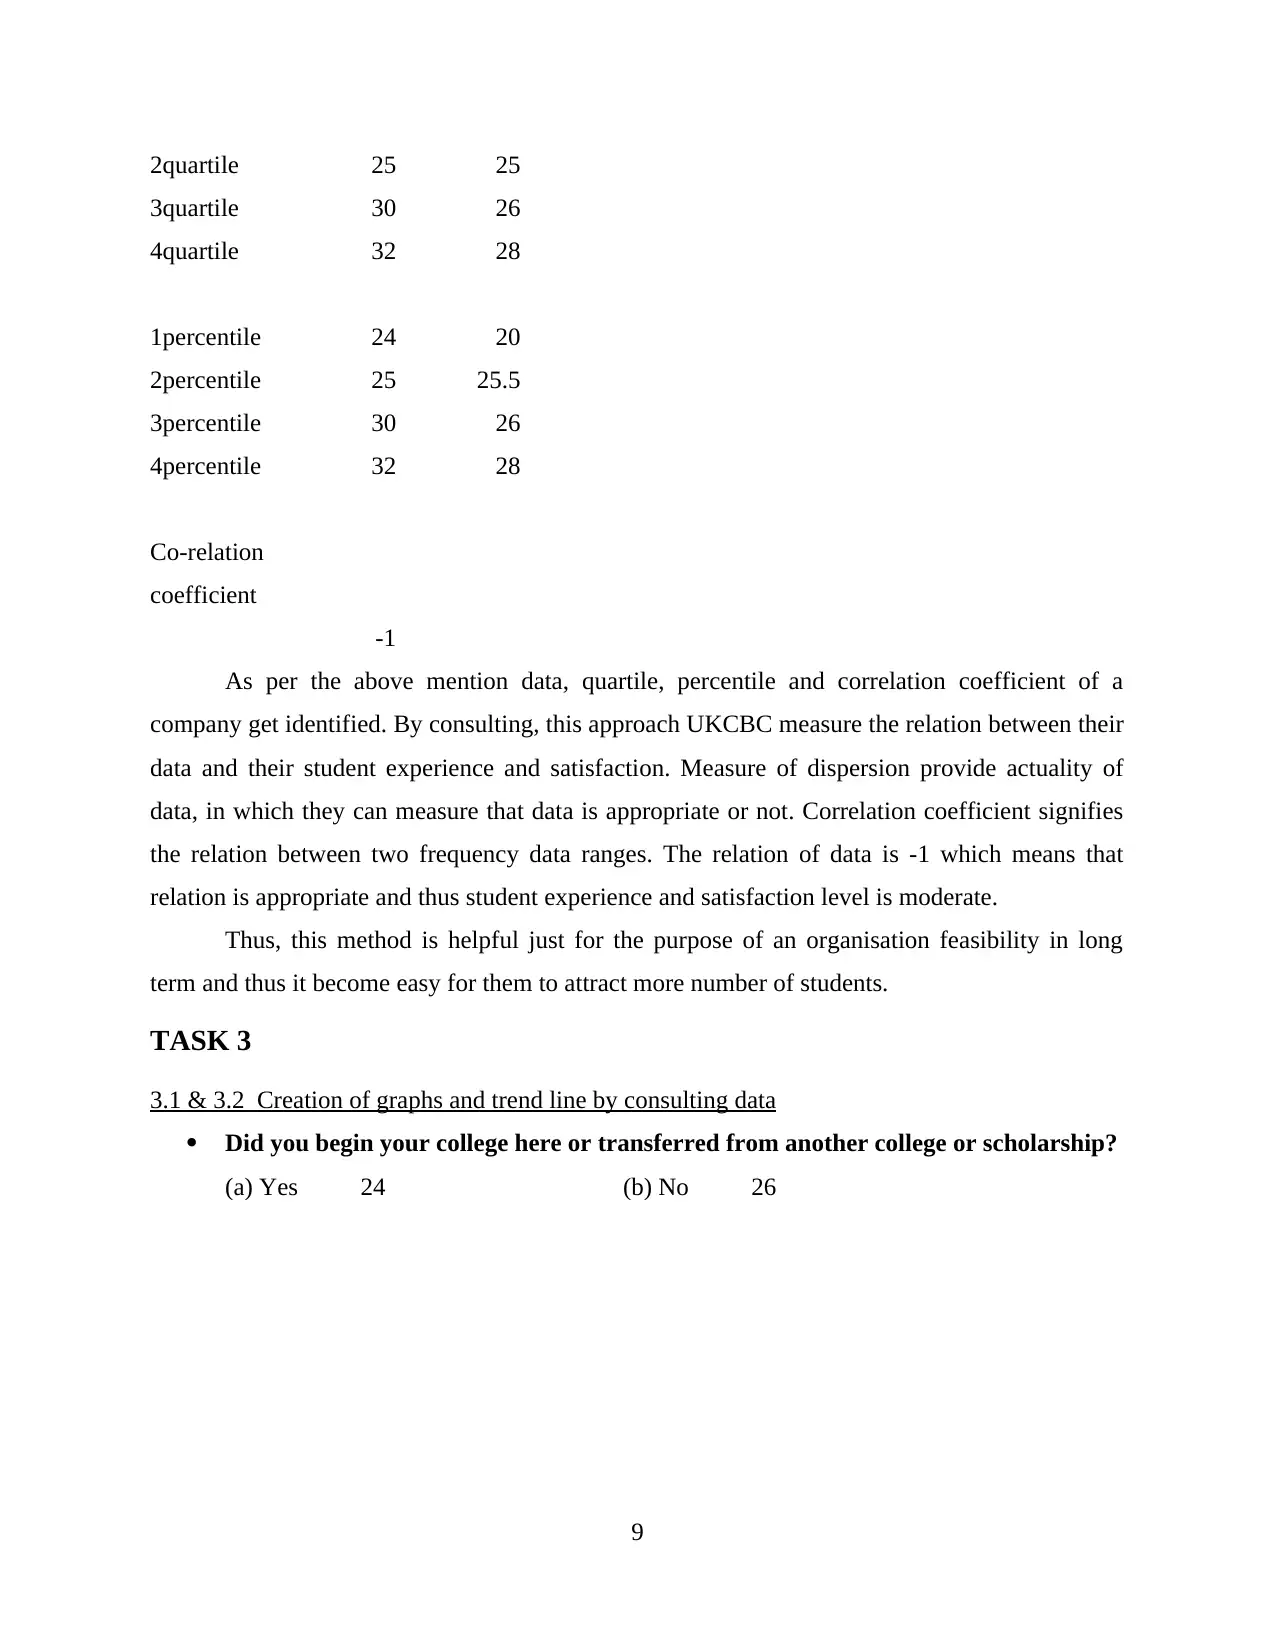
2quartile 25 25
3quartile 30 26
4quartile 32 28
1percentile 24 20
2percentile 25 25.5
3percentile 30 26
4percentile 32 28
Co-relation
coefficient
-1
As per the above mention data, quartile, percentile and correlation coefficient of a
company get identified. By consulting, this approach UKCBC measure the relation between their
data and their student experience and satisfaction. Measure of dispersion provide actuality of
data, in which they can measure that data is appropriate or not. Correlation coefficient signifies
the relation between two frequency data ranges. The relation of data is -1 which means that
relation is appropriate and thus student experience and satisfaction level is moderate.
Thus, this method is helpful just for the purpose of an organisation feasibility in long
term and thus it become easy for them to attract more number of students.
TASK 3
3.1 & 3.2 Creation of graphs and trend line by consulting data
Did you begin your college here or transferred from another college or scholarship?
(a) Yes 24 (b) No 26
9
⊘ This is a preview!⊘
Do you want full access?
Subscribe today to unlock all pages.
Trusted by 1+ million students worldwide
1 out of 21
Related Documents


Your All-in-One AI-Powered Toolkit for Academic Success.
+13062052269
info@desklib.com
Available 24*7 on WhatsApp / Email
![[object Object]](/_next/static/media/star-bottom.7253800d.svg)
Unlock your academic potential
Copyright © 2020–2026 A2Z Services. All Rights Reserved. Developed and managed by ZUCOL.