Analysis of UKCBC Student Experience and Satisfaction Report
VerifiedAdded on 2020/10/05
|42
|5353
|245
Report
AI Summary
This report presents a comprehensive analysis of UKCBC students' experiences and satisfaction levels, conducted to inform the Quality Assurance Agency (QAA). The research involved a detailed data collection plan, utilizing primary and secondary sources, including questionnaires distributed across multiple campuses. The methodology includes a survey-based approach with a structured questionnaire comprising closed-ended questions to gather student feedback on various aspects such as online services, course satisfaction, registration processes, administration, learning facilities, teaching methods, and teacher clarity. The collected data was evaluated using measures of central tendency and dispersion to draw important conclusions, which are presented through graphs and a formal business report. The findings indicate that students are generally satisfied with teaching methods and learning facilities, but they express concerns regarding registration and administrative processes. The report also includes project planning components, evaluating critical paths and decision-making tools to provide actionable insights for UKCBC to improve its operations and enhance student satisfaction.
Business Decision Making
Paraphrase This Document
Need a fresh take? Get an instant paraphrase of this document with our AI Paraphraser
Table of Contents
INTRODUCTION...........................................................................................................................3
TASK 1............................................................................................................................................4
1.1: Data collection plan by using various sources.....................................................................4
1.2: Research method and sampling framework ........................................................................5
1.3: Design a questionnaire for collecting information...............................................................6
TASK 2............................................................................................................................................8
2.1 Evaluation of data collected through research......................................................................8
2.2 Analysis of the result to draw important conclusions.........................................................11
2.3 Analysis of data using measures of dispersion...................................................................11
2.4 Use of quartile, percentiles and correlation coefficient to draw important conclusions.....13
TASK 3..........................................................................................................................................14
3.1 Presentation of graphs to interpret information..................................................................14
3.2 Trend Line...........................................................................................................................21
3.3 Findings of QAA planning..................................................................................................23
...................................................................................................................................................23
3.4 Formal business report........................................................................................................38
TASK 4..........................................................................................................................................39
4.1 Information processing tools...............................................................................................39
4.2 Evaluation of critical path ..................................................................................................40
4.3 Financial tools for decision-making....................................................................................41
CONCLUSION..............................................................................................................................42
REFERENCES ............................................................................................................................43
INTRODUCTION
Business decision making is one of the essential course of action that is used by the
organisation to attain their aims and objectives. It is continuous and indispensable element of
managing any business operations that are performed within an organisation. The main purpose
of this project report is to conduct an effective research work and present a report on UKCBC’s
Students experience and satisfaction to the QAA. This research is consisting of data collection
plan from across all campuses. Use of survey methodology and sampling design to determine
student’s responses.
On the basis of data collected from the research, it is analysing to draw valid conclusion in
the business context. Apart from this, analysis of data through using measure of dispersion to
inform UKCBC is done accordingly. Certain charts and graphs is also being taken into account
to evaluate the collected data. After summarising all the information from the research a well
organises formal business report that will be shown to QAA. At the end of this report, a project
plan is being made to check the total time an activity is taken to get finished (Groebner, 2011).
TASK 1
1.1: Data collection plan by using various sources
In order to make any specific research, it is essential for the researcher to select suitable
data collection method so that chances of errors cannot be occur. It is detail document that
describe the exact process as well as sequence that is required to be implemented while
collecting information from the students of UKCBC. It is vital for the researcher to use
systematic process of data collection that is helpful for attaining desirable information from the
selected samples. The researcher need to collect primary and secondary data for the objective of
collecting needed information that can assist them in effective decision making (Vercellis, 2014).
Primary research: It refers as that data which will be collected for the initial time by the
effective effort of investigator. Such kind of information is free from any bias as it is directly
taken from the respondent. This particular types of research method are being carried out to
⊘ This is a preview!⊘
Do you want full access?
Subscribe today to unlock all pages.
Trusted by 1+ million students worldwide
provide answer of certain issues. There are various crucial components that is taken into account
for conducting primary research. Some of them are mentioned underneath:
Questionnaire: It is one of effective data collection method, it could be in any form such
as structured or unstructured. The Students of UKCBC have to provide their personal
experiences and satisfaction level they think is being provided to them by the college.
Survey: It is said to be face to face communication with the students and gathered
essential aspects and reviews those are been provided by UKCBC to them. It is more systematic
measurement of overall perception of the students.
Interviews: It is basically done through meeting face to face with the students of
UKCBC college. By this, researcher would need to make more reliable outcomes about their
overall experiences they have observed while learning in UKCBC.
Online: This method is considered as the fastest mode of data collection through various
mediums such as social media tools. According to the current scenario, modes like social and
digital media helps in gathering cost and time effective data.
Secondary sources: These are known as reliable data collection method which is being
used by the researcher to make comparison of present data to that with the past one. It is already
published data which is collected from various sources such as articles, newspapers, journals and
articles (Pettigrew, 2014).
Under this, researcher is required to utilise primary research methods such as
questionnaire which will help in collect information from various students. The main fours
campuses taken into account for this research is given underneath:
a) Park Royal campus
b) Wentworth House campus
c) Lords House campus
d) Oxford Street campus
1.2: Research method and sampling framework
Survey is entirely based on analysing students experience and their satisfaction they carry
while learning in UKCBC college. The researcher is going to evaluate the perception as well as
their opinion through conducting effective plan and framework. Research method is basically
said to be effective terms that can be taken into account for the purpose of attaining aims and
objectives of the survey. Data which is gathered using questionnaire is highly confidential and is
Paraphrase This Document
Need a fresh take? Get an instant paraphrase of this document with our AI Paraphraser
not disclosed to college or any other individual. Generally, such kind of research method helps
the research to find out actual outcomes of this particular research. Some crucial types are:
Descriptive vs analytical: It includes research and facts of different kind of problems.
This can be obtaining data concerning the present condition of the students. While, analytical
approaches can be uses all those facts or information that has been already being presented and
analyse outcomes to make vital evaluation of collected material (Zsambok and Klein, 2014).
Qualitative vs quantitative method: In accordance to make effective measurement of
total quantity or value of outcome taken from the students reviews quantitative methods is being
used. While, the qualitative approach is used to analyse quality of answers students have
provided during the research work.
Sampling methods: In respect to determine overall results in effective ways, it is required
to gathered some samples from the chosen group of students from various campuses. These can
be divided into various parts. Some of them are:
Random sampling: Such kind of tools and techniques is being utilise from a given
population in the ways that provide each people equal opportunity of being selected. It is
considered as more accurate. Researcher is using the technique of random sampling to
gain the benefit of cost effectiveness. (Random Sampling, 2017).
There are certain other methods and techniques which will be used in research work like,
Quota, stratified, cluster sampling and many more. The total of 50 respondents is being taken
into account out of selected student population. Some vital aspects that are covered in the
questionnaire form are given below:
Learning techniques
Safety and security
Behaviour of faculty staffs
Extra activities deliver to the students.
1.3: Design a questionnaire for collecting information
Questionnaire is a structured form which consists formalised set of questions which are
designed to collect information on a specific topic or subject. This is considered as the most
suitable technique for data collection from primary sources. Questions present in the document
are needed to be answered by a respondent. This document can be in written or oral form.
Kind of questionnaire:
Questionnaire can be of various types and are used according to the kind of information.
These questionnaire are majorly classified into two classes open ended and close ended. In this
research report, close ended questionnaire is used which has options to choose from. Some other
types of questionnaires are rating scale, likert type scale, semantic differential, multiple choice,
rank order and others.
Importance of questionnaire:
Questionnaires are considered as the most significant method of primary data collection
as it is less time consuming and highly accurate. Using this technique, a researcher can attain
personal experience and recommendations of the respondents by involving low cost. This
method helps in generating large amount of data and also has various ways of administration.
This method also helps in generating answers for questions which has sensitive topics as this
document can be answered privately. Respondents can answer these questions effectively as they
have ample of suitable time to fill the questionnaire form and those answers can be easily
quantified and analysed using evaluation techniques. This technique uses easy format which is
understandable by all the respondents (Quanyu, 2014).
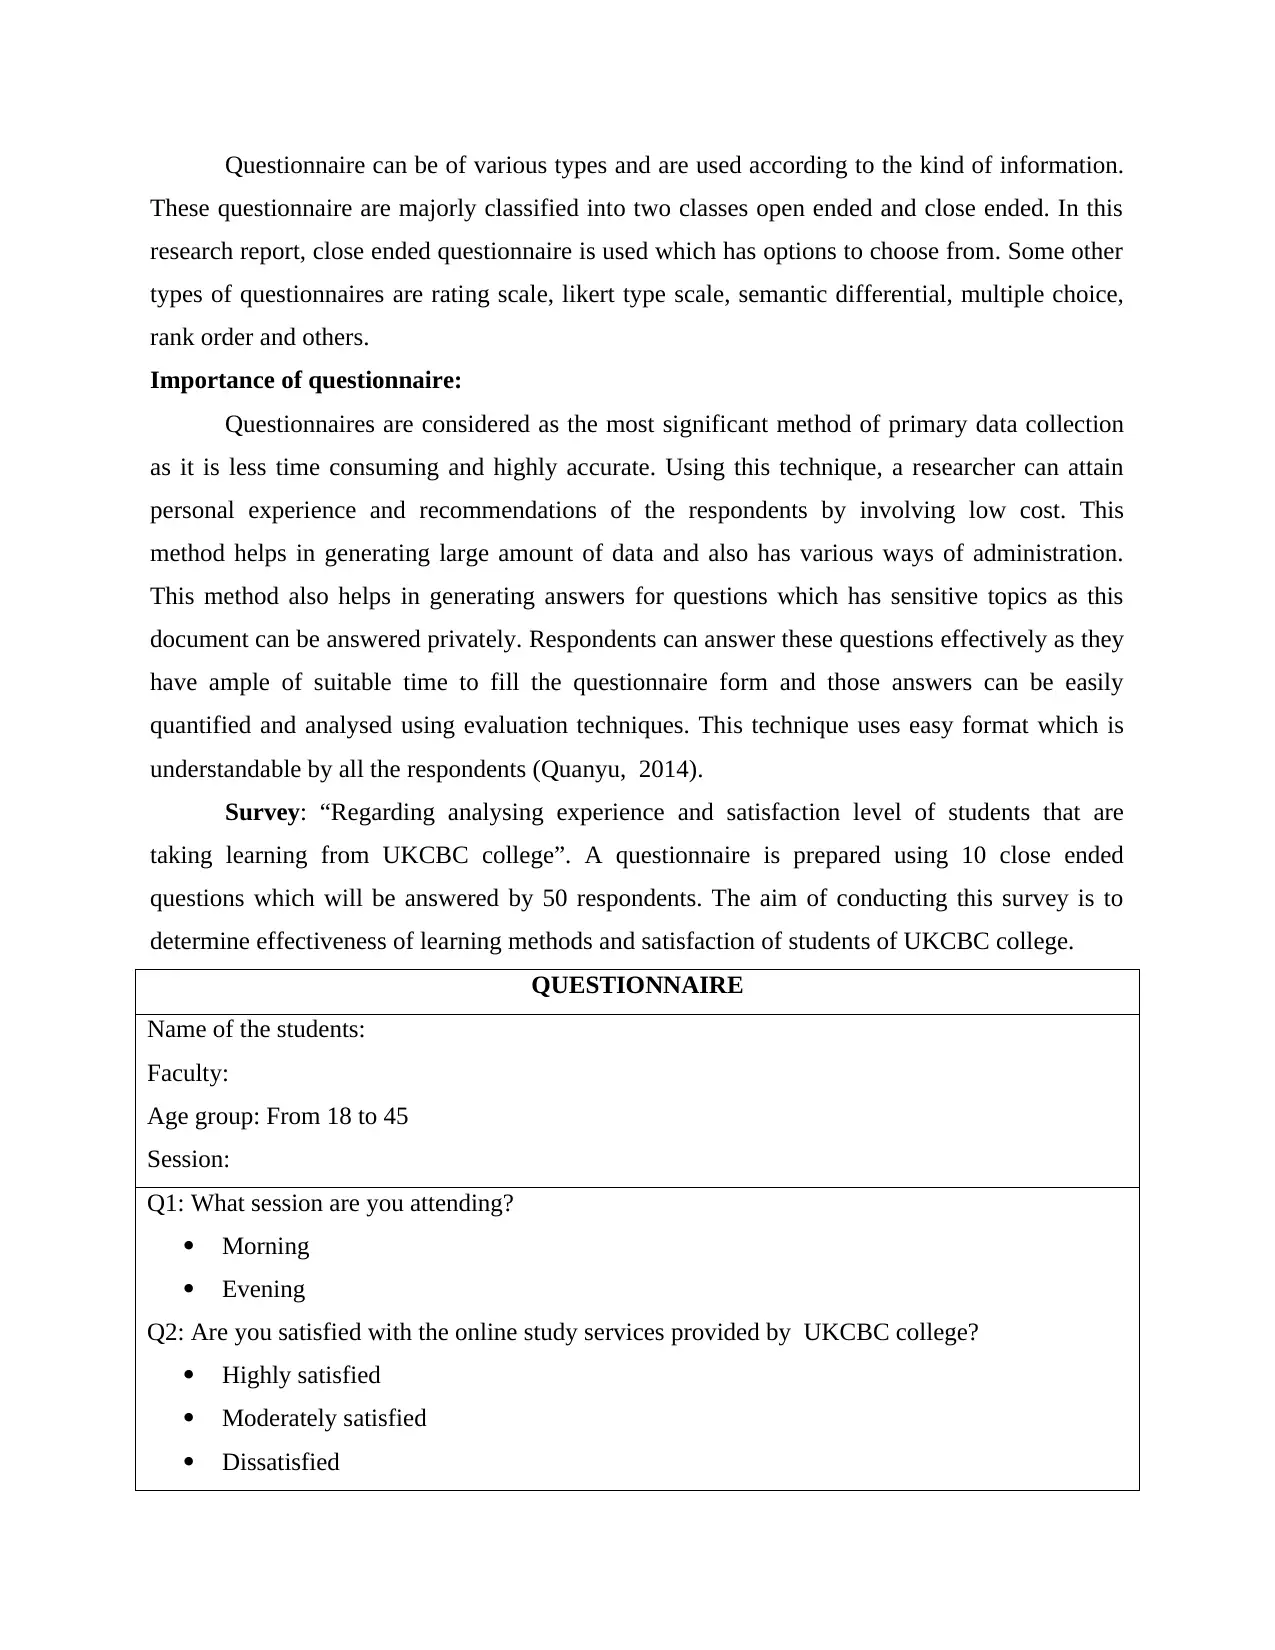
Survey: “Regarding analysing experience and satisfaction level of students that are
taking learning from UKCBC college”. A questionnaire is prepared using 10 close ended
questions which will be answered by 50 respondents. The aim of conducting this survey is to
determine effectiveness of learning methods and satisfaction of students of UKCBC college.
QUESTIONNAIRE
Name of the students:
Faculty:
Age group: From 18 to 45
Session:
Q1: What session are you attending?
Morning
Evening
Q2: Are you satisfied with the online study services provided by UKCBC college?
Highly satisfied
Moderately satisfied
Dissatisfied
These questionnaire are majorly classified into two classes open ended and close ended. In this
research report, close ended questionnaire is used which has options to choose from. Some other
types of questionnaires are rating scale, likert type scale, semantic differential, multiple choice,
rank order and others.
Importance of questionnaire:
Questionnaires are considered as the most significant method of primary data collection
as it is less time consuming and highly accurate. Using this technique, a researcher can attain
personal experience and recommendations of the respondents by involving low cost. This
method helps in generating large amount of data and also has various ways of administration.
This method also helps in generating answers for questions which has sensitive topics as this
document can be answered privately. Respondents can answer these questions effectively as they
have ample of suitable time to fill the questionnaire form and those answers can be easily
quantified and analysed using evaluation techniques. This technique uses easy format which is
understandable by all the respondents (Quanyu, 2014).
Survey: “Regarding analysing experience and satisfaction level of students that are
taking learning from UKCBC college”. A questionnaire is prepared using 10 close ended
questions which will be answered by 50 respondents. The aim of conducting this survey is to
determine effectiveness of learning methods and satisfaction of students of UKCBC college.
QUESTIONNAIRE
Name of the students:
Faculty:
Age group: From 18 to 45
Session:
Q1: What session are you attending?
Morning
Evening
Q2: Are you satisfied with the online study services provided by UKCBC college?
Highly satisfied
Moderately satisfied
Dissatisfied
⊘ This is a preview!⊘
Do you want full access?
Subscribe today to unlock all pages.
Trusted by 1+ million students worldwide
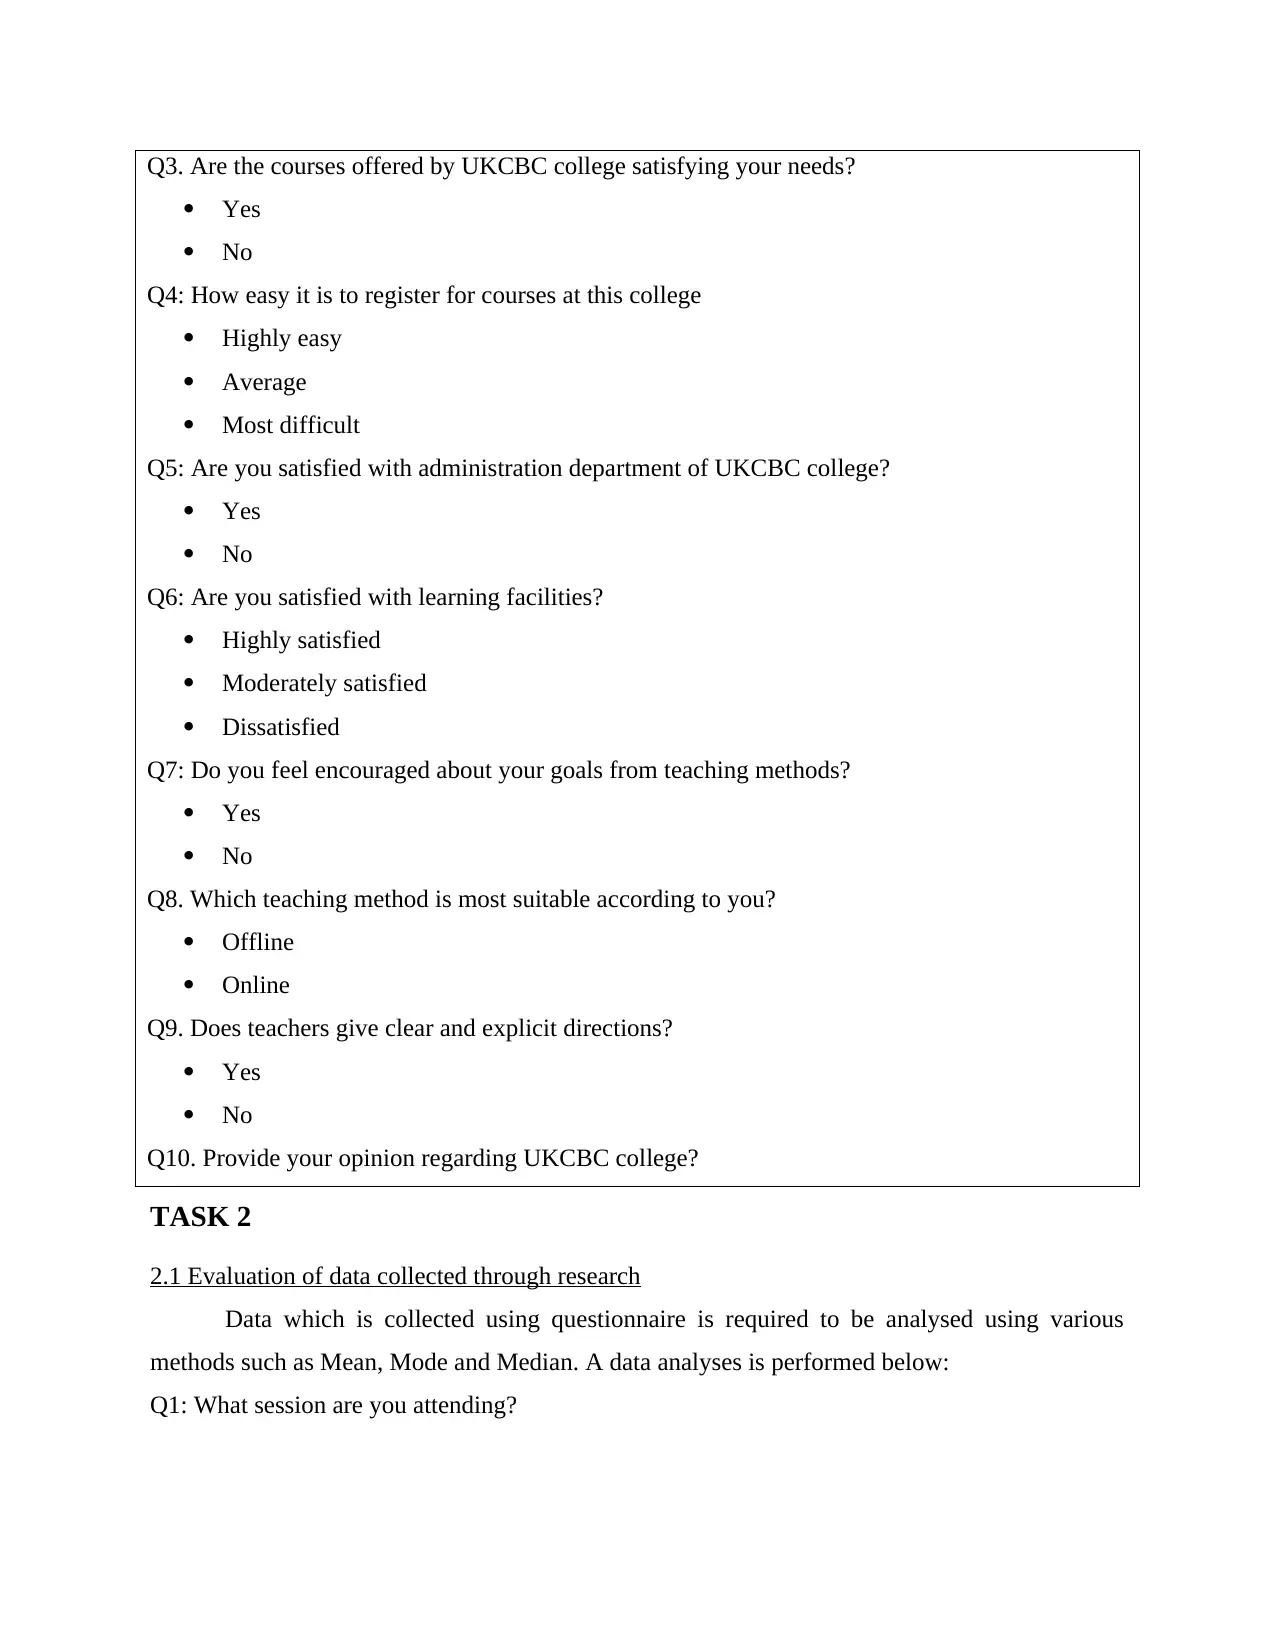
Q3. Are the courses offered by UKCBC college satisfying your needs?
Yes
No
Q4: How easy it is to register for courses at this college
Highly easy
Average
Most difficult
Q5: Are you satisfied with administration department of UKCBC college?
Yes
No
Q6: Are you satisfied with learning facilities?
Highly satisfied
Moderately satisfied
Dissatisfied
Q7: Do you feel encouraged about your goals from teaching methods?
Yes
No
Q8. Which teaching method is most suitable according to you?
Offline
Online
Q9. Does teachers give clear and explicit directions?
Yes
No
Q10. Provide your opinion regarding UKCBC college?
TASK 2
2.1 Evaluation of data collected through research
Data which is collected using questionnaire is required to be analysed using various
methods such as Mean, Mode and Median. A data analyses is performed below:
Q1: What session are you attending?
Yes
No
Q4: How easy it is to register for courses at this college
Highly easy
Average
Most difficult
Q5: Are you satisfied with administration department of UKCBC college?
Yes
No
Q6: Are you satisfied with learning facilities?
Highly satisfied
Moderately satisfied
Dissatisfied
Q7: Do you feel encouraged about your goals from teaching methods?
Yes
No
Q8. Which teaching method is most suitable according to you?
Offline
Online
Q9. Does teachers give clear and explicit directions?
Yes
No
Q10. Provide your opinion regarding UKCBC college?
TASK 2
2.1 Evaluation of data collected through research
Data which is collected using questionnaire is required to be analysed using various
methods such as Mean, Mode and Median. A data analyses is performed below:
Q1: What session are you attending?
Paraphrase This Document
Need a fresh take? Get an instant paraphrase of this document with our AI Paraphraser
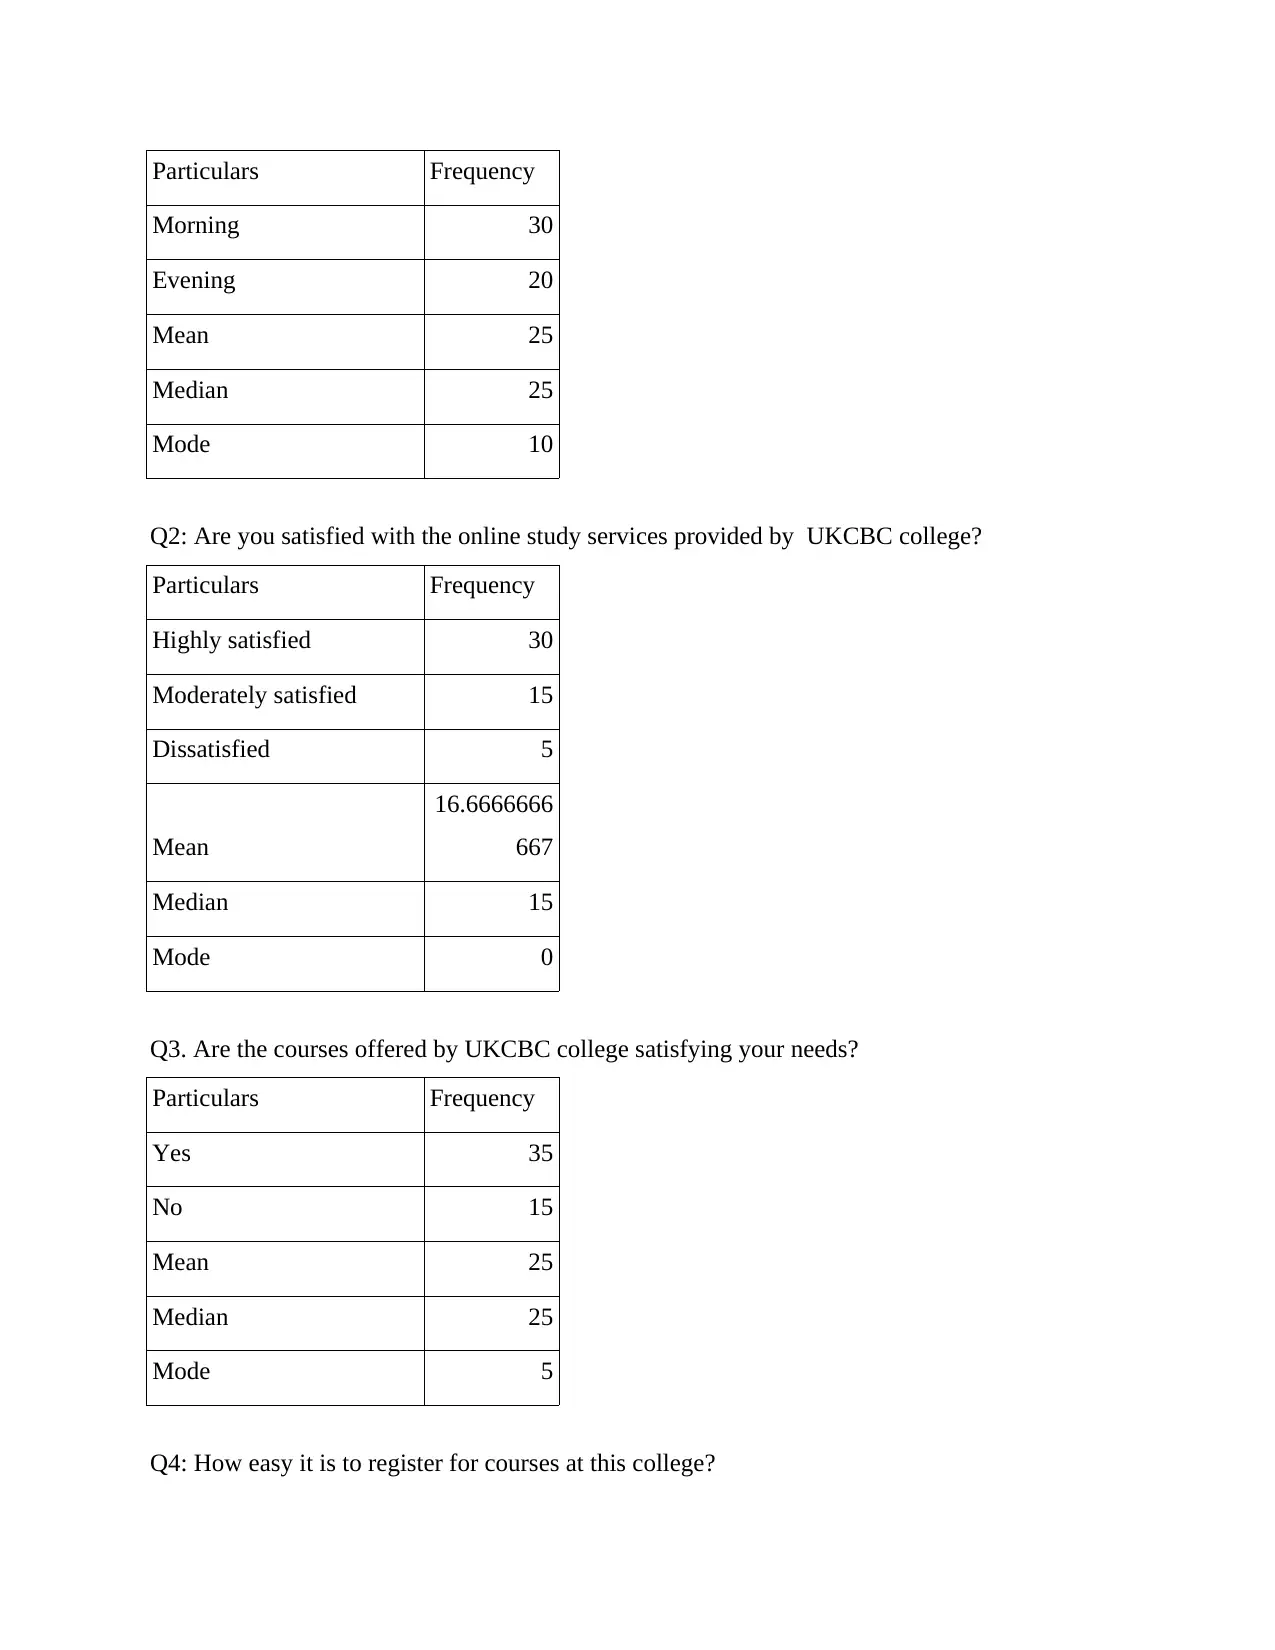
Particulars Frequency
Morning 30
Evening 20
Mean 25
Median 25
Mode 10
Q2: Are you satisfied with the online study services provided by UKCBC college?
Particulars Frequency
Highly satisfied 30
Moderately satisfied 15
Dissatisfied 5
Mean
16.6666666
667
Median 15
Mode 0
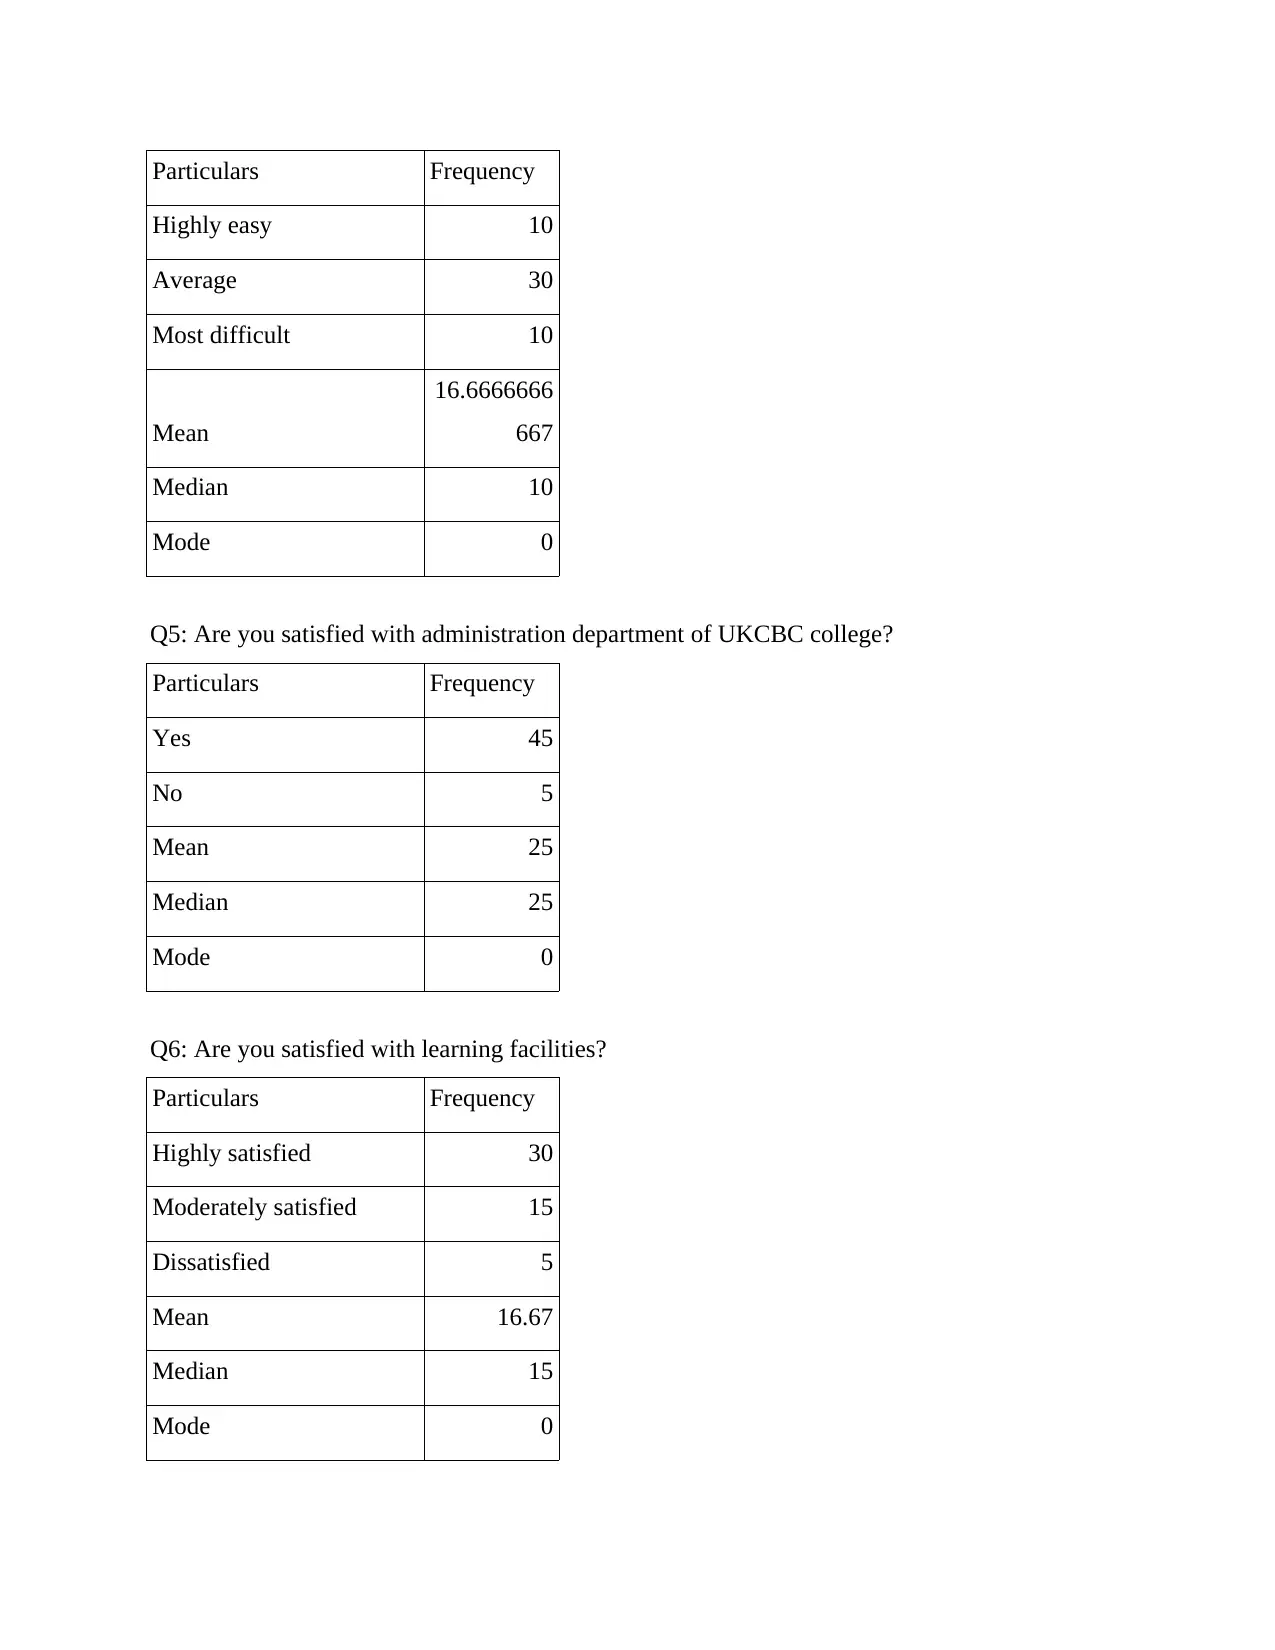
Q3. Are the courses offered by UKCBC college satisfying your needs?
Particulars Frequency
Yes 35
No 15
Mean 25
Median 25
Mode 5
Q4: How easy it is to register for courses at this college?
Morning 30
Evening 20
Mean 25
Median 25
Mode 10
Q2: Are you satisfied with the online study services provided by UKCBC college?
Particulars Frequency
Highly satisfied 30
Moderately satisfied 15
Dissatisfied 5
Mean
16.6666666
667
Median 15
Mode 0
Q3. Are the courses offered by UKCBC college satisfying your needs?
Particulars Frequency
Yes 35
No 15
Mean 25
Median 25
Mode 5
Q4: How easy it is to register for courses at this college?
Particulars Frequency
Highly easy 10
Average 30
Most difficult 10
Mean
16.6666666
667
Median 10
Mode 0
Q5: Are you satisfied with administration department of UKCBC college?
Particulars Frequency
Yes 45
No 5
Mean 25
Median 25
Mode 0
Q6: Are you satisfied with learning facilities?
Particulars Frequency
Highly satisfied 30
Moderately satisfied 15
Dissatisfied 5
Mean 16.67
Median 15
Mode 0
⊘ This is a preview!⊘
Do you want full access?
Subscribe today to unlock all pages.
Trusted by 1+ million students worldwide
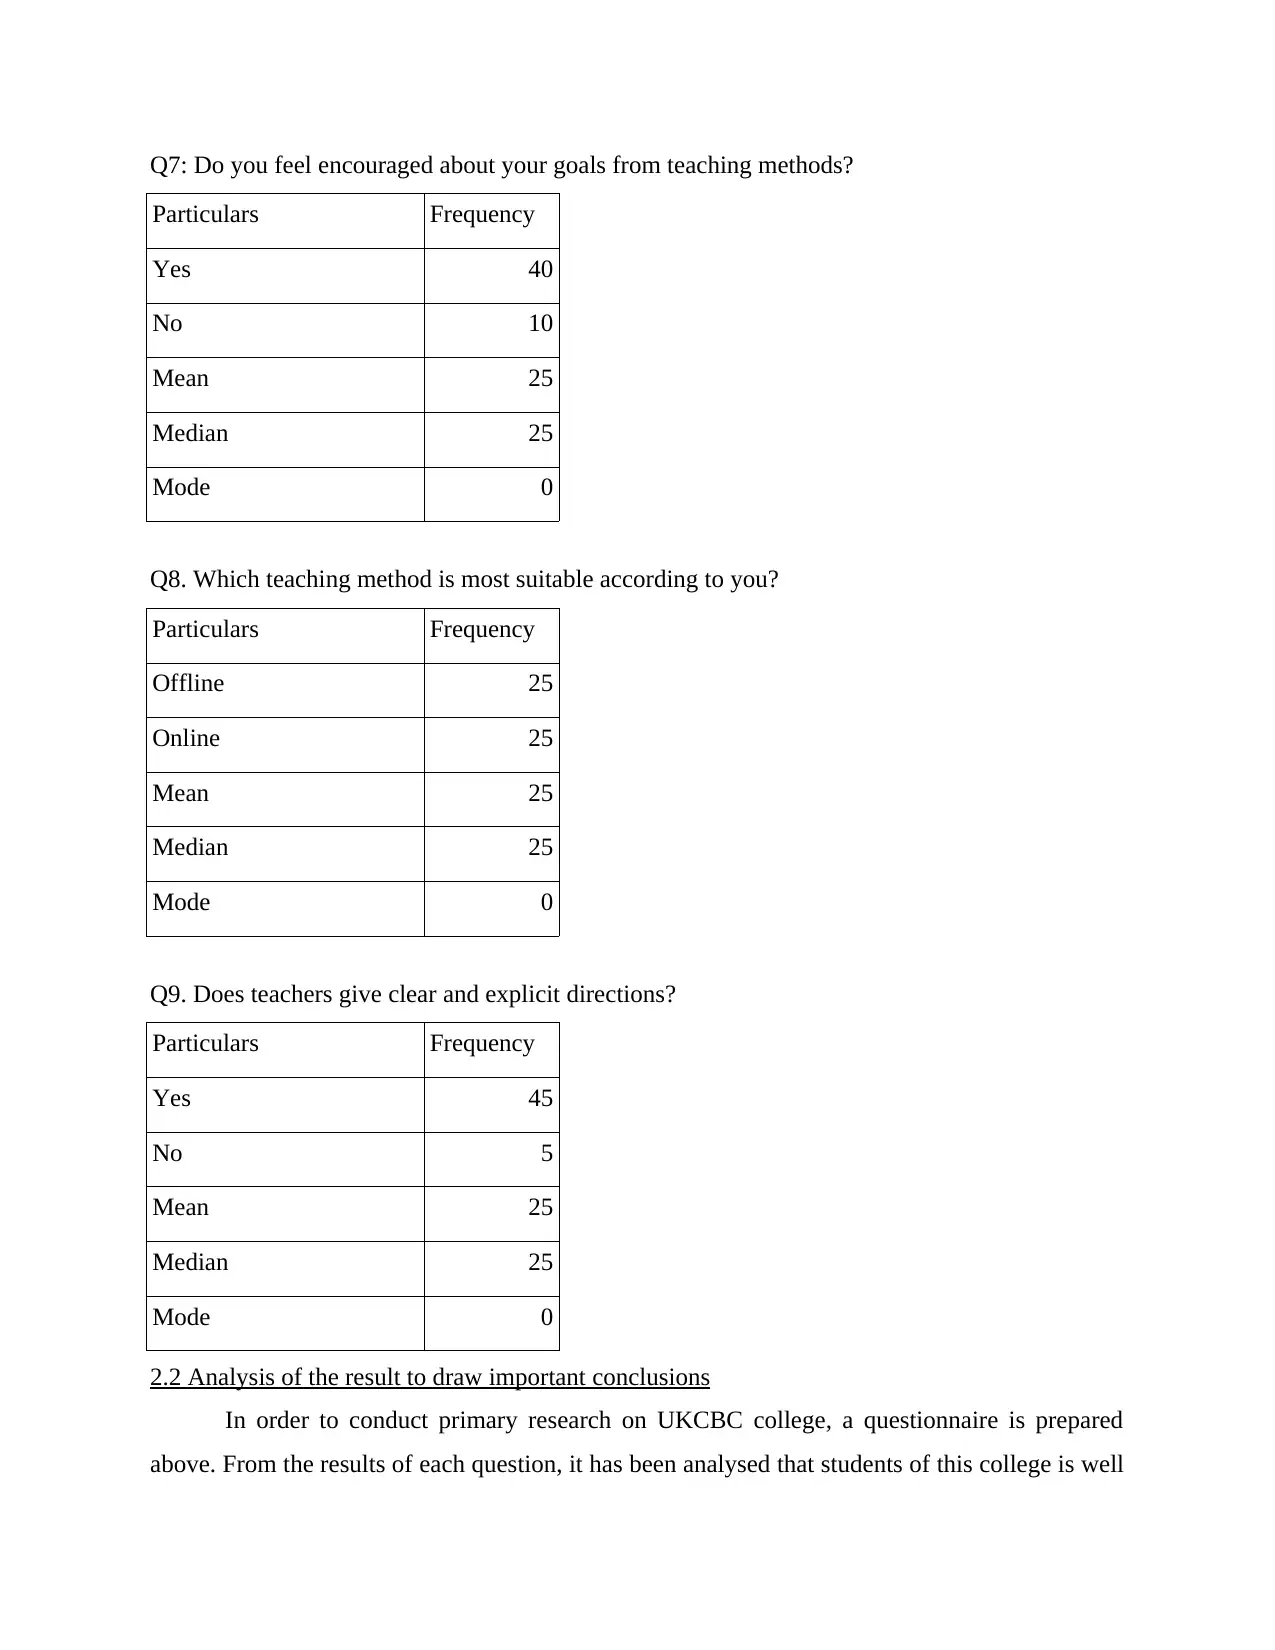
Q7: Do you feel encouraged about your goals from teaching methods?
Particulars Frequency
Yes 40
No 10
Mean 25
Median 25
Mode 0
Q8. Which teaching method is most suitable according to you?
Particulars Frequency
Offline 25
Online 25
Mean 25
Median 25
Mode 0
Q9. Does teachers give clear and explicit directions?
Particulars Frequency
Yes 45
No 5
Mean 25
Median 25
Mode 0
2.2 Analysis of the result to draw important conclusions
In order to conduct primary research on UKCBC college, a questionnaire is prepared
above. From the results of each question, it has been analysed that students of this college is well
Particulars Frequency
Yes 40
No 10
Mean 25
Median 25
Mode 0
Q8. Which teaching method is most suitable according to you?
Particulars Frequency
Offline 25
Online 25
Mean 25
Median 25
Mode 0
Q9. Does teachers give clear and explicit directions?
Particulars Frequency
Yes 45
No 5
Mean 25
Median 25
Mode 0
2.2 Analysis of the result to draw important conclusions
In order to conduct primary research on UKCBC college, a questionnaire is prepared
above. From the results of each question, it has been analysed that students of this college is well
Paraphrase This Document
Need a fresh take? Get an instant paraphrase of this document with our AI Paraphraser
satisfied with the teachers and learning methods but are face issuing regarding registration and
administration activities. In this case scenario, information which is gathered by respondents can
be used in decision-making process by UKCBC college regarding improvement in their
operations. Three measures are used in this report to analyse and interpret the data. These
measures are discussed below:
Mean – Mean is the arithmetical average of a range of values which are often known as
frequencies. This can be computed by calculating average of all the values, for example in
question 1, frequencies were 30 and 20 and their average can be ascertained by adding all the
values and dividing them with the number of frequencies that is 2. So mean of this question is
20+30/2 = 25.
Median – This measures calculates the mid point of all the frequencies. Median is the
middle value of the range of data. Median can be calculated by ascertaining mid points of both
odd and even values. For example, In question two, there are three frequencies and that is 30, 15
and 5 and there median is calculated as 15.
Mode – Mode is referred as the most common frequency which occurs repetitively in the
range of the data. In a series of information, chances of having a mode value is equal. Any series
which has two mode values is referred as bimodal series and if there is more than two modes
then the data is refereed as multimodal series. For example in question 3, there are three
frequencies that is 35, 15 and 5 and they most common number which is occurring in all the
frequencies is 5.
All the above measures are used in this research report to better analyse the position of
UKCBC college.
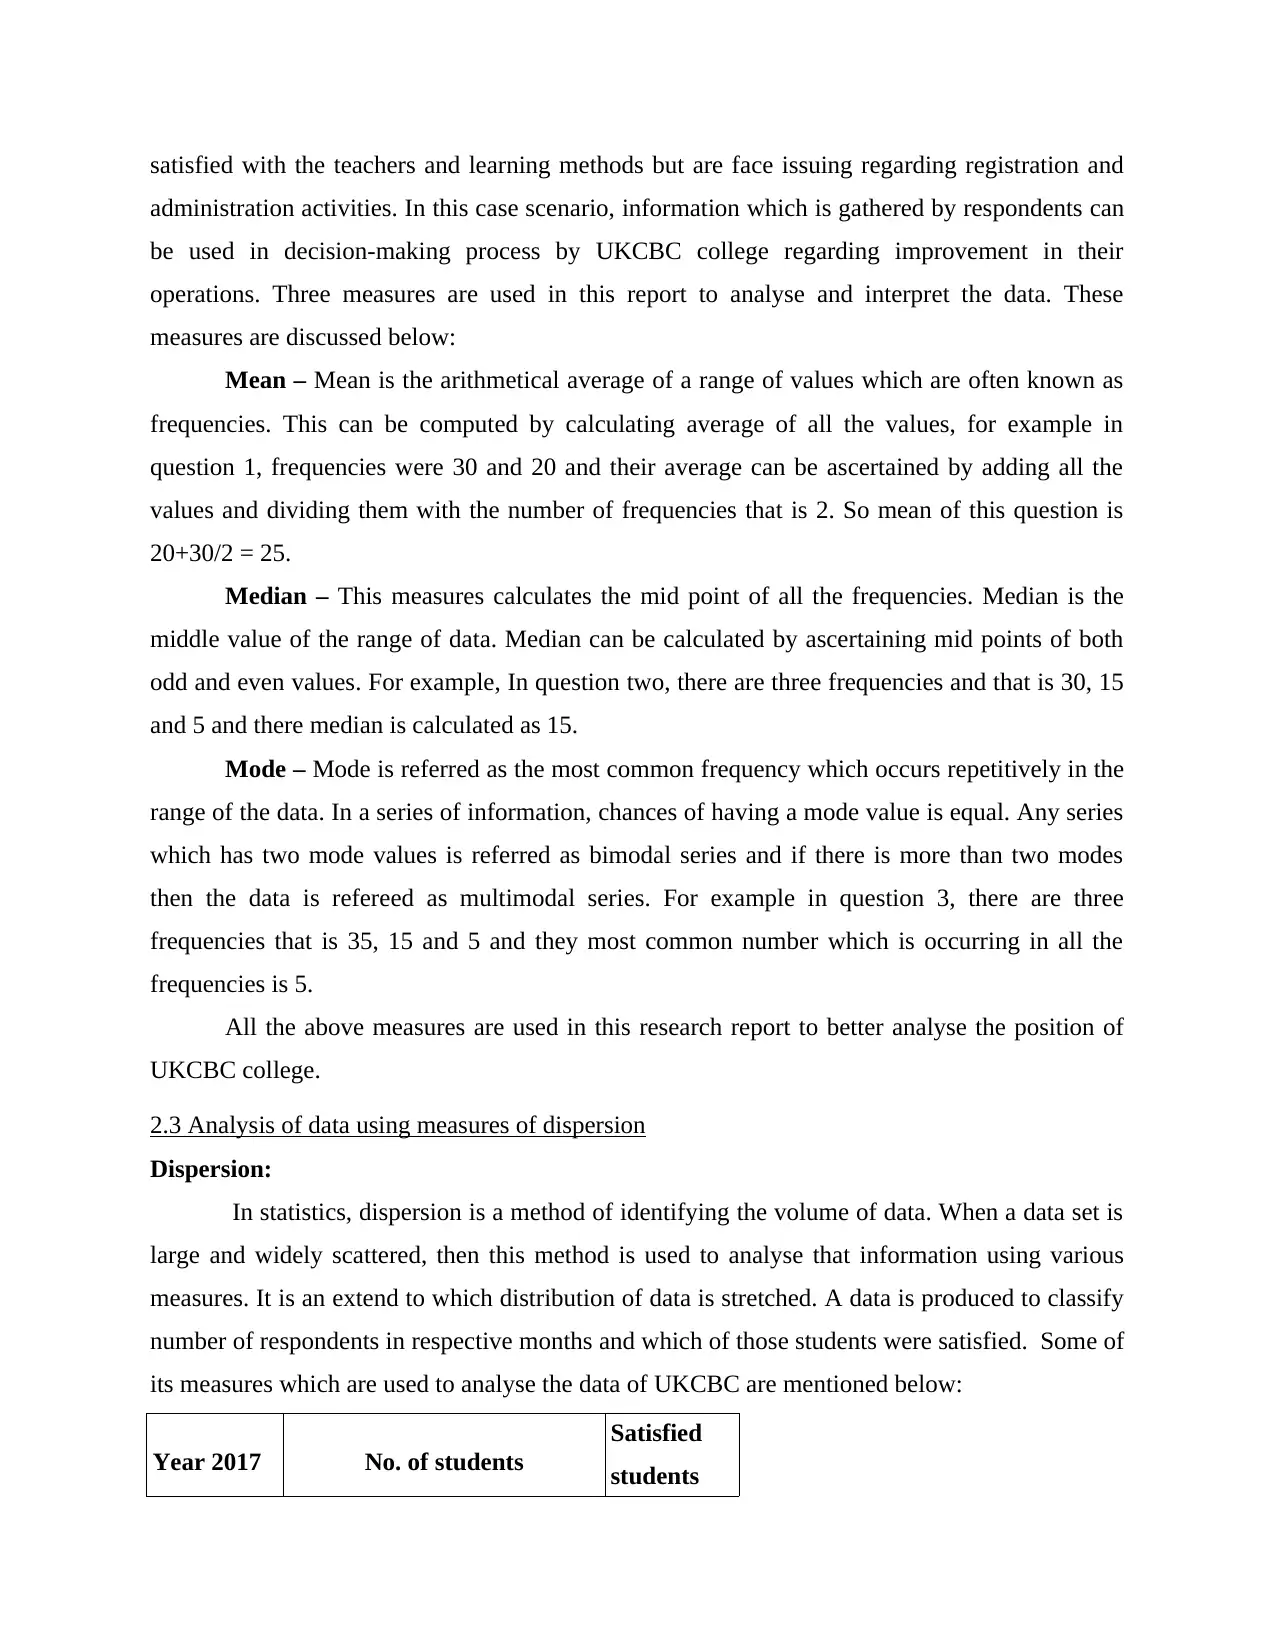
2.3 Analysis of data using measures of dispersion
Dispersion:
In statistics, dispersion is a method of identifying the volume of data. When a data set is
large and widely scattered, then this method is used to analyse that information using various
measures. It is an extend to which distribution of data is stretched. A data is produced to classify
number of respondents in respective months and which of those students were satisfied. Some of
its measures which are used to analyse the data of UKCBC are mentioned below:
Year 2017 No. of students
Satisfied
students
administration activities. In this case scenario, information which is gathered by respondents can
be used in decision-making process by UKCBC college regarding improvement in their
operations. Three measures are used in this report to analyse and interpret the data. These
measures are discussed below:
Mean – Mean is the arithmetical average of a range of values which are often known as
frequencies. This can be computed by calculating average of all the values, for example in
question 1, frequencies were 30 and 20 and their average can be ascertained by adding all the
values and dividing them with the number of frequencies that is 2. So mean of this question is
20+30/2 = 25.
Median – This measures calculates the mid point of all the frequencies. Median is the
middle value of the range of data. Median can be calculated by ascertaining mid points of both
odd and even values. For example, In question two, there are three frequencies and that is 30, 15
and 5 and there median is calculated as 15.
Mode – Mode is referred as the most common frequency which occurs repetitively in the
range of the data. In a series of information, chances of having a mode value is equal. Any series
which has two mode values is referred as bimodal series and if there is more than two modes
then the data is refereed as multimodal series. For example in question 3, there are three
frequencies that is 35, 15 and 5 and they most common number which is occurring in all the
frequencies is 5.
All the above measures are used in this research report to better analyse the position of
UKCBC college.
2.3 Analysis of data using measures of dispersion
Dispersion:
In statistics, dispersion is a method of identifying the volume of data. When a data set is
large and widely scattered, then this method is used to analyse that information using various
measures. It is an extend to which distribution of data is stretched. A data is produced to classify
number of respondents in respective months and which of those students were satisfied. Some of
its measures which are used to analyse the data of UKCBC are mentioned below:
Year 2017 No. of students
Satisfied
students
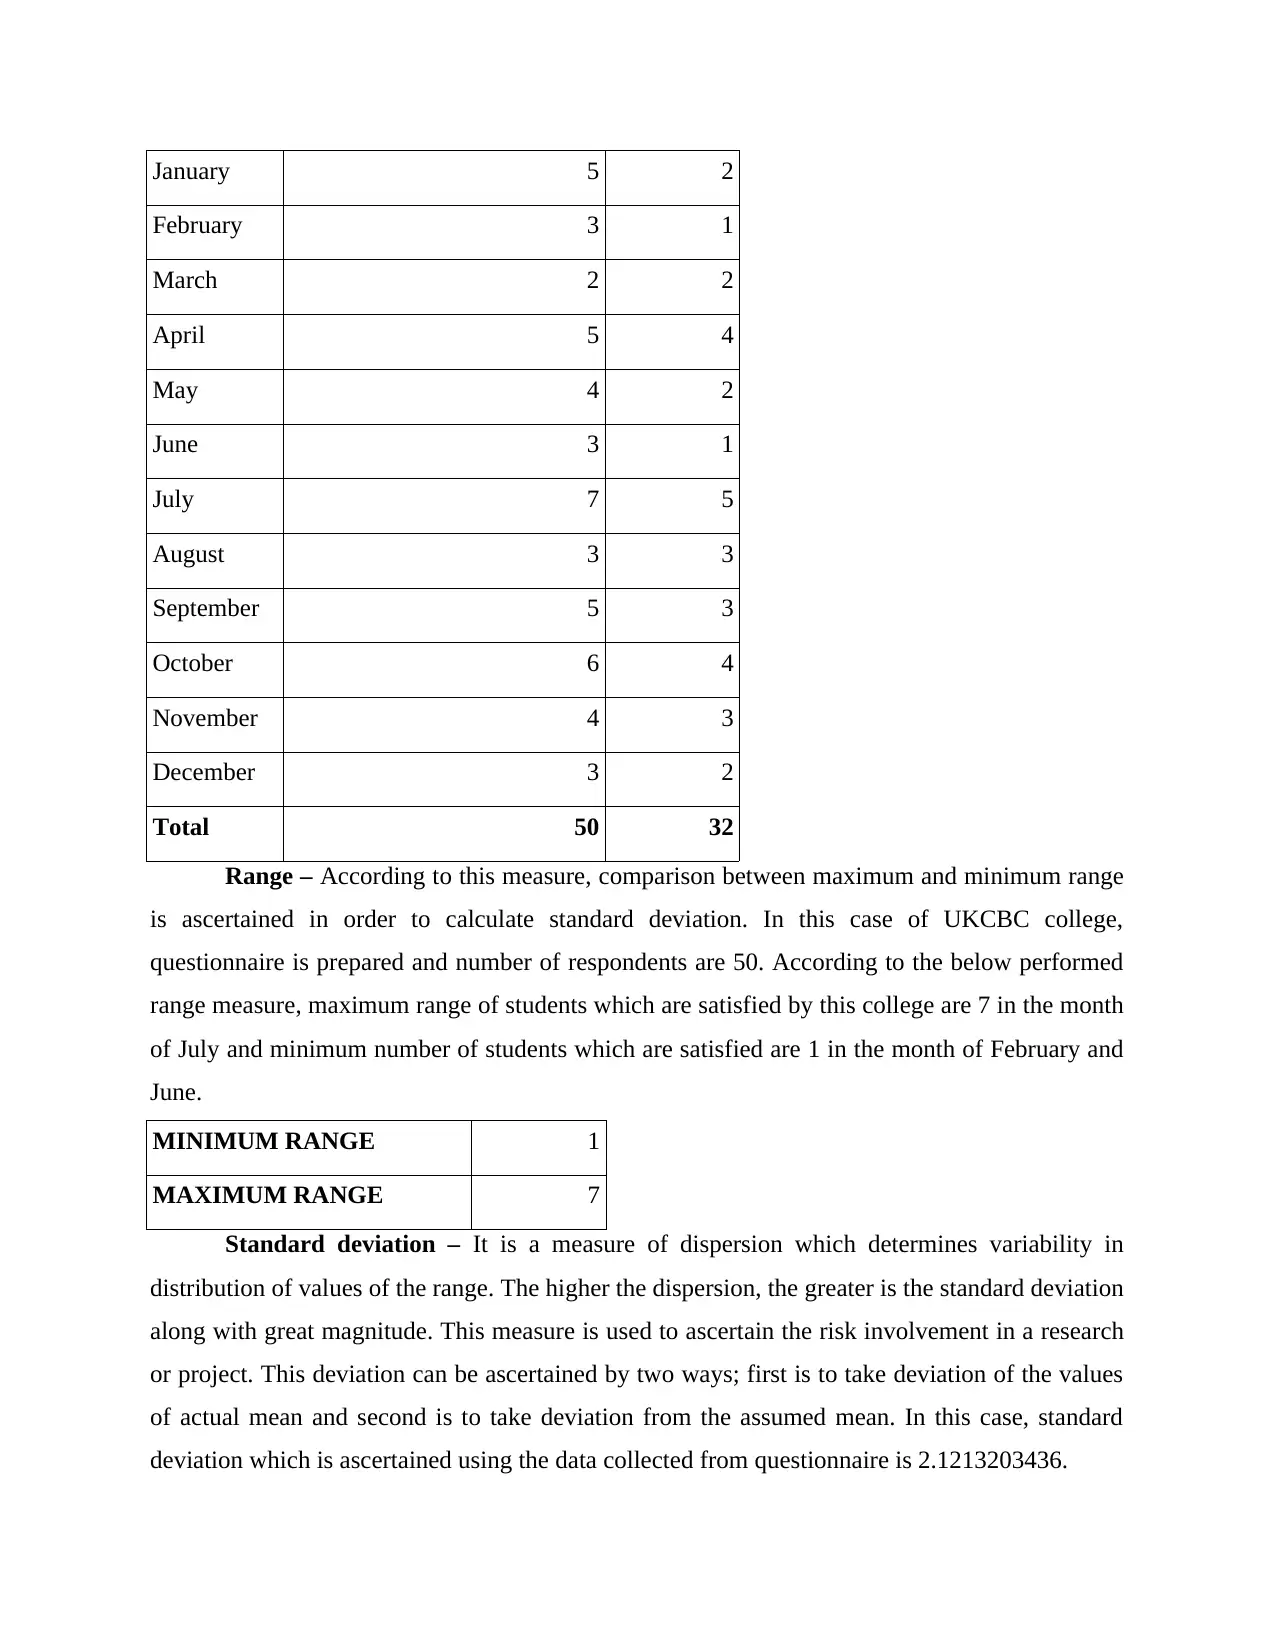
January 5 2
February 3 1
March 2 2
April 5 4
May 4 2
June 3 1
July 7 5
August 3 3
September 5 3
October 6 4
November 4 3
December 3 2
Total 50 32
Range – According to this measure, comparison between maximum and minimum range
is ascertained in order to calculate standard deviation. In this case of UKCBC college,
questionnaire is prepared and number of respondents are 50. According to the below performed
range measure, maximum range of students which are satisfied by this college are 7 in the month
of July and minimum number of students which are satisfied are 1 in the month of February and
June.
MINIMUM RANGE 1
MAXIMUM RANGE 7
Standard deviation – It is a measure of dispersion which determines variability in
distribution of values of the range. The higher the dispersion, the greater is the standard deviation
along with great magnitude. This measure is used to ascertain the risk involvement in a research
or project. This deviation can be ascertained by two ways; first is to take deviation of the values
of actual mean and second is to take deviation from the assumed mean. In this case, standard
deviation which is ascertained using the data collected from questionnaire is 2.1213203436.
⊘ This is a preview!⊘
Do you want full access?
Subscribe today to unlock all pages.
Trusted by 1+ million students worldwide
1 out of 42
Related Documents


Your All-in-One AI-Powered Toolkit for Academic Success.
+13062052269
info@desklib.com
Available 24*7 on WhatsApp / Email
![[object Object]](/_next/static/media/star-bottom.7253800d.svg)
Unlock your academic potential
Copyright © 2020–2026 A2Z Services. All Rights Reserved. Developed and managed by ZUCOL.