Business Decision Making Report: UKCBC Student Experience Analysis
VerifiedAdded on 2020/07/23
|19
|4266
|44
Report
AI Summary
This report focuses on business decision-making at UKCBC, a college of computing and business. It begins with a plan for collecting data through surveys, detailing the methodology and questionnaire design. The data collected from 100 students is then summarized using mean values and analyzed, including measures of dispersion like standard deviation and variance. Quartile and correlation analyses are also used to draw conclusions. The report includes graphs to visualize the data and a PowerPoint presentation of the findings. Finally, it discusses the use of software-generated information, project planning with a critical path, and the use of financial information for investment decisions. The report aims to provide insights to improve student satisfaction and inform college management decisions.
Business Decision
Making
Making
Paraphrase This Document
Need a fresh take? Get an instant paraphrase of this document with our AI Paraphraser
TABLE OF CONTENTS
INTRODUCTION...........................................................................................................................1
TASK 1............................................................................................................................................1
1.1 Create a plan for collecting data across campus....................................................................1
1.2 Present the survey methodology used with appropriate sampling frame..............................2
1.3 Design a questionnaire for gathering information.................................................................2
TASK 2............................................................................................................................................4
2.1 Summarise the data by using representative mean value.......................................................4
2.2 Analyse the results of a survey and draw valid conclusion...................................................4
2.3 Analyse the data by using measure of dispersion..................................................................5
2.4 Use of quartile and correlation for drawing beneficial conclusion........................................6
TASK 3............................................................................................................................................6
3.1 Produce graphs for understanding of data.............................................................................6
3.2 Creation of trend lines for spreadsheet..................................................................................8
3.3 Prepare a power point presentation for findings....................................................................9
3.4 Produce a formal business report to QAA.............................................................................9
TASK 4..........................................................................................................................................10
4.1 Use of software generated information in order to take beneficial decision.......................10
4.2 Prepare a project plan with critical path..............................................................................11
4.3 Use of financial information regarding investment.............................................................13
CONCLUSION..............................................................................................................................14
REFERENCES..............................................................................................................................16
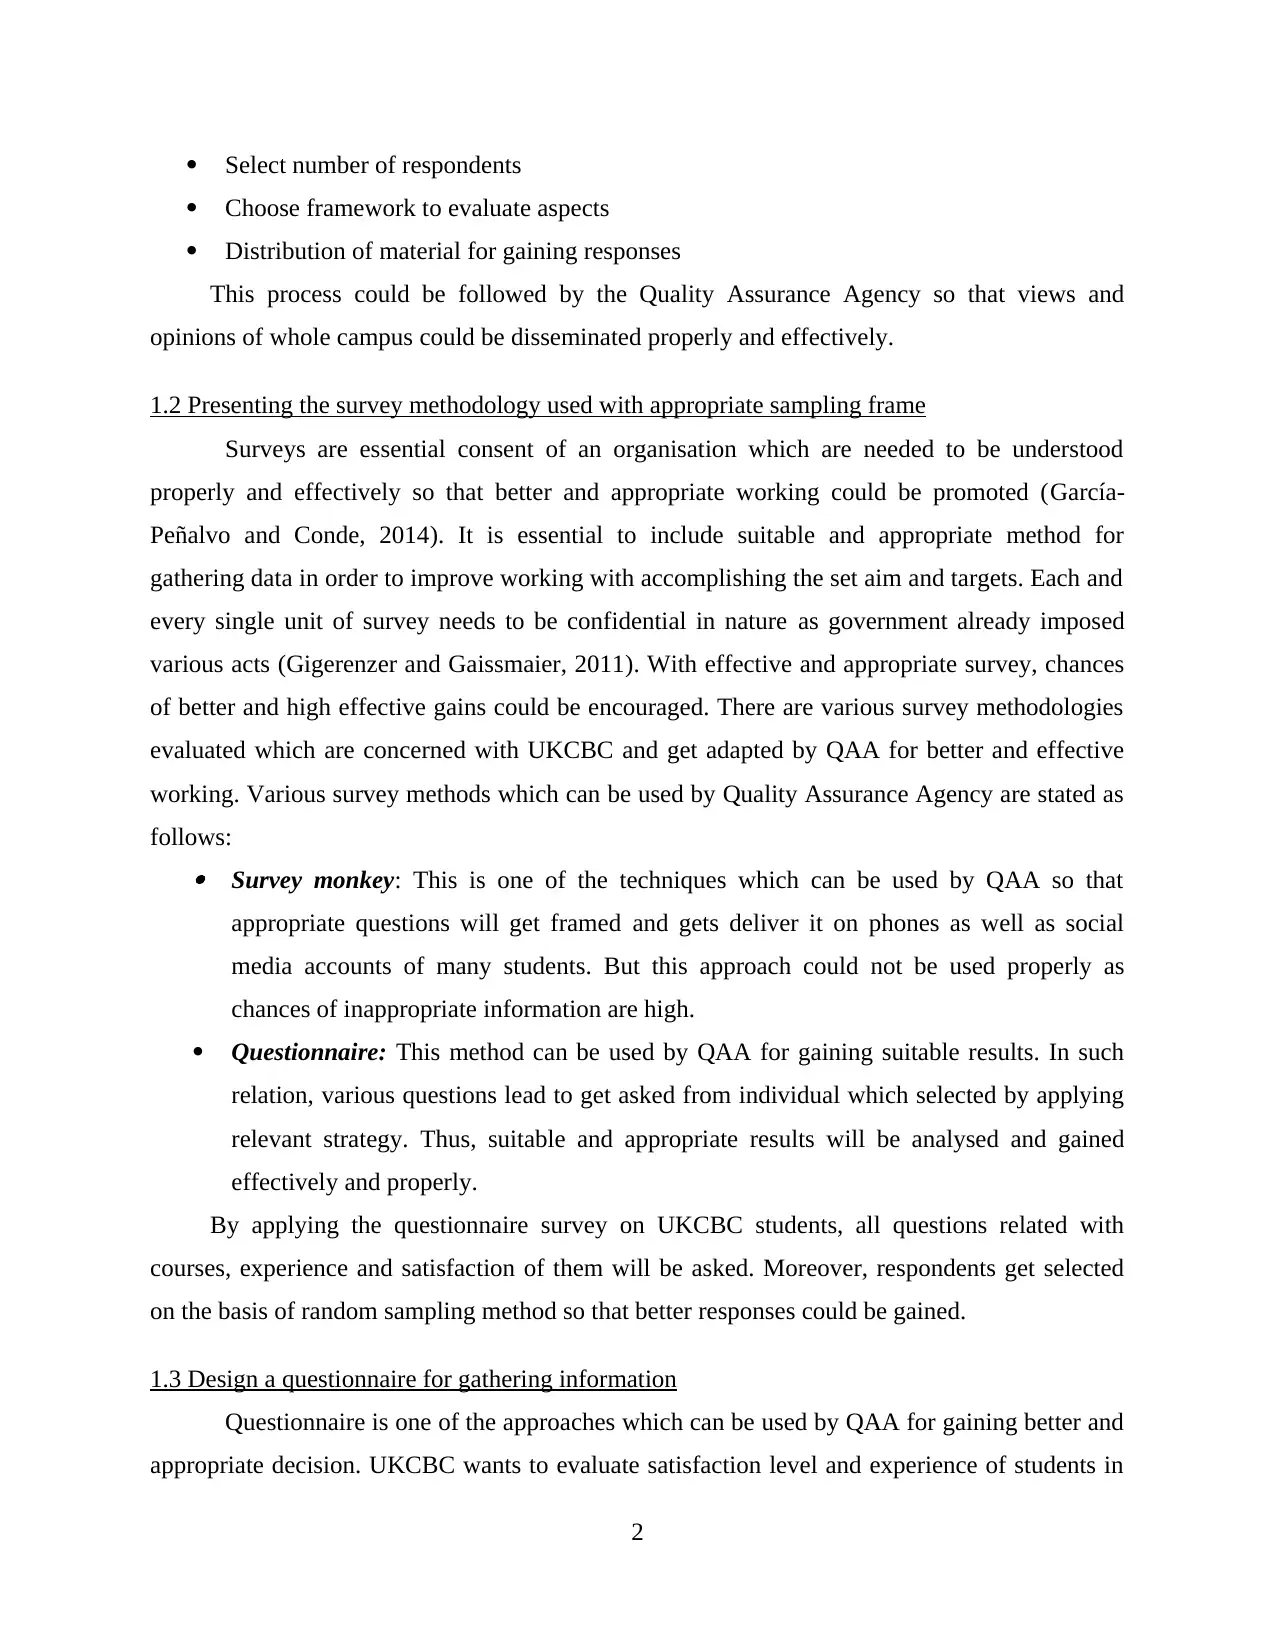
INTRODUCTION
Every right and appropriate decision supports business to grow and manage their
activities at a large level (Ferrell and Fraedrich, 2015). Business is a composition of various
number of activities and operations which are needed to be executed in an appropriate and
suitable frame. It is important for the business managers to organise a study which lead to
expand operations. This project is based on UKCBC which is one of the famous colleges of
computing and business in United Kingdom. They need to organise an investigation for
analysing student’s experience and satisfaction so that better and appropriate judgement and
modifications in college will take place. This project needs to first plan for organising a survey
so that appropriate and suitable results are carried down. Once the information is gathered, it
needs to be analysed properly with suitable presentation so that appropriate understanding could
be maintained. At last, before any investing activity, primary data not only provides satisfactory
consent but financial aspects also need to be analysed properly for better and effective working.
TASK 1
1.1 Creating a plan for collecting data across campus
Data is an important and essential factor for every big and right decision which is needed
to be understood by the business managers properly so that appropriate and suitable gains could
be managed and maintained (Ford and Richardson, 2013). Hence, before executing any
investigation or study, a major aspect is to create a plan for gathering information through
diverse source. It enables in better and effective working so that appropriate and suitable gains
could be enhanced.
In this consideration, primary and secondary source of information could be used.
Primary data supports in gaining better and appropriate outcomes through personal interaction or
interviews by applying relevant and suitable methods according to the nature. On the other hand,
secondary data has been collected through inspection of various books and journal articles.
Hence, this project is based on UK college of business and computing whom want to evaluate
their student satisfaction and experience which enables in make difference properly so that
further and suitable judgement lead to carried down. In such aspect, appropriate and suitable plan
for collecting information through various sources is stated as below:
Identify the cause
1
⊘ This is a preview!⊘
Do you want full access?
Subscribe today to unlock all pages.
Trusted by 1+ million students worldwide
Select number of respondents
Choose framework to evaluate aspects
Distribution of material for gaining responses
This process could be followed by the Quality Assurance Agency so that views and
opinions of whole campus could be disseminated properly and effectively.
1.2 Presenting the survey methodology used with appropriate sampling frame
Surveys are essential consent of an organisation which are needed to be understood
properly and effectively so that better and appropriate working could be promoted (García-
Peñalvo and Conde, 2014). It is essential to include suitable and appropriate method for
gathering data in order to improve working with accomplishing the set aim and targets. Each and
every single unit of survey needs to be confidential in nature as government already imposed
various acts (Gigerenzer and Gaissmaier, 2011). With effective and appropriate survey, chances
of better and high effective gains could be encouraged. There are various survey methodologies
evaluated which are concerned with UKCBC and get adapted by QAA for better and effective
working. Various survey methods which can be used by Quality Assurance Agency are stated as
follows: Survey monkey: This is one of the techniques which can be used by QAA so that
appropriate questions will get framed and gets deliver it on phones as well as social
media accounts of many students. But this approach could not be used properly as
chances of inappropriate information are high.
Questionnaire: This method can be used by QAA for gaining suitable results. In such
relation, various questions lead to get asked from individual which selected by applying
relevant strategy. Thus, suitable and appropriate results will be analysed and gained
effectively and properly.
By applying the questionnaire survey on UKCBC students, all questions related with
courses, experience and satisfaction of them will be asked. Moreover, respondents get selected
on the basis of random sampling method so that better responses could be gained.
1.3 Design a questionnaire for gathering information
Questionnaire is one of the approaches which can be used by QAA for gaining better and
appropriate decision. UKCBC wants to evaluate satisfaction level and experience of students in
2
Paraphrase This Document
Need a fresh take? Get an instant paraphrase of this document with our AI Paraphraser
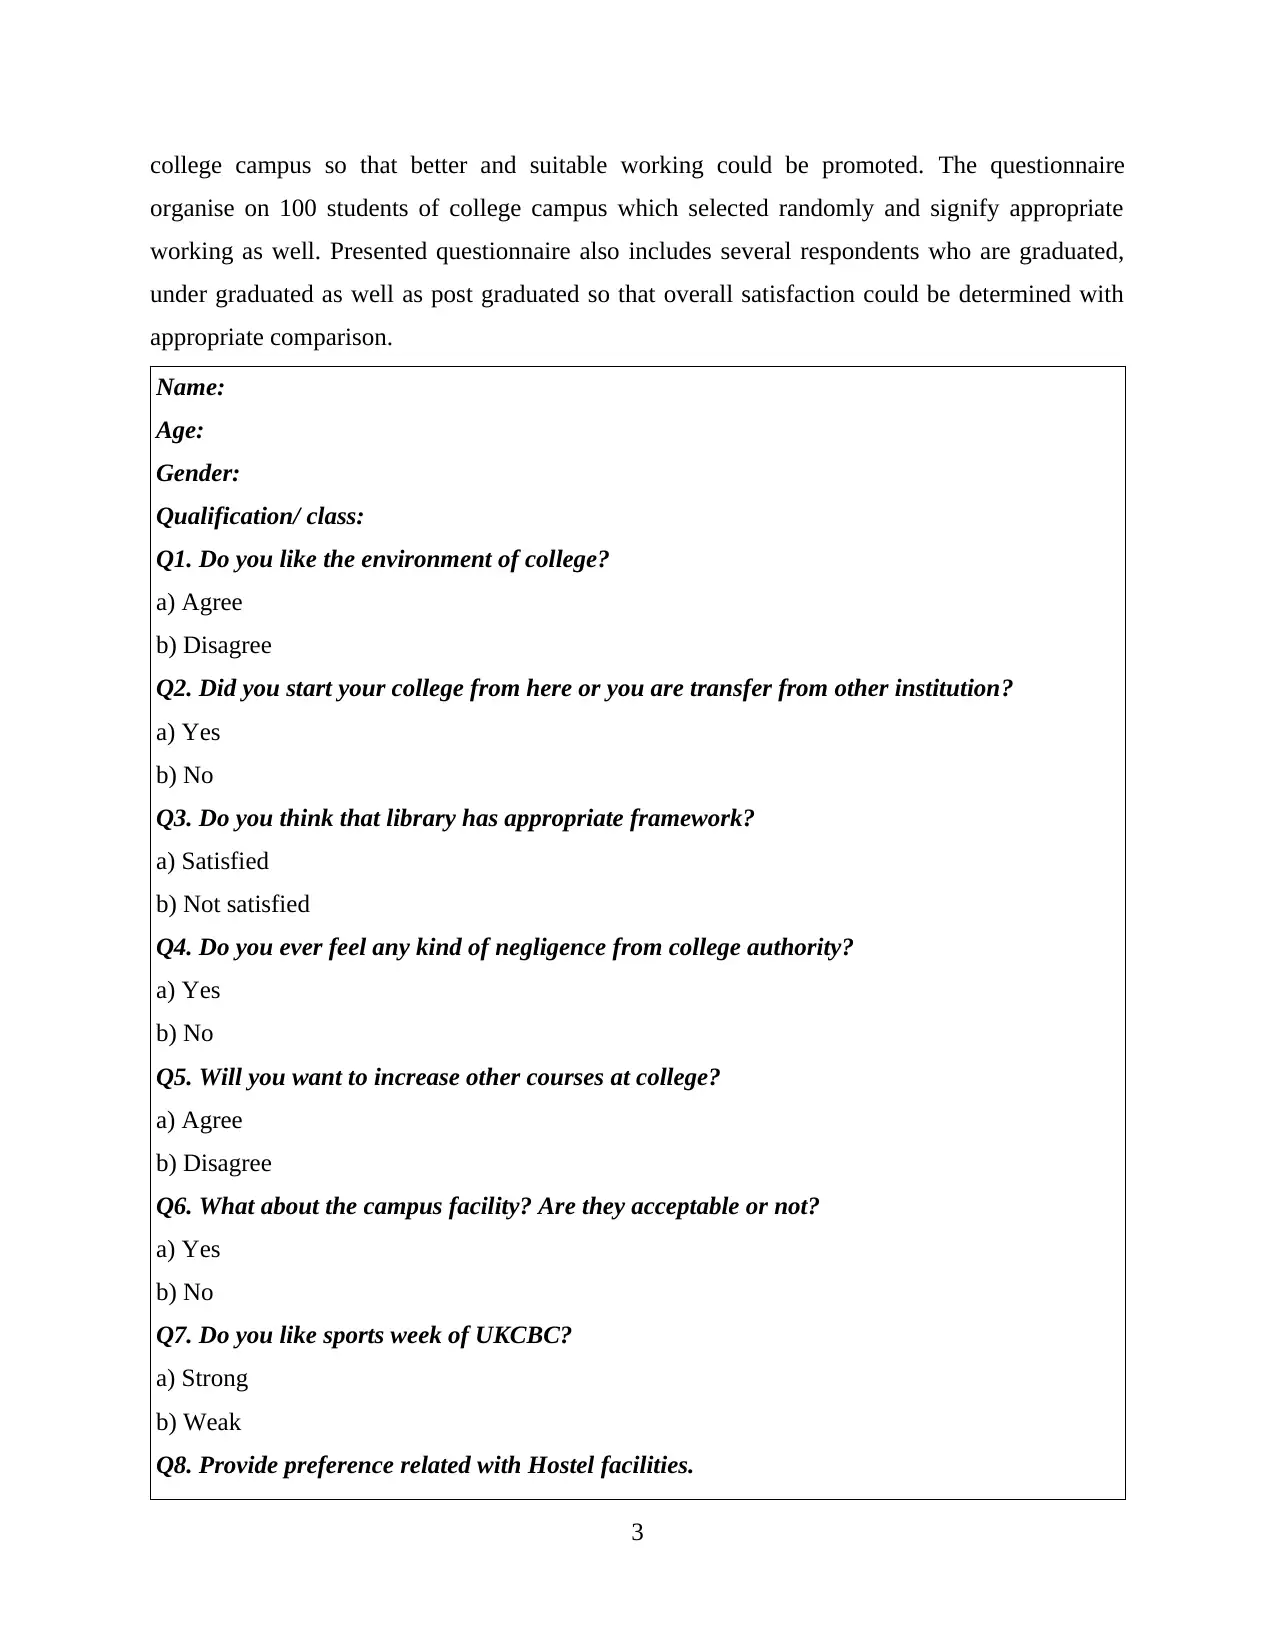
college campus so that better and suitable working could be promoted. The questionnaire
organise on 100 students of college campus which selected randomly and signify appropriate
working as well. Presented questionnaire also includes several respondents who are graduated,
under graduated as well as post graduated so that overall satisfaction could be determined with
appropriate comparison.
Name:
Age:
Gender:
Qualification/ class:
Q1. Do you like the environment of college?
a) Agree
b) Disagree
Q2. Did you start your college from here or you are transfer from other institution?
a) Yes
b) No
Q3. Do you think that library has appropriate framework?
a) Satisfied
b) Not satisfied
Q4. Do you ever feel any kind of negligence from college authority?
a) Yes
b) No
Q5. Will you want to increase other courses at college?
a) Agree
b) Disagree
Q6. What about the campus facility? Are they acceptable or not?
a) Yes
b) No
Q7. Do you like sports week of UKCBC?
a) Strong
b) Weak
Q8. Provide preference related with Hostel facilities.
3
a) Appropriate
b) Not appropriate
Q9. Do you want to modify several consents of UK college of business and computing?
a) Yes
b) No
Q10. Any recommendation? If necessary?( Please mention appropriate suggestions which
are helpful)___________________________________________________________________
TASK 2
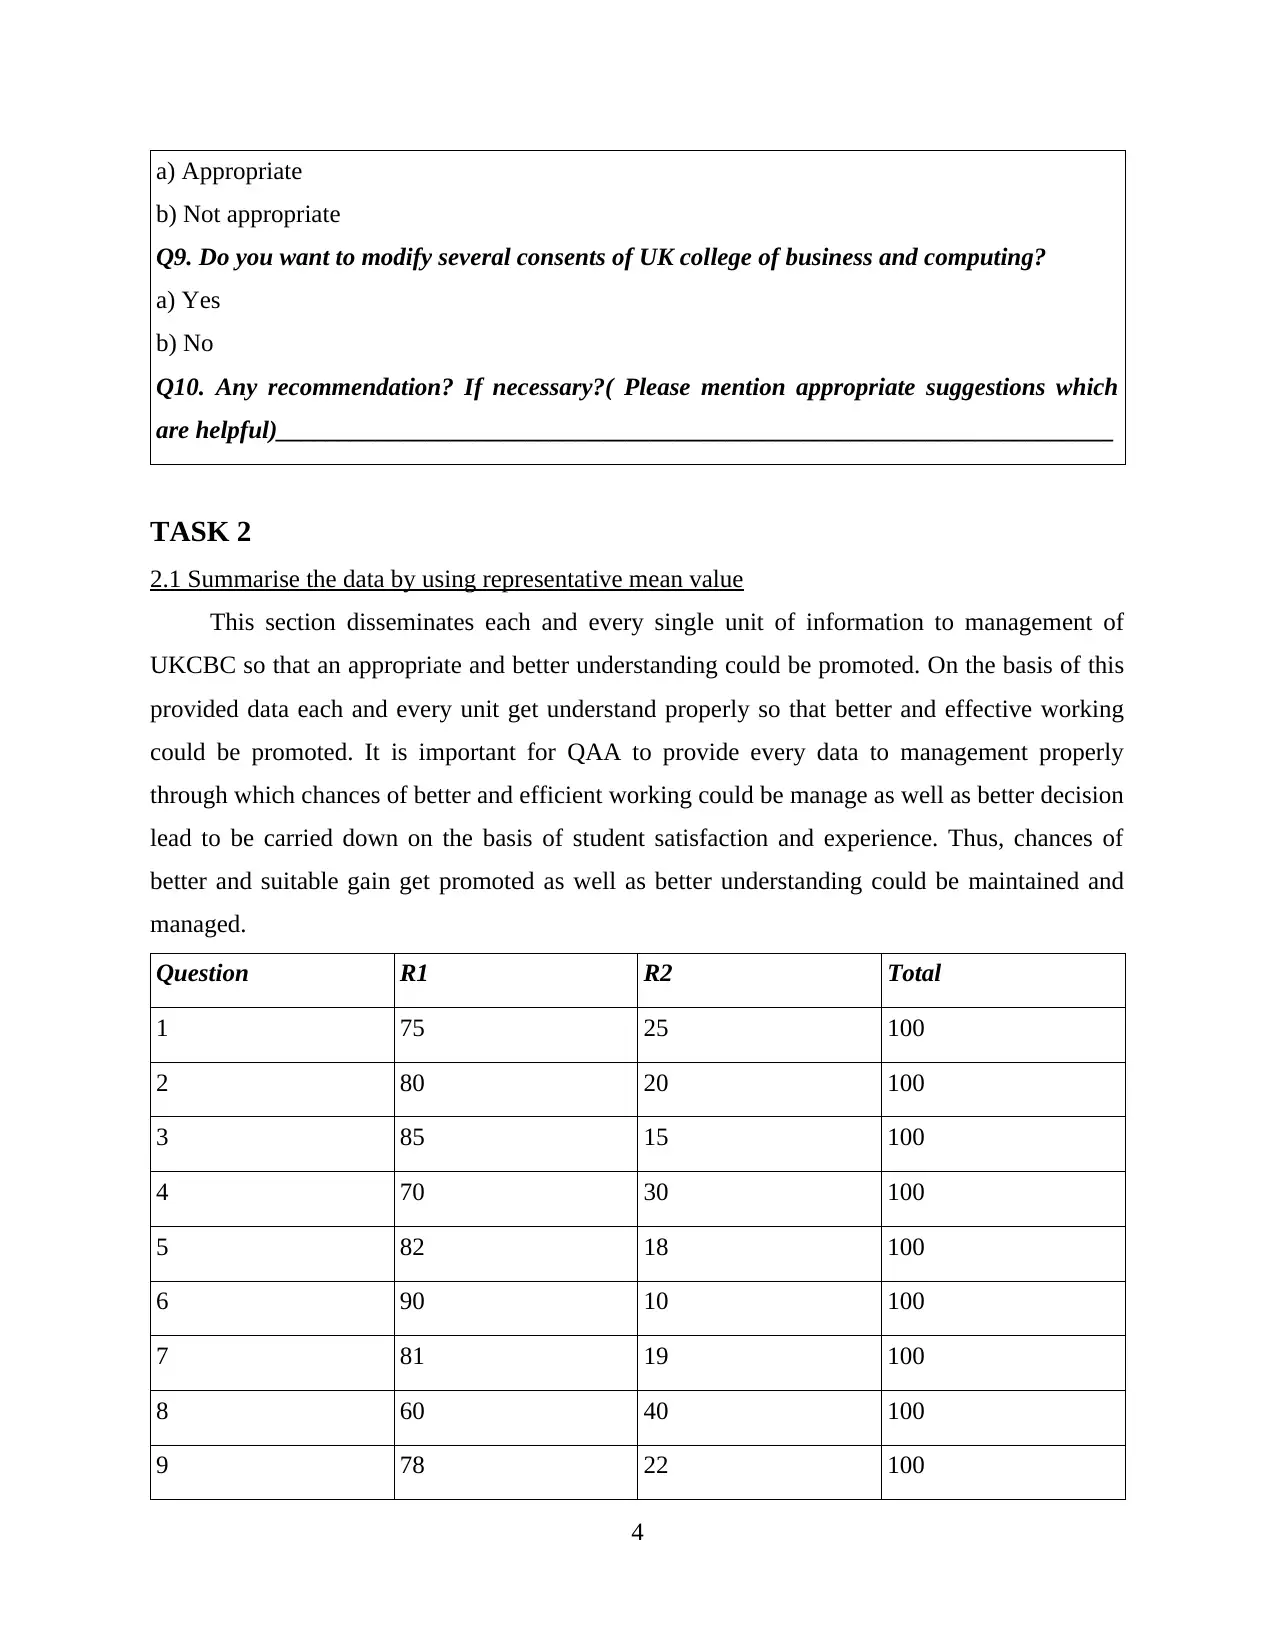
2.1 Summarise the data by using representative mean value
This section disseminates each and every single unit of information to management of
UKCBC so that an appropriate and better understanding could be promoted. On the basis of this
provided data each and every unit get understand properly so that better and effective working
could be promoted. It is important for QAA to provide every data to management properly
through which chances of better and efficient working could be manage as well as better decision
lead to be carried down on the basis of student satisfaction and experience. Thus, chances of
better and suitable gain get promoted as well as better understanding could be maintained and
managed.
Question R1 R2 Total
1 75 25 100
2 80 20 100
3 85 15 100
4 70 30 100
5 82 18 100
6 90 10 100
7 81 19 100
8 60 40 100
9 78 22 100
4
b) Not appropriate
Q9. Do you want to modify several consents of UK college of business and computing?
a) Yes
b) No
Q10. Any recommendation? If necessary?( Please mention appropriate suggestions which
are helpful)___________________________________________________________________
TASK 2
2.1 Summarise the data by using representative mean value
This section disseminates each and every single unit of information to management of
UKCBC so that an appropriate and better understanding could be promoted. On the basis of this
provided data each and every unit get understand properly so that better and effective working
could be promoted. It is important for QAA to provide every data to management properly
through which chances of better and efficient working could be manage as well as better decision
lead to be carried down on the basis of student satisfaction and experience. Thus, chances of
better and suitable gain get promoted as well as better understanding could be maintained and
managed.
Question R1 R2 Total
1 75 25 100
2 80 20 100
3 85 15 100
4 70 30 100
5 82 18 100
6 90 10 100
7 81 19 100
8 60 40 100
9 78 22 100
4
⊘ This is a preview!⊘
Do you want full access?
Subscribe today to unlock all pages.
Trusted by 1+ million students worldwide
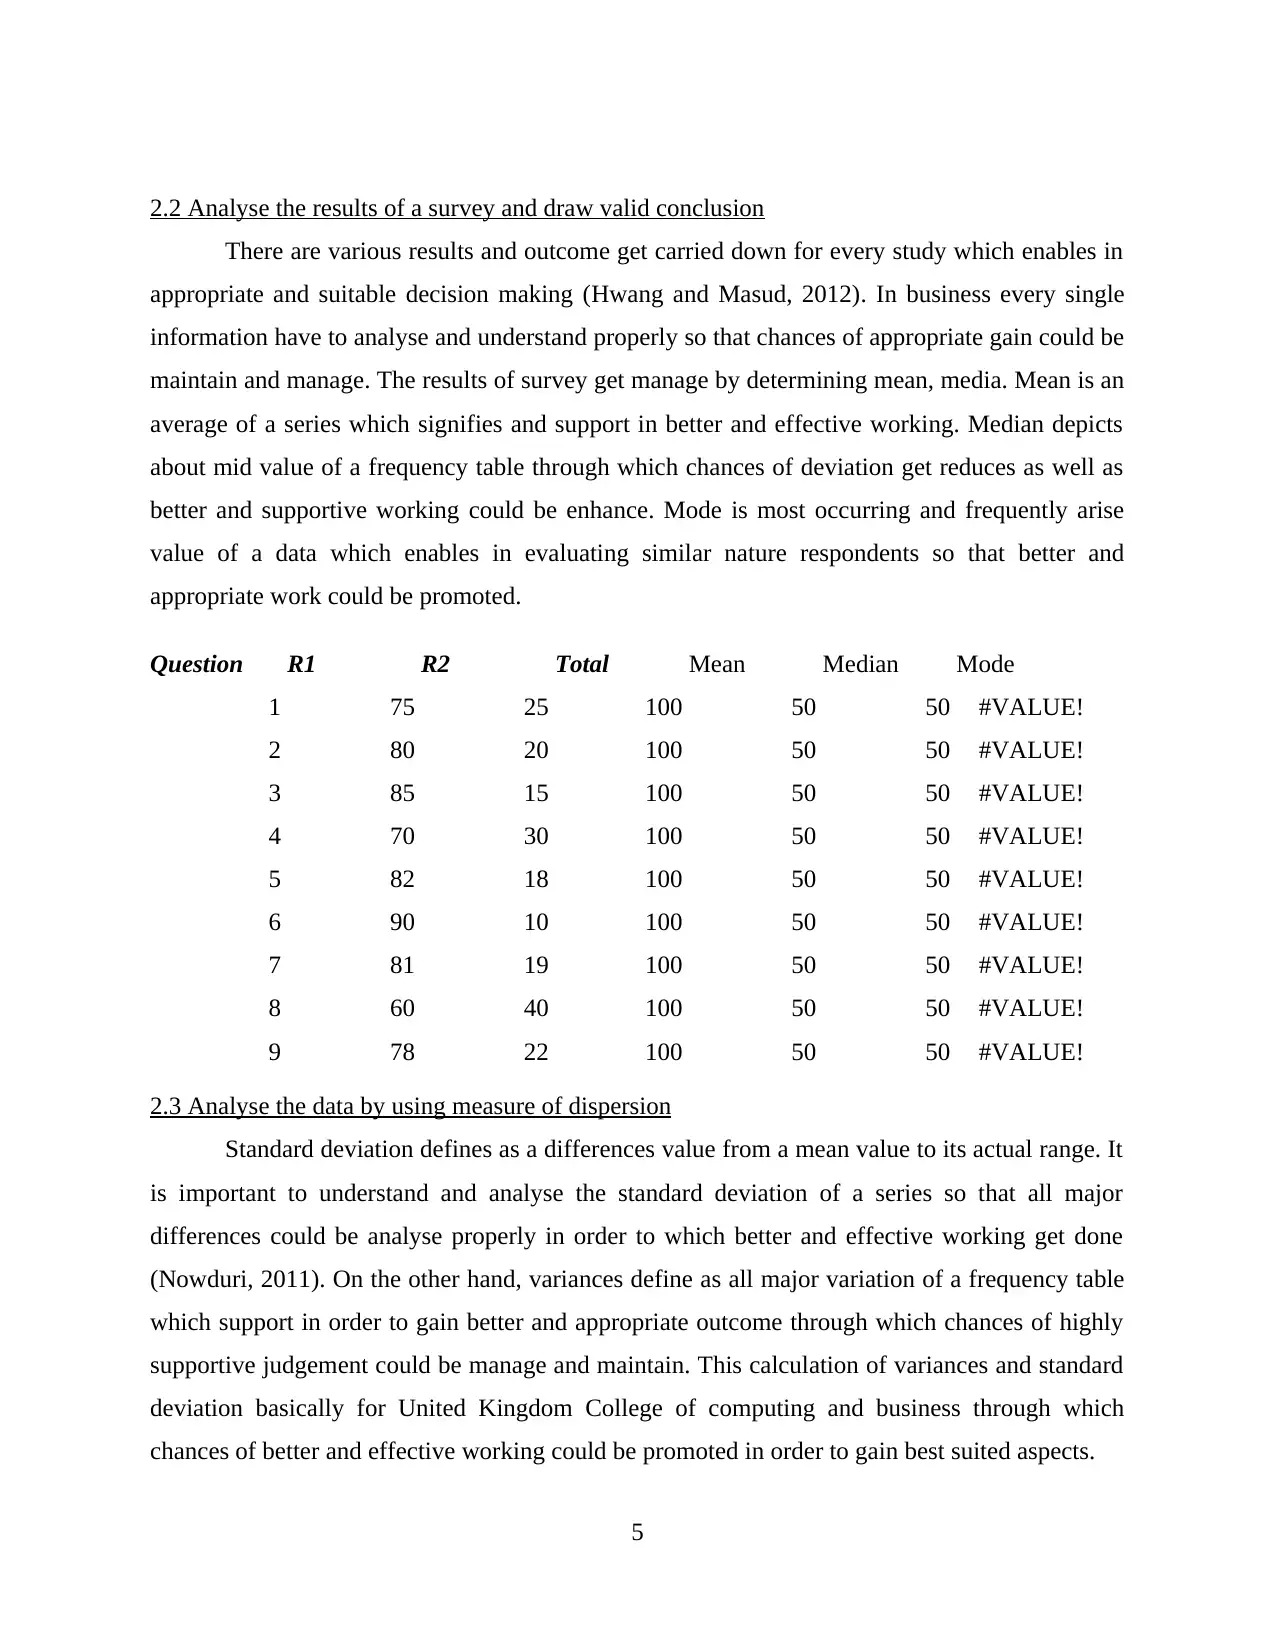
2.2 Analyse the results of a survey and draw valid conclusion
There are various results and outcome get carried down for every study which enables in
appropriate and suitable decision making (Hwang and Masud, 2012). In business every single
information have to analyse and understand properly so that chances of appropriate gain could be
maintain and manage. The results of survey get manage by determining mean, media. Mean is an
average of a series which signifies and support in better and effective working. Median depicts
about mid value of a frequency table through which chances of deviation get reduces as well as
better and supportive working could be enhance. Mode is most occurring and frequently arise
value of a data which enables in evaluating similar nature respondents so that better and
appropriate work could be promoted.
Question R1 R2 Total Mean Median Mode
1 75 25 100 50 50 #VALUE!
2 80 20 100 50 50 #VALUE!
3 85 15 100 50 50 #VALUE!
4 70 30 100 50 50 #VALUE!
5 82 18 100 50 50 #VALUE!
6 90 10 100 50 50 #VALUE!
7 81 19 100 50 50 #VALUE!
8 60 40 100 50 50 #VALUE!
9 78 22 100 50 50 #VALUE!
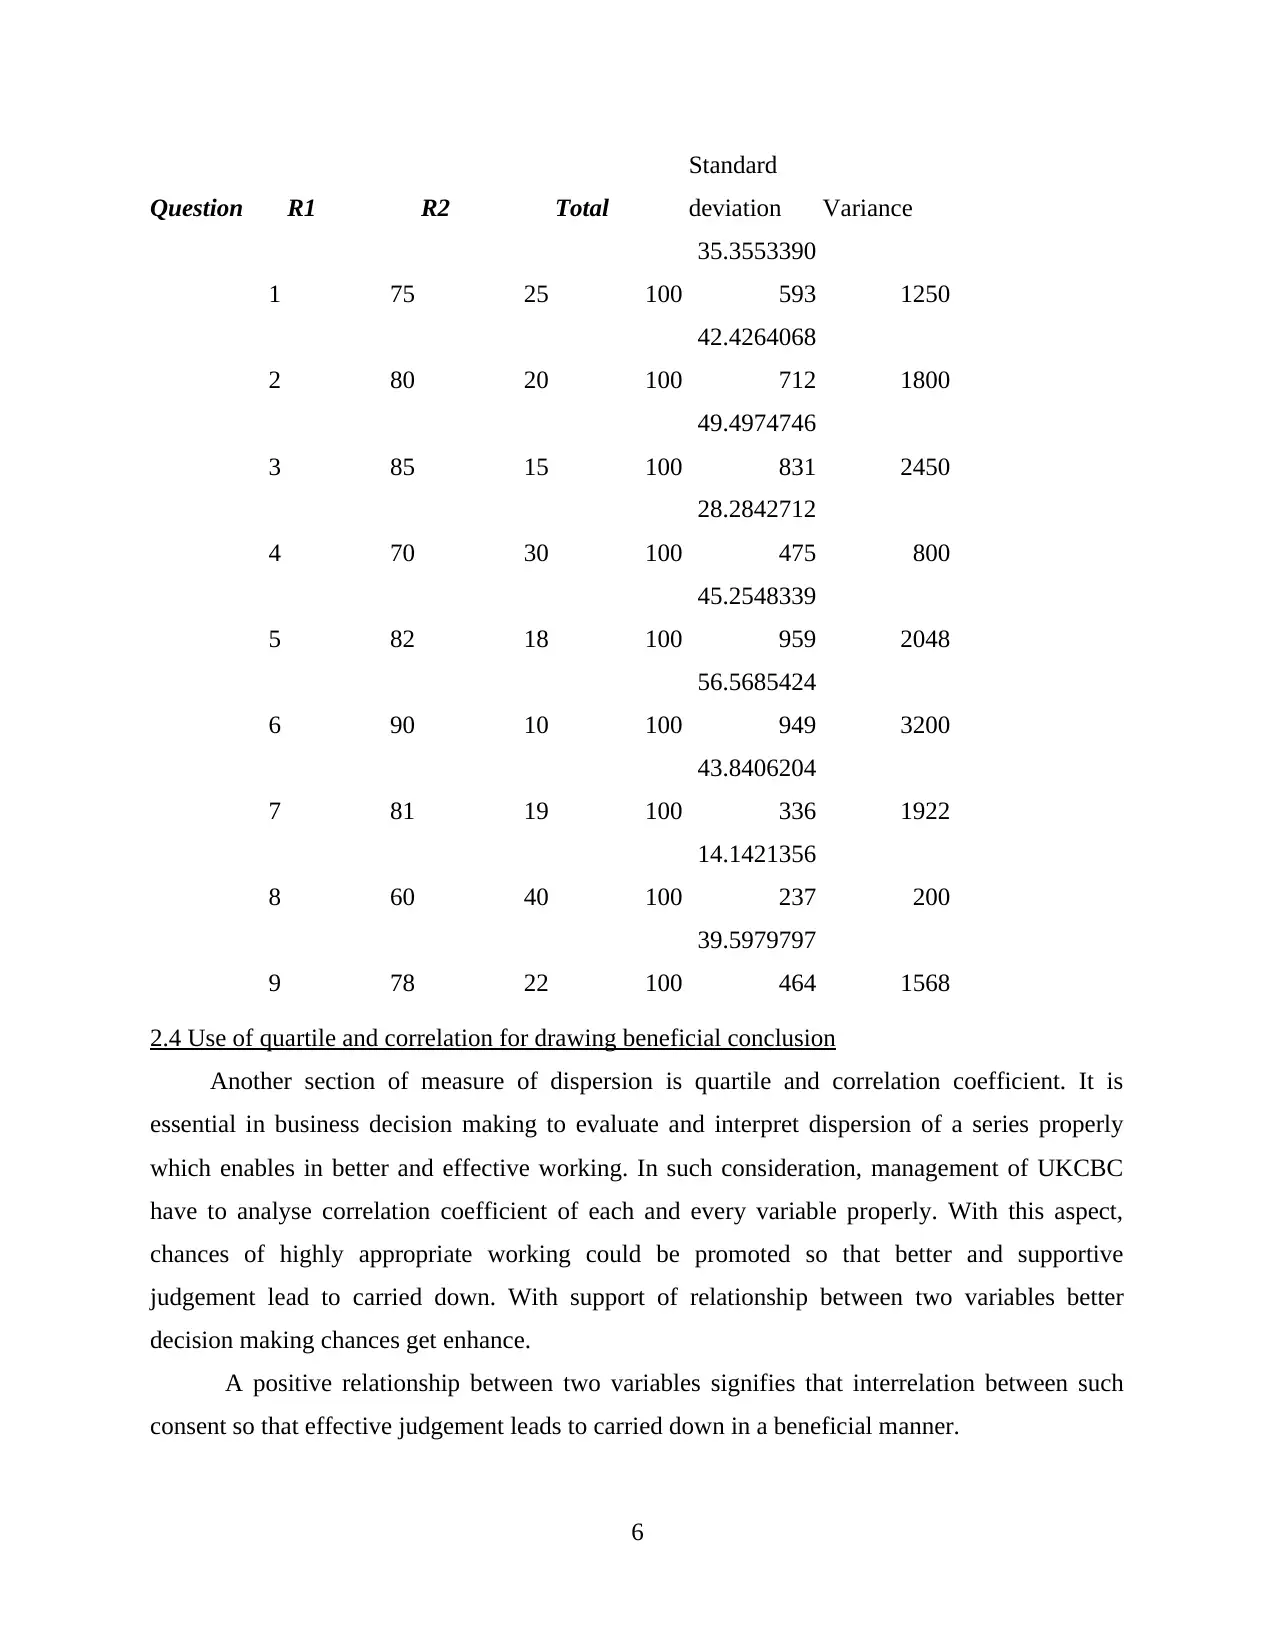
2.3 Analyse the data by using measure of dispersion
Standard deviation defines as a differences value from a mean value to its actual range. It
is important to understand and analyse the standard deviation of a series so that all major
differences could be analyse properly in order to which better and effective working get done
(Nowduri, 2011). On the other hand, variances define as all major variation of a frequency table
which support in order to gain better and appropriate outcome through which chances of highly
supportive judgement could be manage and maintain. This calculation of variances and standard
deviation basically for United Kingdom College of computing and business through which
chances of better and effective working could be promoted in order to gain best suited aspects.
5
There are various results and outcome get carried down for every study which enables in
appropriate and suitable decision making (Hwang and Masud, 2012). In business every single
information have to analyse and understand properly so that chances of appropriate gain could be
maintain and manage. The results of survey get manage by determining mean, media. Mean is an
average of a series which signifies and support in better and effective working. Median depicts
about mid value of a frequency table through which chances of deviation get reduces as well as
better and supportive working could be enhance. Mode is most occurring and frequently arise
value of a data which enables in evaluating similar nature respondents so that better and
appropriate work could be promoted.
Question R1 R2 Total Mean Median Mode
1 75 25 100 50 50 #VALUE!
2 80 20 100 50 50 #VALUE!
3 85 15 100 50 50 #VALUE!
4 70 30 100 50 50 #VALUE!
5 82 18 100 50 50 #VALUE!
6 90 10 100 50 50 #VALUE!
7 81 19 100 50 50 #VALUE!
8 60 40 100 50 50 #VALUE!
9 78 22 100 50 50 #VALUE!
2.3 Analyse the data by using measure of dispersion
Standard deviation defines as a differences value from a mean value to its actual range. It
is important to understand and analyse the standard deviation of a series so that all major
differences could be analyse properly in order to which better and effective working get done
(Nowduri, 2011). On the other hand, variances define as all major variation of a frequency table
which support in order to gain better and appropriate outcome through which chances of highly
supportive judgement could be manage and maintain. This calculation of variances and standard
deviation basically for United Kingdom College of computing and business through which
chances of better and effective working could be promoted in order to gain best suited aspects.
5
Paraphrase This Document
Need a fresh take? Get an instant paraphrase of this document with our AI Paraphraser
Question R1 R2 Total
Standard
deviation Variance
1 75 25 100
35.3553390
593 1250
2 80 20 100
42.4264068
712 1800
3 85 15 100
49.4974746
831 2450
4 70 30 100
28.2842712
475 800
5 82 18 100
45.2548339
959 2048
6 90 10 100
56.5685424
949 3200
7 81 19 100
43.8406204
336 1922
8 60 40 100
14.1421356
237 200
9 78 22 100
39.5979797
464 1568
2.4 Use of quartile and correlation for drawing beneficial conclusion
Another section of measure of dispersion is quartile and correlation coefficient. It is
essential in business decision making to evaluate and interpret dispersion of a series properly
which enables in better and effective working. In such consideration, management of UKCBC
have to analyse correlation coefficient of each and every variable properly. With this aspect,
chances of highly appropriate working could be promoted so that better and supportive
judgement lead to carried down. With support of relationship between two variables better
decision making chances get enhance.
A positive relationship between two variables signifies that interrelation between such
consent so that effective judgement leads to carried down in a beneficial manner.
6
Question R1 R2 Total Correlation
1 75 25 100 1
2 80 20 100
3 85 15 100
4 70 30 100
5 82 18 100 1
6 90 10 100
7 81 19 100
8 60 40 100 1
9 78 22 100
TASK 3
3.1 Produce graphs for understanding of data
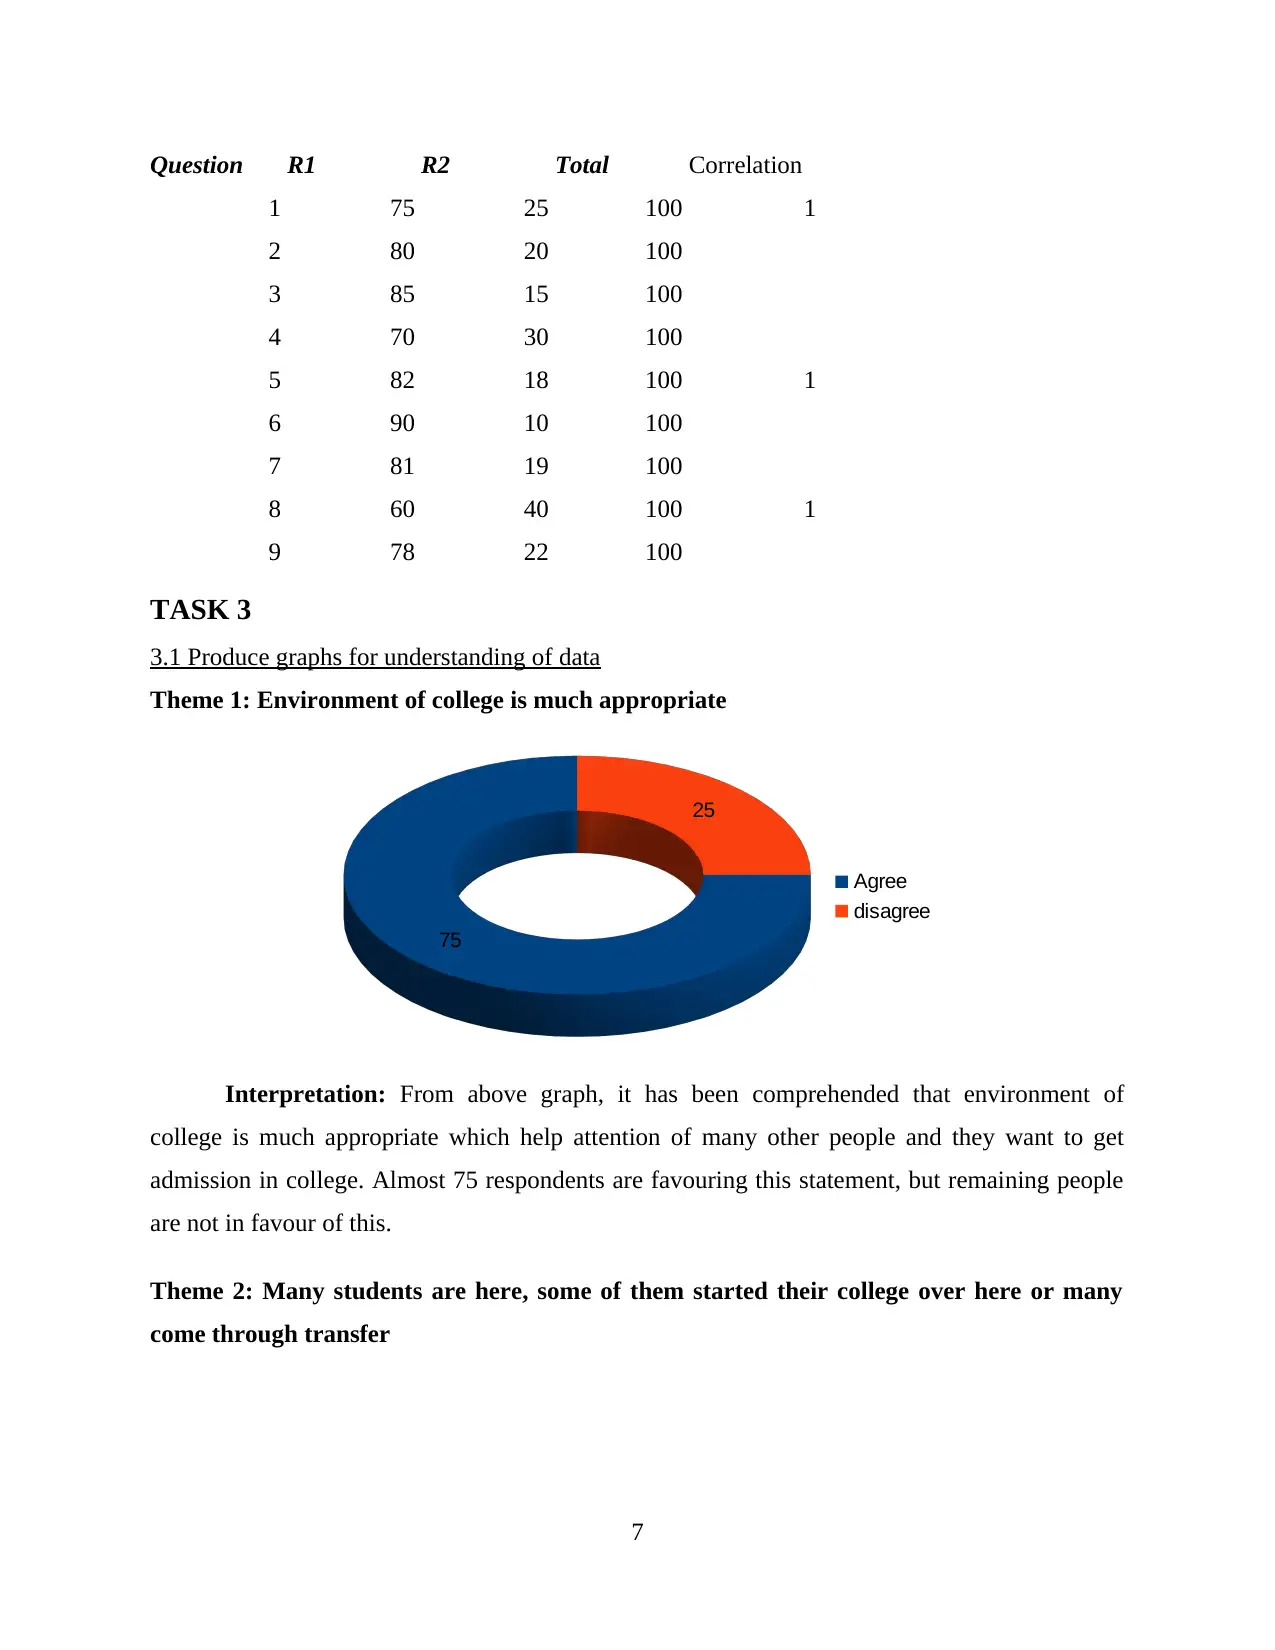
Theme 1: Environment of college is much appropriate
75
25
Agree
disagree
Interpretation: From above graph, it has been comprehended that environment of
college is much appropriate which help attention of many other people and they want to get
admission in college. Almost 75 respondents are favouring this statement, but remaining people
are not in favour of this.
Theme 2: Many students are here, some of them started their college over here or many
come through transfer
7
1 75 25 100 1
2 80 20 100
3 85 15 100
4 70 30 100
5 82 18 100 1
6 90 10 100
7 81 19 100
8 60 40 100 1
9 78 22 100
TASK 3
3.1 Produce graphs for understanding of data
Theme 1: Environment of college is much appropriate
75
25
Agree
disagree
Interpretation: From above graph, it has been comprehended that environment of
college is much appropriate which help attention of many other people and they want to get
admission in college. Almost 75 respondents are favouring this statement, but remaining people
are not in favour of this.
Theme 2: Many students are here, some of them started their college over here or many
come through transfer
7
⊘ This is a preview!⊘
Do you want full access?
Subscribe today to unlock all pages.
Trusted by 1+ million students worldwide
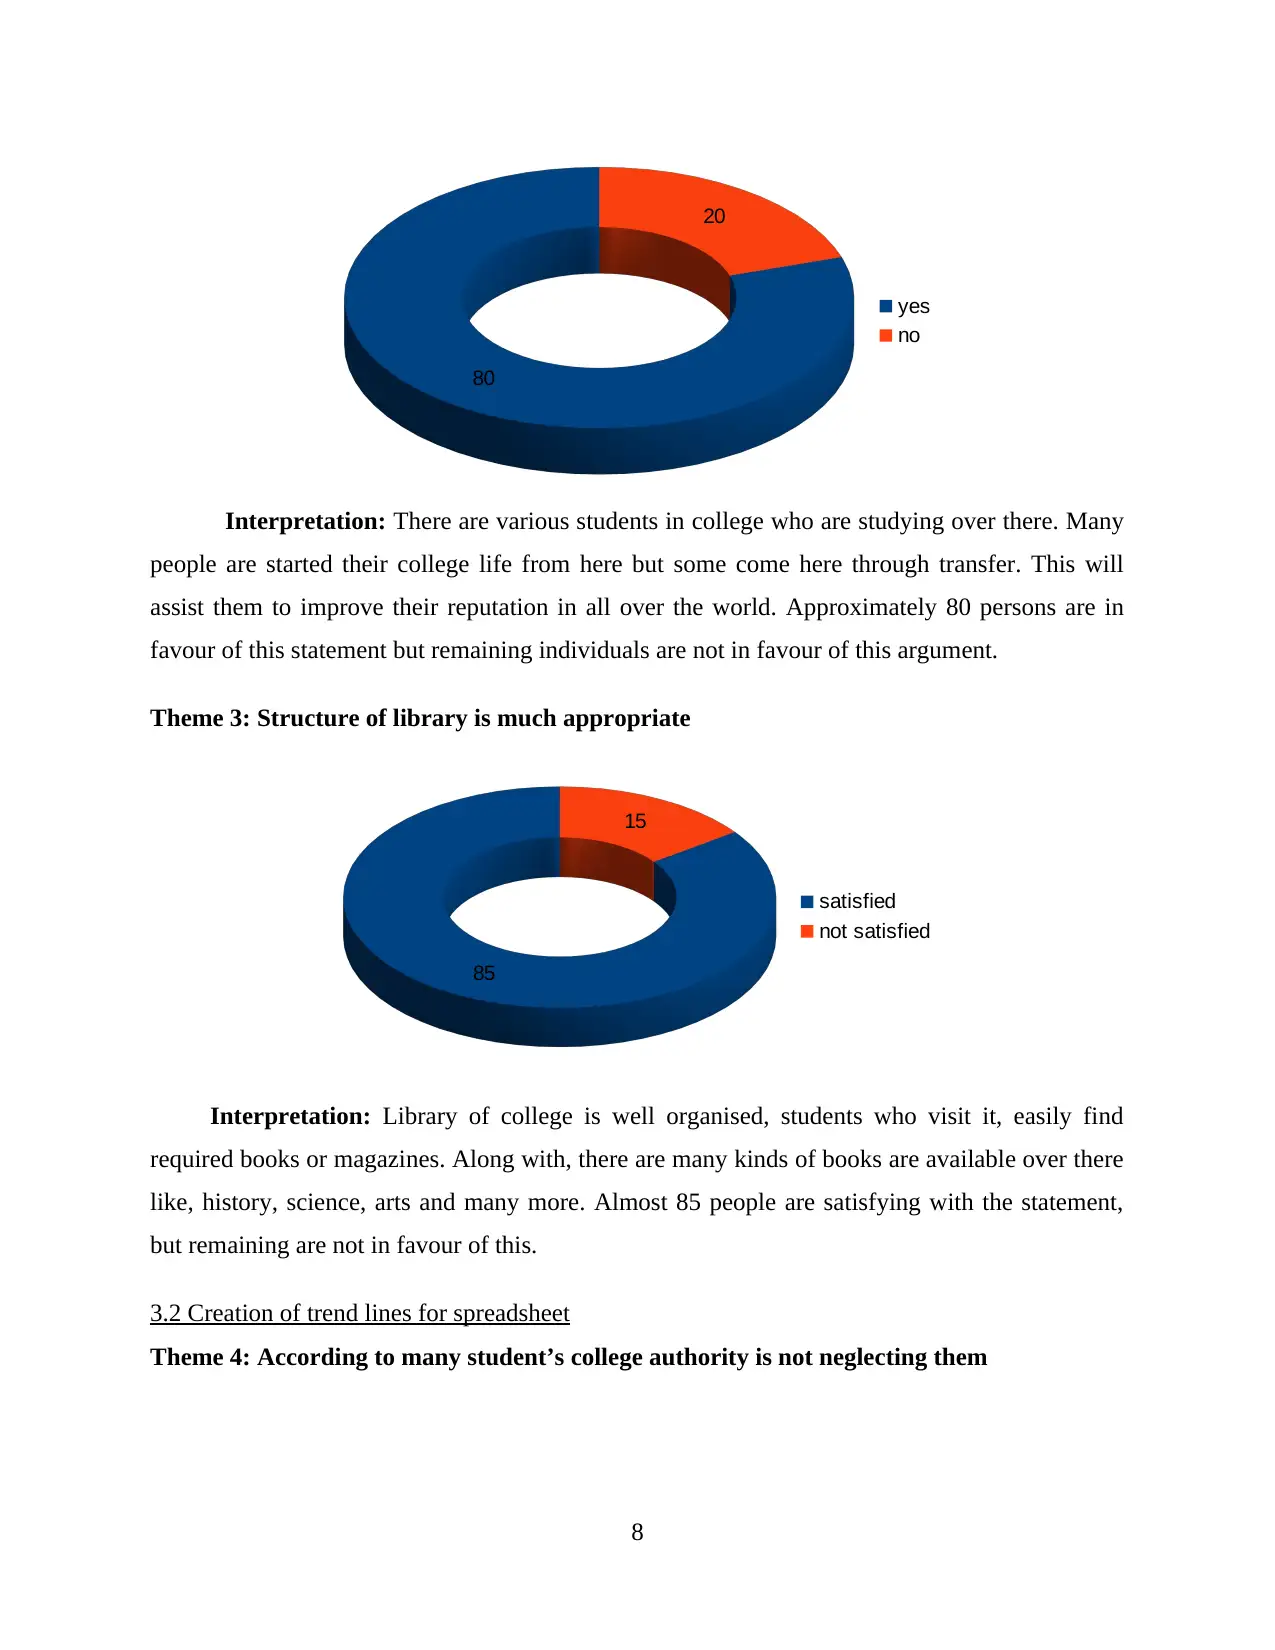
80
20
yes
no
Interpretation: There are various students in college who are studying over there. Many
people are started their college life from here but some come here through transfer. This will
assist them to improve their reputation in all over the world. Approximately 80 persons are in
favour of this statement but remaining individuals are not in favour of this argument.
Theme 3: Structure of library is much appropriate
85
15
satisfied
not satisfied
Interpretation: Library of college is well organised, students who visit it, easily find
required books or magazines. Along with, there are many kinds of books are available over there
like, history, science, arts and many more. Almost 85 people are satisfying with the statement,
but remaining are not in favour of this.
3.2 Creation of trend lines for spreadsheet
Theme 4: According to many student’s college authority is not neglecting them
8
Paraphrase This Document
Need a fresh take? Get an instant paraphrase of this document with our AI Paraphraser
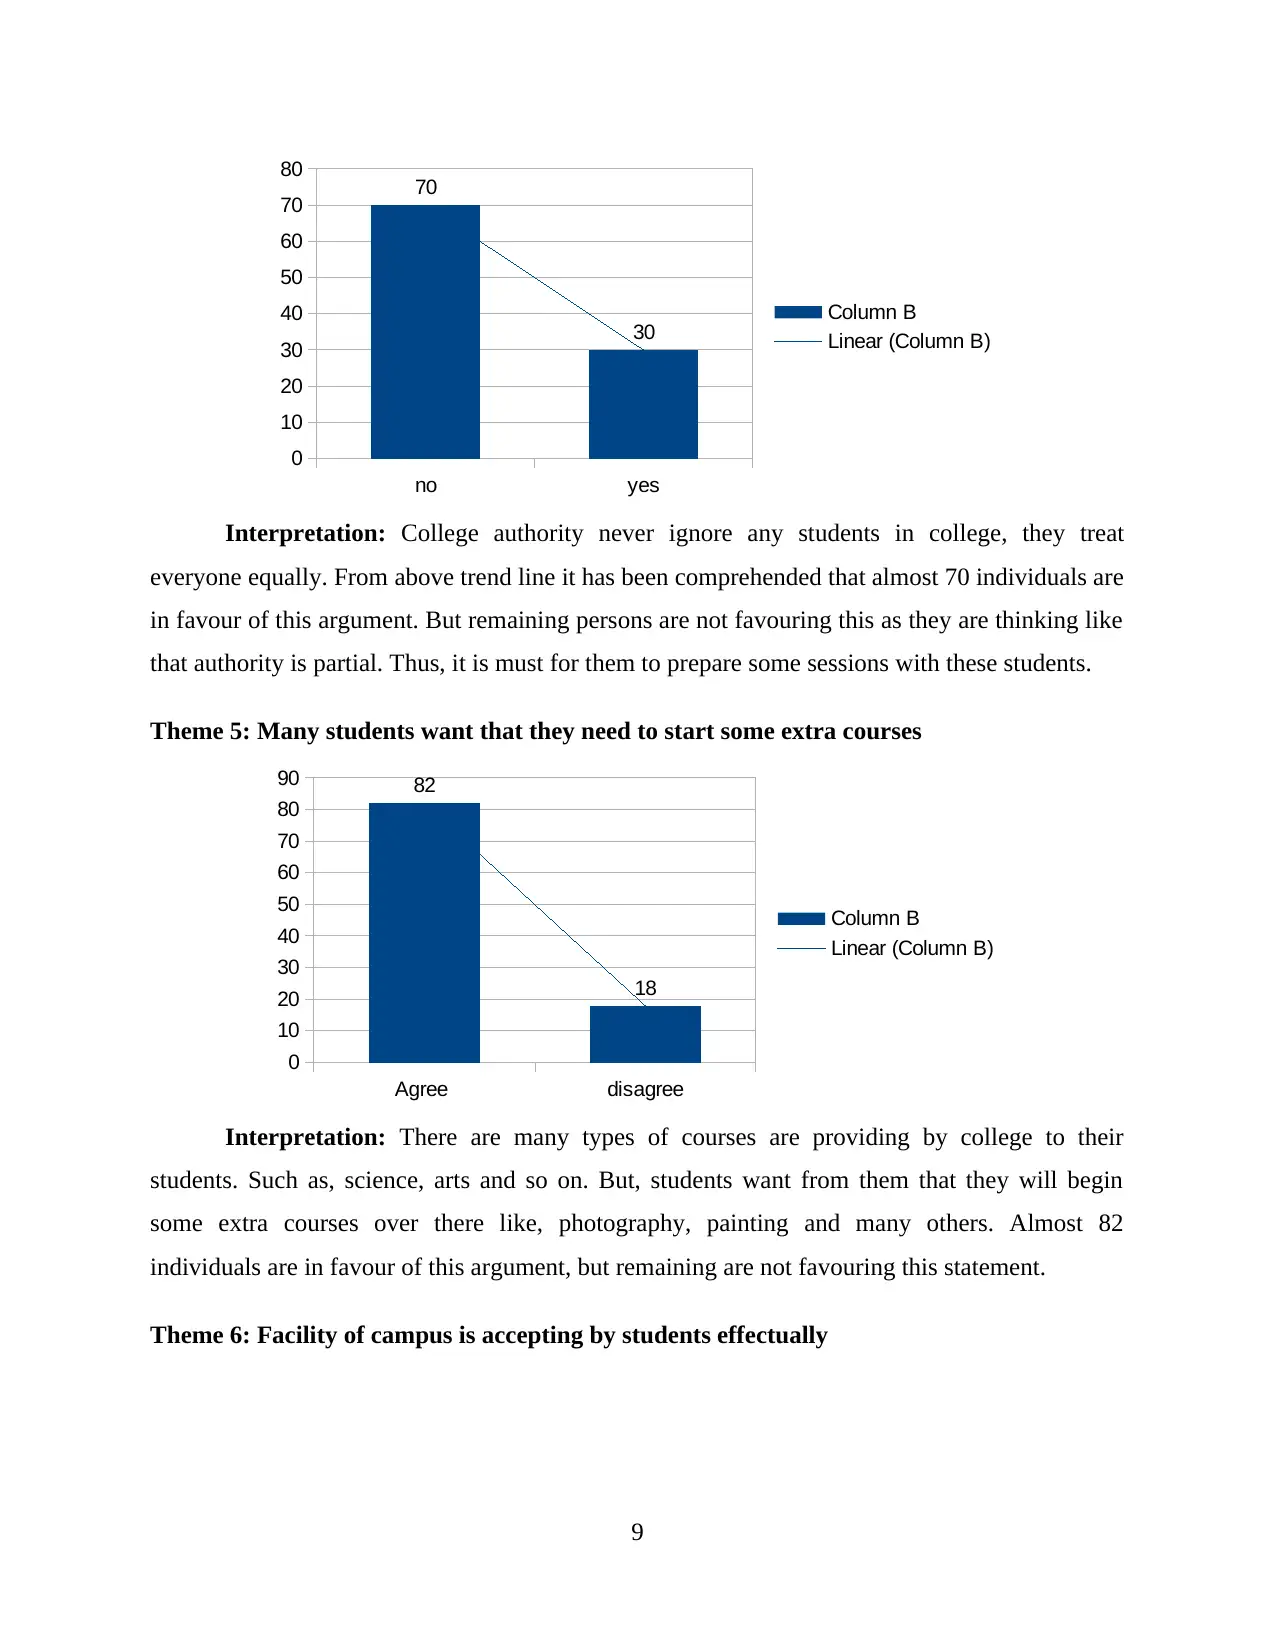
no yes
0
10
20
30
40
50
60
70
80 70
30 Column B
Linear (Column B)
Interpretation: College authority never ignore any students in college, they treat
everyone equally. From above trend line it has been comprehended that almost 70 individuals are
in favour of this argument. But remaining persons are not favouring this as they are thinking like
that authority is partial. Thus, it is must for them to prepare some sessions with these students.
Theme 5: Many students want that they need to start some extra courses
Agree disagree
0
10
20
30
40
50
60
70
80
90 82
18
Column B
Linear (Column B)
Interpretation: There are many types of courses are providing by college to their
students. Such as, science, arts and so on. But, students want from them that they will begin
some extra courses over there like, photography, painting and many others. Almost 82
individuals are in favour of this argument, but remaining are not favouring this statement.
Theme 6: Facility of campus is accepting by students effectually
9
0
10
20
30
40
50
60
70
80 70
30 Column B
Linear (Column B)
Interpretation: College authority never ignore any students in college, they treat
everyone equally. From above trend line it has been comprehended that almost 70 individuals are
in favour of this argument. But remaining persons are not favouring this as they are thinking like
that authority is partial. Thus, it is must for them to prepare some sessions with these students.
Theme 5: Many students want that they need to start some extra courses
Agree disagree
0
10
20
30
40
50
60
70
80
90 82
18
Column B
Linear (Column B)
Interpretation: There are many types of courses are providing by college to their
students. Such as, science, arts and so on. But, students want from them that they will begin
some extra courses over there like, photography, painting and many others. Almost 82
individuals are in favour of this argument, but remaining are not favouring this statement.
Theme 6: Facility of campus is accepting by students effectually
9
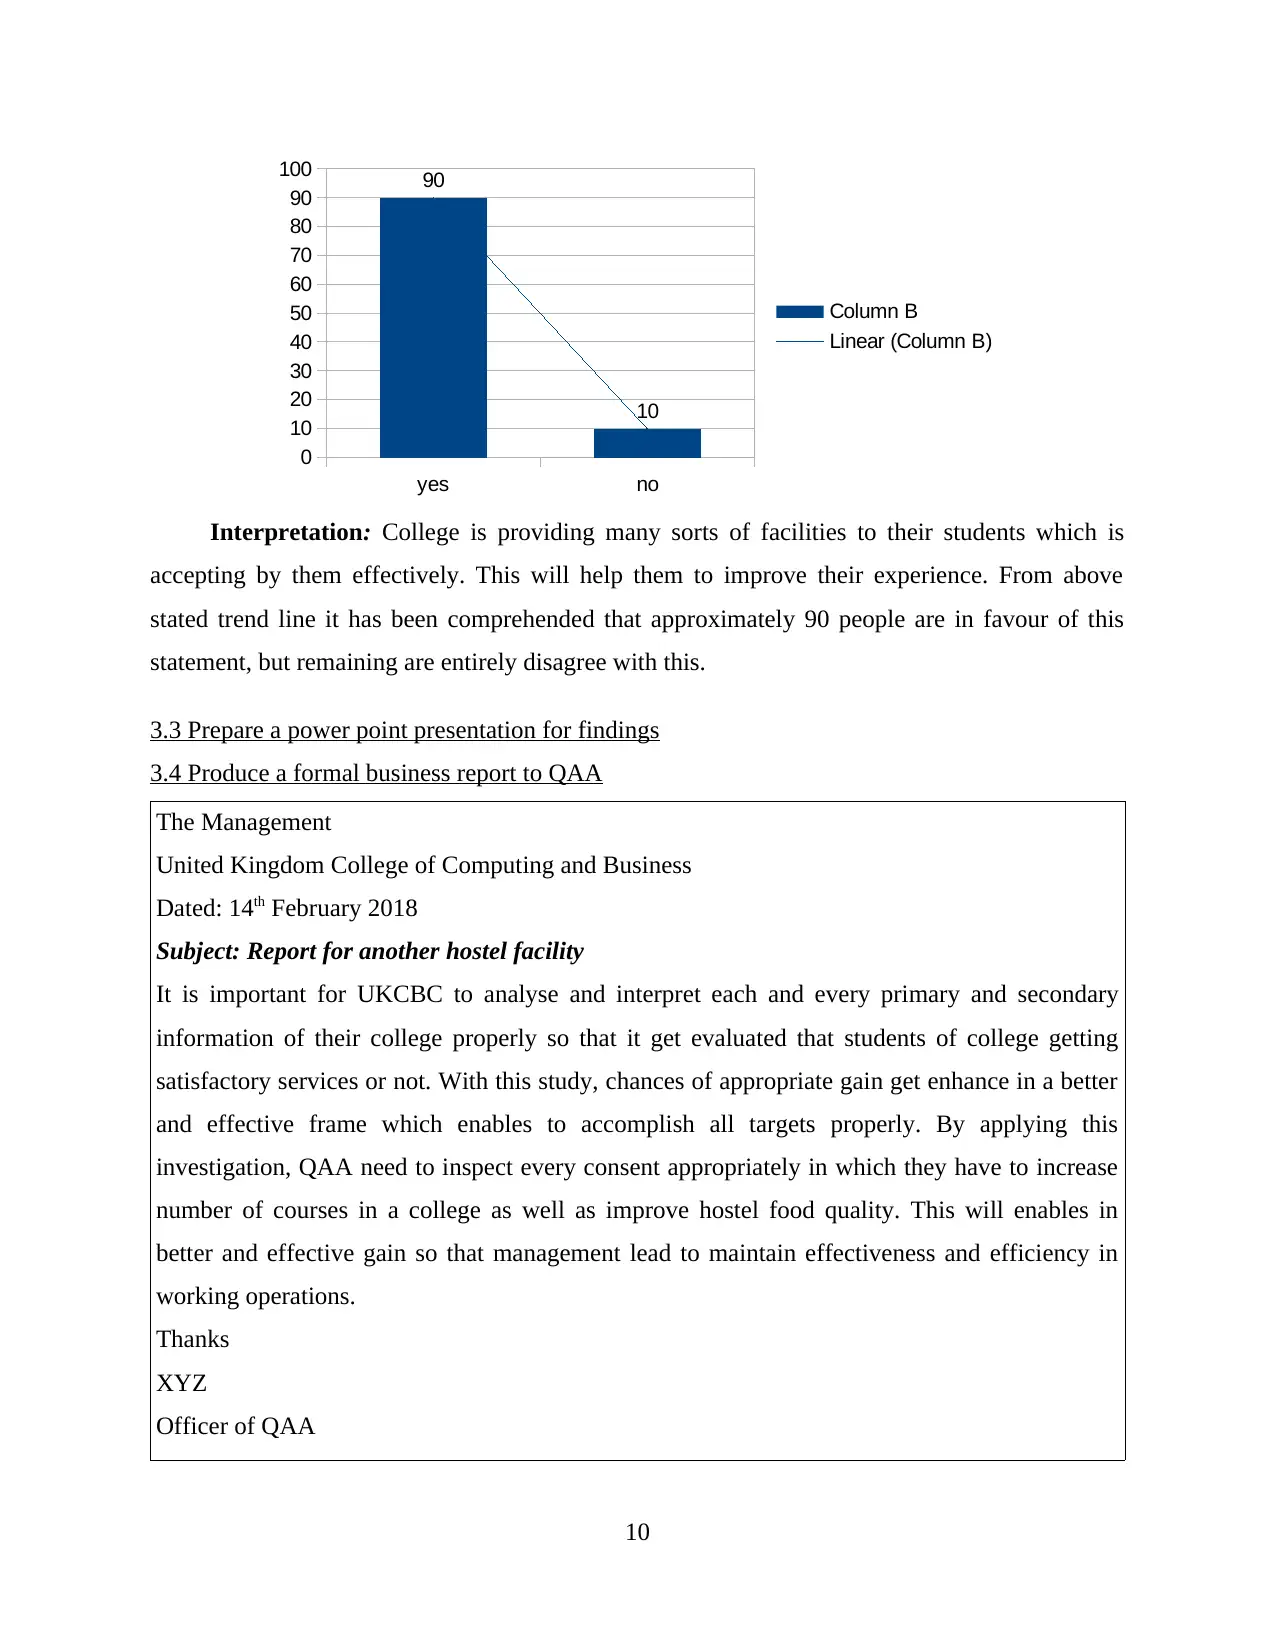
yes no
0
10
20
30
40
50
60
70
80
90
100 90
10
Column B
Linear (Column B)
Interpretation: College is providing many sorts of facilities to their students which is
accepting by them effectively. This will help them to improve their experience. From above
stated trend line it has been comprehended that approximately 90 people are in favour of this
statement, but remaining are entirely disagree with this.
3.3 Prepare a power point presentation for findings
3.4 Produce a formal business report to QAA
The Management
United Kingdom College of Computing and Business
Dated: 14th February 2018
Subject: Report for another hostel facility
It is important for UKCBC to analyse and interpret each and every primary and secondary
information of their college properly so that it get evaluated that students of college getting
satisfactory services or not. With this study, chances of appropriate gain get enhance in a better
and effective frame which enables to accomplish all targets properly. By applying this
investigation, QAA need to inspect every consent appropriately in which they have to increase
number of courses in a college as well as improve hostel food quality. This will enables in
better and effective gain so that management lead to maintain effectiveness and efficiency in
working operations.
Thanks
XYZ
Officer of QAA
10
⊘ This is a preview!⊘
Do you want full access?
Subscribe today to unlock all pages.
Trusted by 1+ million students worldwide
1 out of 19
Related Documents


Your All-in-One AI-Powered Toolkit for Academic Success.
+13062052269
info@desklib.com
Available 24*7 on WhatsApp / Email
![[object Object]](/_next/static/media/star-bottom.7253800d.svg)
Unlock your academic potential
Copyright © 2020–2026 A2Z Services. All Rights Reserved. Developed and managed by ZUCOL.