UKCBC Student Experience and Satisfaction Report
VerifiedAdded on 2020/01/07
|24
|5456
|477
Report
AI Summary
This report details a comprehensive survey conducted to assess student experience and satisfaction at UKCBC. It includes a plan for data collection across campuses, the survey methodology, and a designed questionnaire. The report further analyzes the collected data using statistical methods like mean, median, mode, and dispersion. It interprets the findings through thematic analysis and trend lines, culminating in a report on the organization's performance. The document also explores information processing tools, project planning, and investment appraisal techniques, providing a holistic view of business decision-making within the context of UKCBC's operations and student satisfaction.
Business Decision
Making
1
Making
1
Paraphrase This Document
Need a fresh take? Get an instant paraphrase of this document with our AI Paraphraser
Table of Contents
INTRODUCTION...........................................................................................................................3
TASK 1............................................................................................................................................3
1.1 Plan or schedule for collecting data from the students of UKCBC.......................................3
1.2 Survey methodology along with the sampling methods........................................................4
1.3 Questionnaire for data collection process..............................................................................5
TASK 2............................................................................................................................................6
a) Summary on collected data......................................................................................................6
b) Data interpretation...................................................................................................................7
c) Data estimation using dispersion.............................................................................................8
d) Quartiles, percentile and correlation........................................................................................8
TASK 3............................................................................................................................................9
a) Data interpretation...................................................................................................................9
b) Trend line method..................................................................................................................12
c) Power point presentation on findings....................................................................................14
d) Report on organization's performance...................................................................................14
TASK 4..........................................................................................................................................14
a) Information processing tools.................................................................................................14
b) Project plan/ activity and critical path method......................................................................15
c) Investment appraisal techniques............................................................................................18
CONCLUSION..............................................................................................................................19
REFERENCE.................................................................................................................................20
2
INTRODUCTION
Business decision making is a process for planning and forecasting further activities to be
implemented for organization's effectiveness. It is helpful for making decisions and preparing
strategies for adequate allocation of resources and fund as well presenting actual performance of
entity. The present report is based on understanding decision making tool for UKCBC to analyze
college's quality services and students' satisfaction level. It is regarding to recognize different
campuses and courses to prepare report for Quality Assurance Agency (QAA) that is coming in
few next few months. Various data collection methods and sampling frame for questionnaire is
to be described. In addition to this, measurement and estimations on data collection including
mean, median, mode, dispersion is to be expressed that affects decision making process for
UKCBC. However, attractive presentation on students' views and organization's performance can
be presented through this assignment. Including this, several information processing tools are to
introduced for transferring and communicating information for decision making process. Besides
this, investment appraisal techniques involving net present value, internal rate of return kinds of
terms can be presented that is essential to select appropriate project for further investment. Thus,
learners are able to understand different aspects and significance of decision making process for
operating business activities in future time through this report.
TASK 1
1.1 Plan or schedule for collecting data from the students of UKCBC
Data are the basic source of the research which plays role of raw material for the scholar
in order to analyses about the research problem and determine solution about it. Due to such
reasons data collection is one of the highly important aspects in which different sources and
types are to be used. At the present case study, performance of the UKCBC college reduces due
to declining number of students. For identifying causes and accountable factors for declining the
college performance ion London current research is to be arranged and conducted. When talking
about the data then there are basically two types of data like primary and secondary (Popovič
and et.al., 2012). Those information which are gathered by researcher at the first time are called
primary data whereas already published and analyzed data are when gathered then considered as
secondary data. To collect primary data different sources are available like interviews,
3
⊘ This is a preview!⊘
Do you want full access?
Subscribe today to unlock all pages.
Trusted by 1+ million students worldwide
questionnaire, group discussion etc. On the other side sources of secondary data collection are
such as publications, articles, journals, books, annual report of college, newspapers etc.
In the current case, primary data will be collected by the scholar because it provides
reliable and appropriate information about the problems. The source which will be used for
gather primary data is questionnaire in which different questions will frame after considering the
problem of UKCBC. The questionnaire will be framed and then distributed among the students
which helps to determine their views regarding to the college performance (Craft, 2013). The
reason for selecting the particular primary data source is that scholar able to interact with
students and assess facts and figures regarding the current problem of UKCBC college. On the
basis of the collected data from students the researcher make analysis about the accountable
factors and then frame strategy to attract higher number of students towards it.
1.2 Survey methodology along with the sampling methods
In order to conduct survey about the research problem then different methods are
available there which helps to scholar for analyse in effectual manner. At the current study,
online survey methodology will be used by the investigator in which farmed questionnaire will
be distributed using the online and internet. For this social media sites as well as direct email
system will be used for distributing and sending the questionnaire which takes very less time.
Apart from this, feedback are also taken from students using the same method like online ( Isik,
Jones and Sidorova, 2013).
Moreover, in the college there is huge number of students are available and among whole
questionnaire cannot distributed. For reducing such problem sample data are taken where some
students are selected and then questionnaire will be provided in them. For sampling there are
simple random, cluster, convenience, stratified etc. methods are available which supports to
determine the sample data in appropriate ways. In the current study of UKCBC college research
use simple random sampling method in which any type of the frameworks and parameters are
not there. Randomly the students are selected and then questionnaire are to be provide between
them at the current research. Further, through this method sample of 40 students is to be taken
among whole available within UKCBC college (Mulley and et. al., 2013).
4
Paraphrase This Document
Need a fresh take? Get an instant paraphrase of this document with our AI Paraphraser
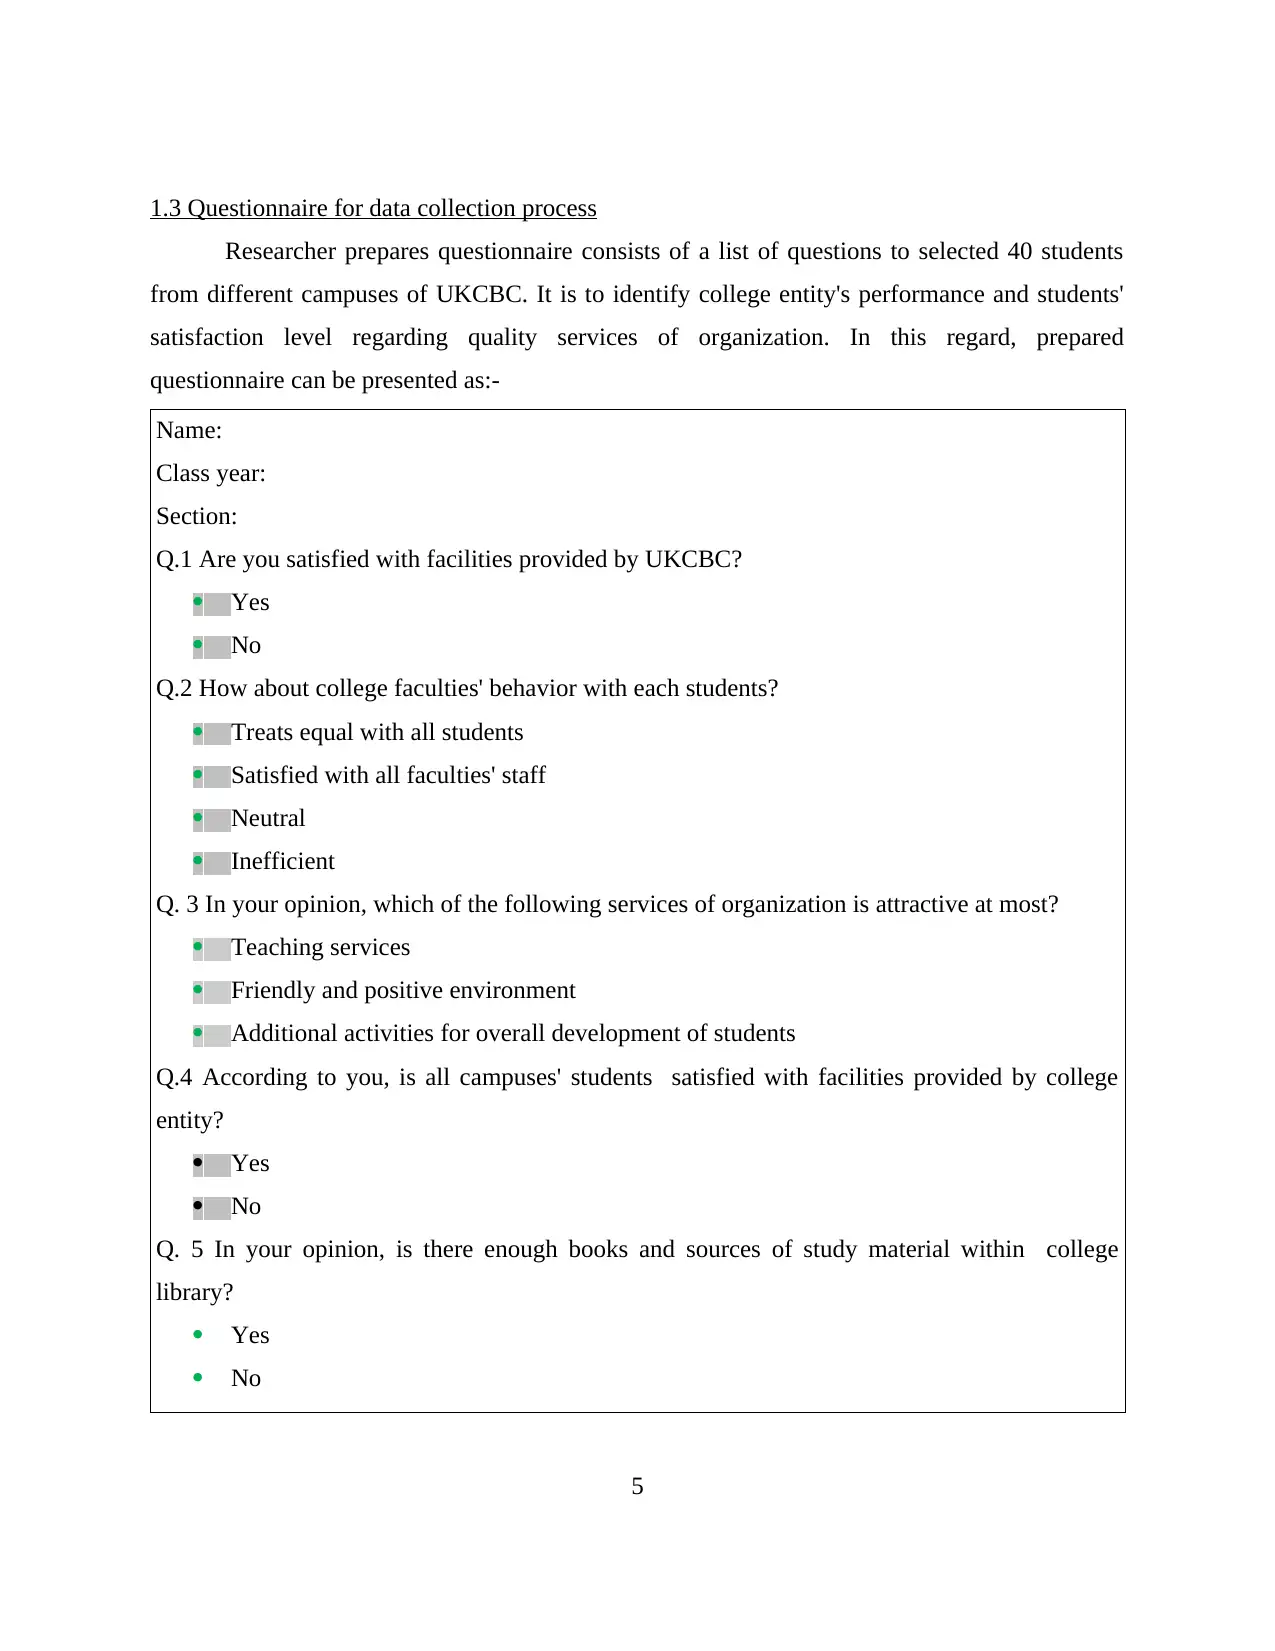
1.3 Questionnaire for data collection process
Researcher prepares questionnaire consists of a list of questions to selected 40 students
from different campuses of UKCBC. It is to identify college entity's performance and students'
satisfaction level regarding quality services of organization. In this regard, prepared
questionnaire can be presented as:-
Name:
Class year:
Section:
Q.1 Are you satisfied with facilities provided by UKCBC?
Yes
No
Q.2 How about college faculties' behavior with each students?
Treats equal with all students
Satisfied with all faculties' staff
Neutral
Inefficient
Q. 3 In your opinion, which of the following services of organization is attractive at most?
Teaching services
Friendly and positive environment
Additional activities for overall development of students
Q.4 According to you, is all campuses' students satisfied with facilities provided by college
entity?
Yes
No
Q. 5 In your opinion, is there enough books and sources of study material within college
library?
Yes
No
5
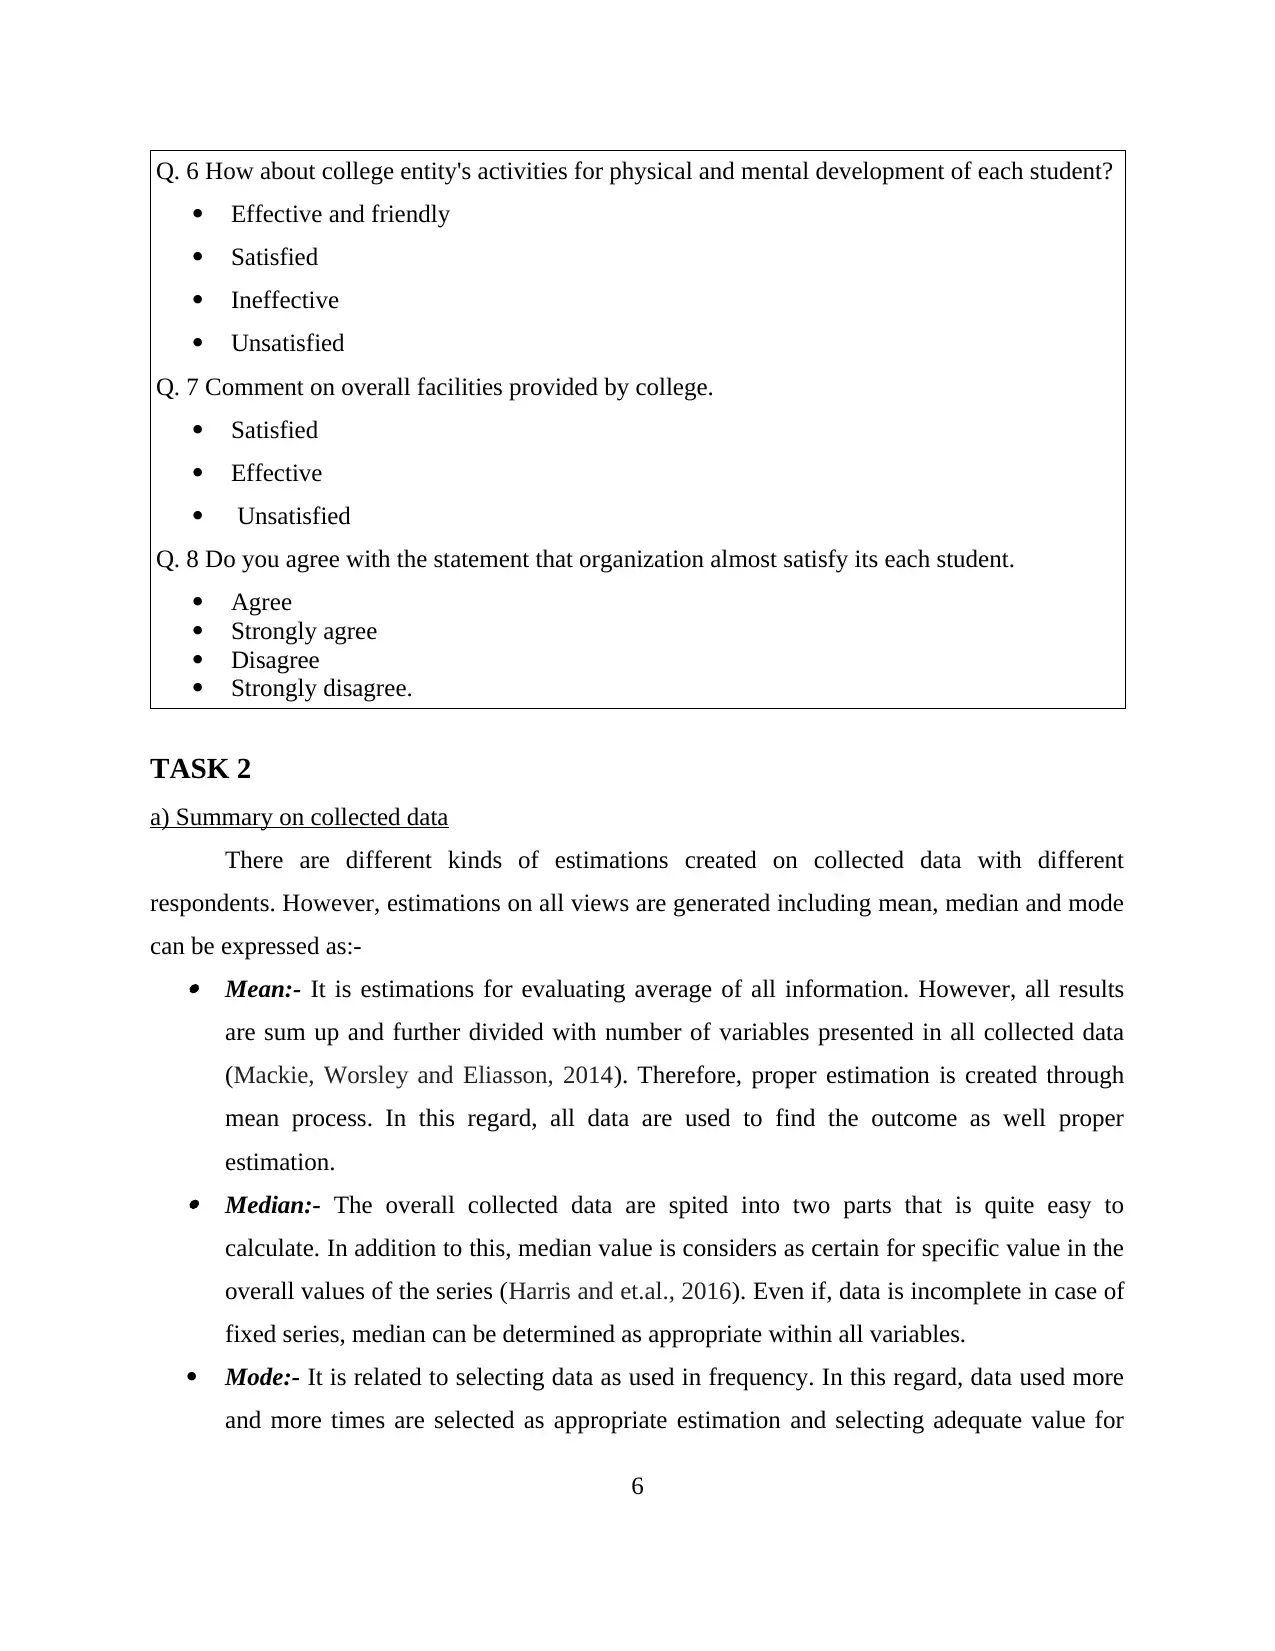
Q. 6 How about college entity's activities for physical and mental development of each student?
Effective and friendly
Satisfied
Ineffective
Unsatisfied
Q. 7 Comment on overall facilities provided by college.
Satisfied
Effective
Unsatisfied
Q. 8 Do you agree with the statement that organization almost satisfy its each student.
Agree
Strongly agree
Disagree
Strongly disagree.
TASK 2
a) Summary on collected data
There are different kinds of estimations created on collected data with different
respondents. However, estimations on all views are generated including mean, median and mode
can be expressed as:- Mean:- It is estimations for evaluating average of all information. However, all results
are sum up and further divided with number of variables presented in all collected data
(Mackie, Worsley and Eliasson, 2014). Therefore, proper estimation is created through
mean process. In this regard, all data are used to find the outcome as well proper
estimation. Median:- The overall collected data are spited into two parts that is quite easy to
calculate. In addition to this, median value is considers as certain for specific value in the
overall values of the series (Harris and et.al., 2016). Even if, data is incomplete in case of
fixed series, median can be determined as appropriate within all variables.
Mode:- It is related to selecting data as used in frequency. In this regard, data used more
and more times are selected as appropriate estimation and selecting adequate value for
6
⊘ This is a preview!⊘
Do you want full access?
Subscribe today to unlock all pages.
Trusted by 1+ million students worldwide
further decision making and planning regarding UKCBC (Martinsuo, 2013). It is simple
and popular manner for estimating proper information. Thus, mode is one of the great
method for data interpretation and selecting best solution for further operations.
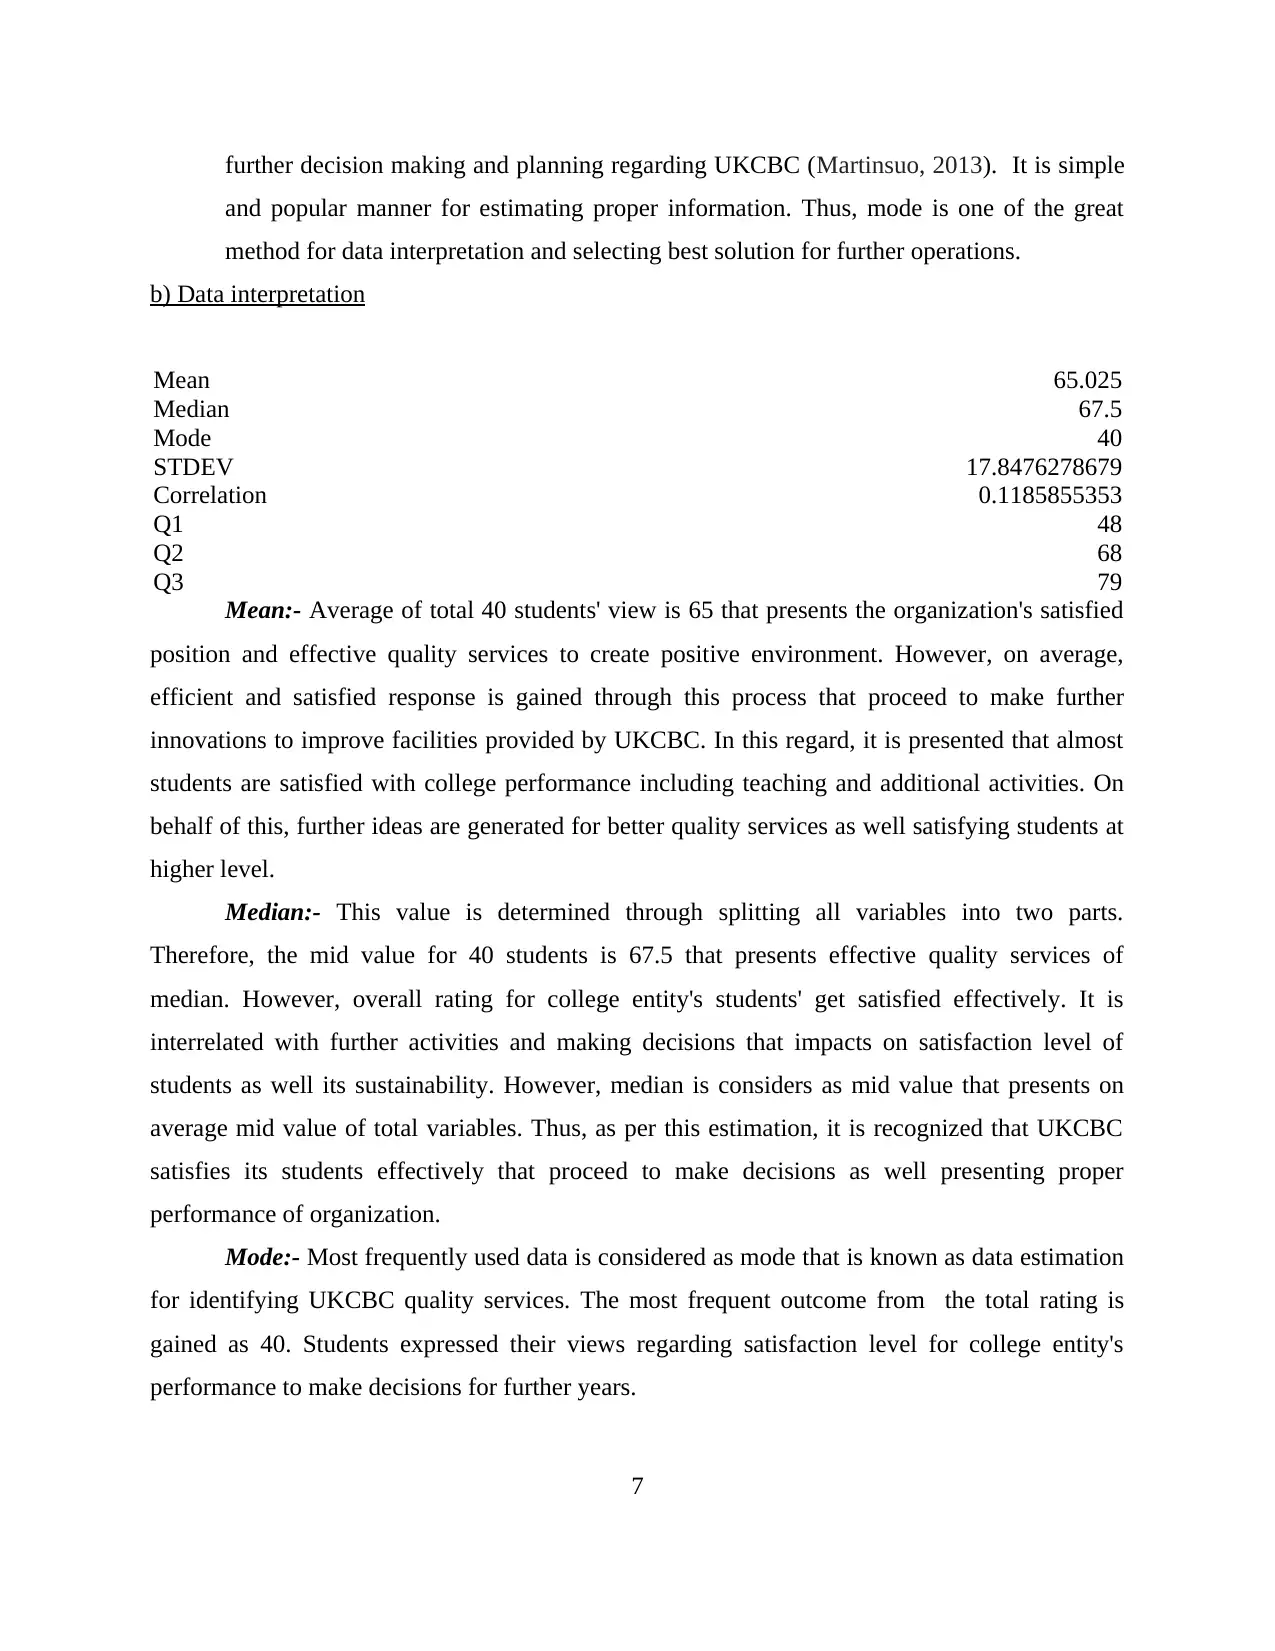
b) Data interpretation
Mean 65.025
Median 67.5
Mode 40
STDEV 17.8476278679
Correlation 0.1185855353
Q1 48
Q2 68
Q3 79
Mean:- Average of total 40 students' view is 65 that presents the organization's satisfied
position and effective quality services to create positive environment. However, on average,
efficient and satisfied response is gained through this process that proceed to make further
innovations to improve facilities provided by UKCBC. In this regard, it is presented that almost
students are satisfied with college performance including teaching and additional activities. On
behalf of this, further ideas are generated for better quality services as well satisfying students at
higher level.
Median:- This value is determined through splitting all variables into two parts.
Therefore, the mid value for 40 students is 67.5 that presents effective quality services of
median. However, overall rating for college entity's students' get satisfied effectively. It is
interrelated with further activities and making decisions that impacts on satisfaction level of
students as well its sustainability. However, median is considers as mid value that presents on
average mid value of total variables. Thus, as per this estimation, it is recognized that UKCBC
satisfies its students effectively that proceed to make decisions as well presenting proper
performance of organization.
Mode:- Most frequently used data is considered as mode that is known as data estimation
for identifying UKCBC quality services. The most frequent outcome from the total rating is
gained as 40. Students expressed their views regarding satisfaction level for college entity's
performance to make decisions for further years.
7
and popular manner for estimating proper information. Thus, mode is one of the great
method for data interpretation and selecting best solution for further operations.
b) Data interpretation
Mean 65.025
Median 67.5
Mode 40
STDEV 17.8476278679
Correlation 0.1185855353
Q1 48
Q2 68
Q3 79
Mean:- Average of total 40 students' view is 65 that presents the organization's satisfied
position and effective quality services to create positive environment. However, on average,
efficient and satisfied response is gained through this process that proceed to make further
innovations to improve facilities provided by UKCBC. In this regard, it is presented that almost
students are satisfied with college performance including teaching and additional activities. On
behalf of this, further ideas are generated for better quality services as well satisfying students at
higher level.
Median:- This value is determined through splitting all variables into two parts.
Therefore, the mid value for 40 students is 67.5 that presents effective quality services of
median. However, overall rating for college entity's students' get satisfied effectively. It is
interrelated with further activities and making decisions that impacts on satisfaction level of
students as well its sustainability. However, median is considers as mid value that presents on
average mid value of total variables. Thus, as per this estimation, it is recognized that UKCBC
satisfies its students effectively that proceed to make decisions as well presenting proper
performance of organization.
Mode:- Most frequently used data is considered as mode that is known as data estimation
for identifying UKCBC quality services. The most frequent outcome from the total rating is
gained as 40. Students expressed their views regarding satisfaction level for college entity's
performance to make decisions for further years.
7
Paraphrase This Document
Need a fresh take? Get an instant paraphrase of this document with our AI Paraphraser
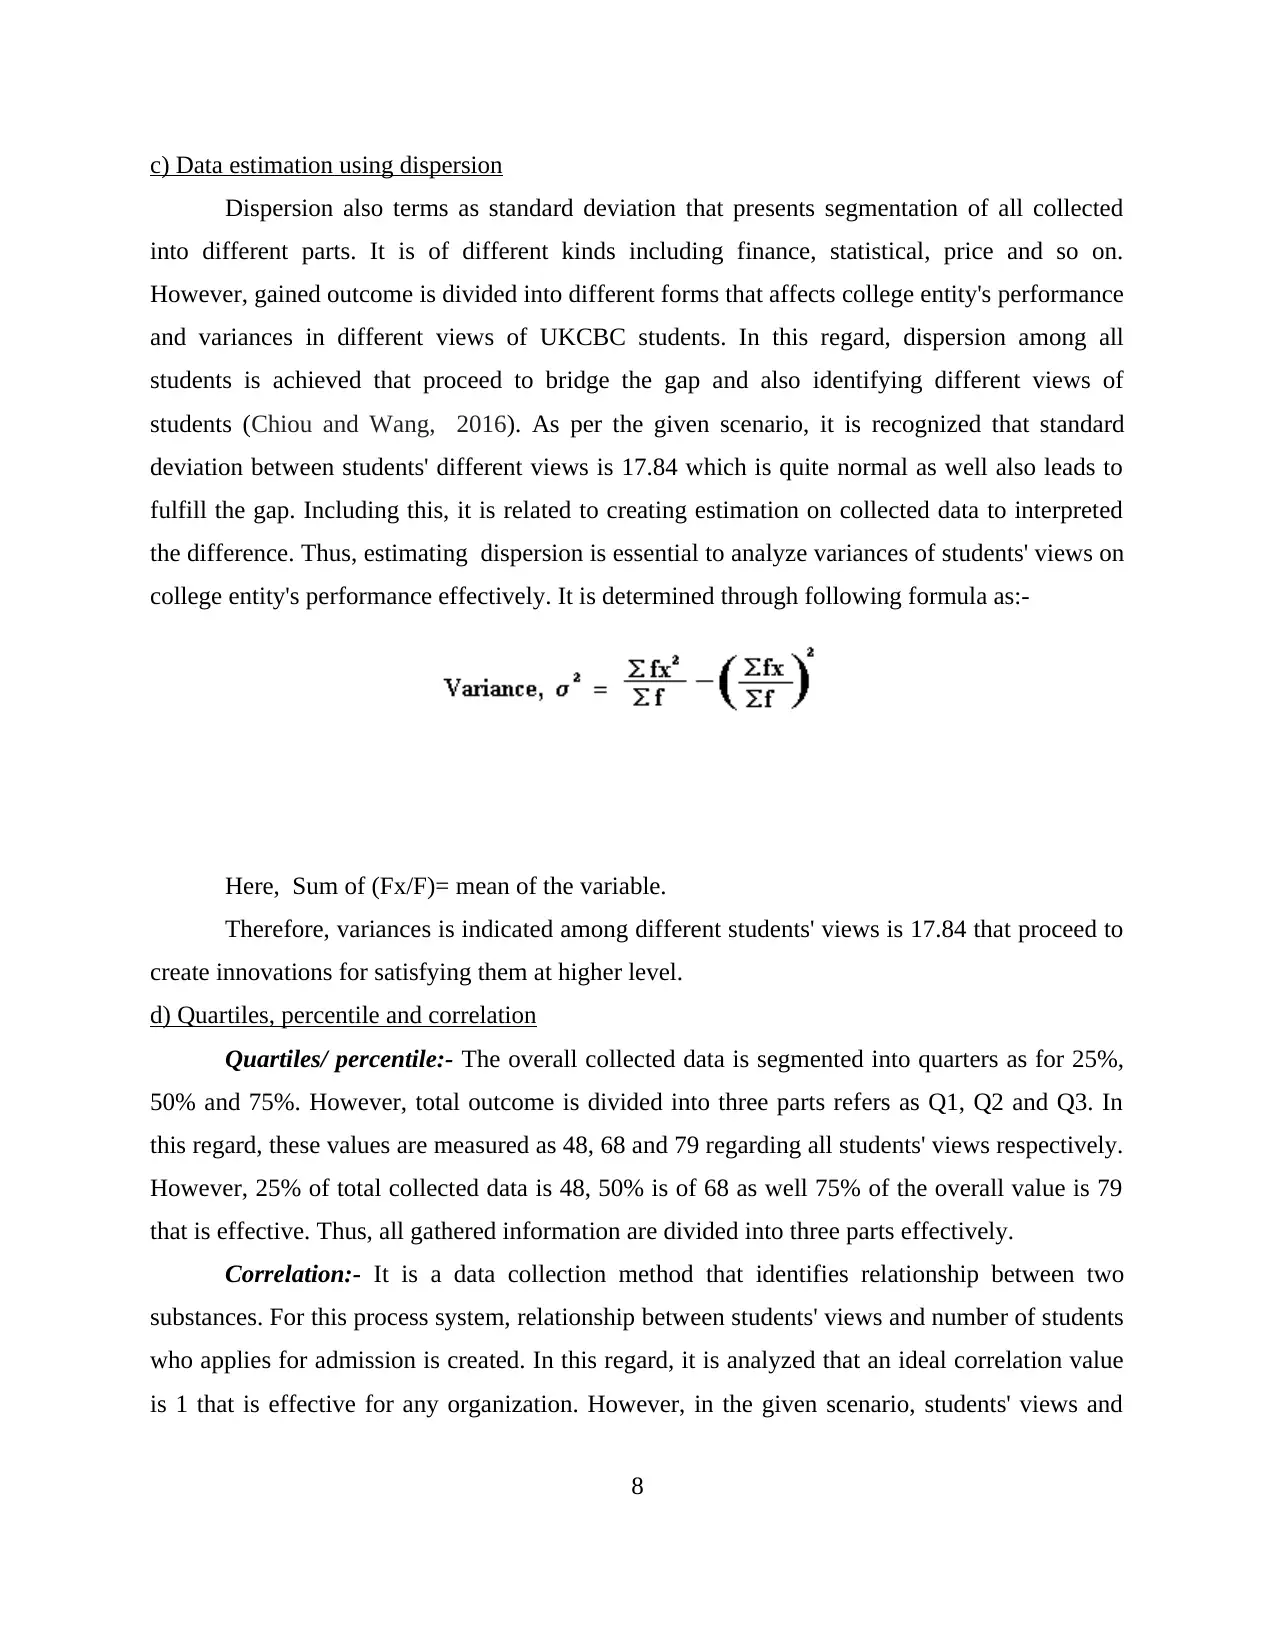
c) Data estimation using dispersion
Dispersion also terms as standard deviation that presents segmentation of all collected
into different parts. It is of different kinds including finance, statistical, price and so on.
However, gained outcome is divided into different forms that affects college entity's performance
and variances in different views of UKCBC students. In this regard, dispersion among all
students is achieved that proceed to bridge the gap and also identifying different views of
students (Chiou and Wang, 2016). As per the given scenario, it is recognized that standard
deviation between students' different views is 17.84 which is quite normal as well also leads to
fulfill the gap. Including this, it is related to creating estimation on collected data to interpreted
the difference. Thus, estimating dispersion is essential to analyze variances of students' views on
college entity's performance effectively. It is determined through following formula as:-
Here, Sum of (Fx/F)= mean of the variable.
Therefore, variances is indicated among different students' views is 17.84 that proceed to
create innovations for satisfying them at higher level.
d) Quartiles, percentile and correlation
Quartiles/ percentile:- The overall collected data is segmented into quarters as for 25%,
50% and 75%. However, total outcome is divided into three parts refers as Q1, Q2 and Q3. In
this regard, these values are measured as 48, 68 and 79 regarding all students' views respectively.
However, 25% of total collected data is 48, 50% is of 68 as well 75% of the overall value is 79
that is effective. Thus, all gathered information are divided into three parts effectively.
Correlation:- It is a data collection method that identifies relationship between two
substances. For this process system, relationship between students' views and number of students
who applies for admission is created. In this regard, it is analyzed that an ideal correlation value
is 1 that is effective for any organization. However, in the given scenario, students' views and
8
number of admissions are linked as 0.11 that is positive but not so effective for entity's
effectiveness. Thus, it is needed for organization to create link between two substances for
further decisions making and identifying actual performance of organization.
TASK 3
a) Data interpretation
Thematic analysis
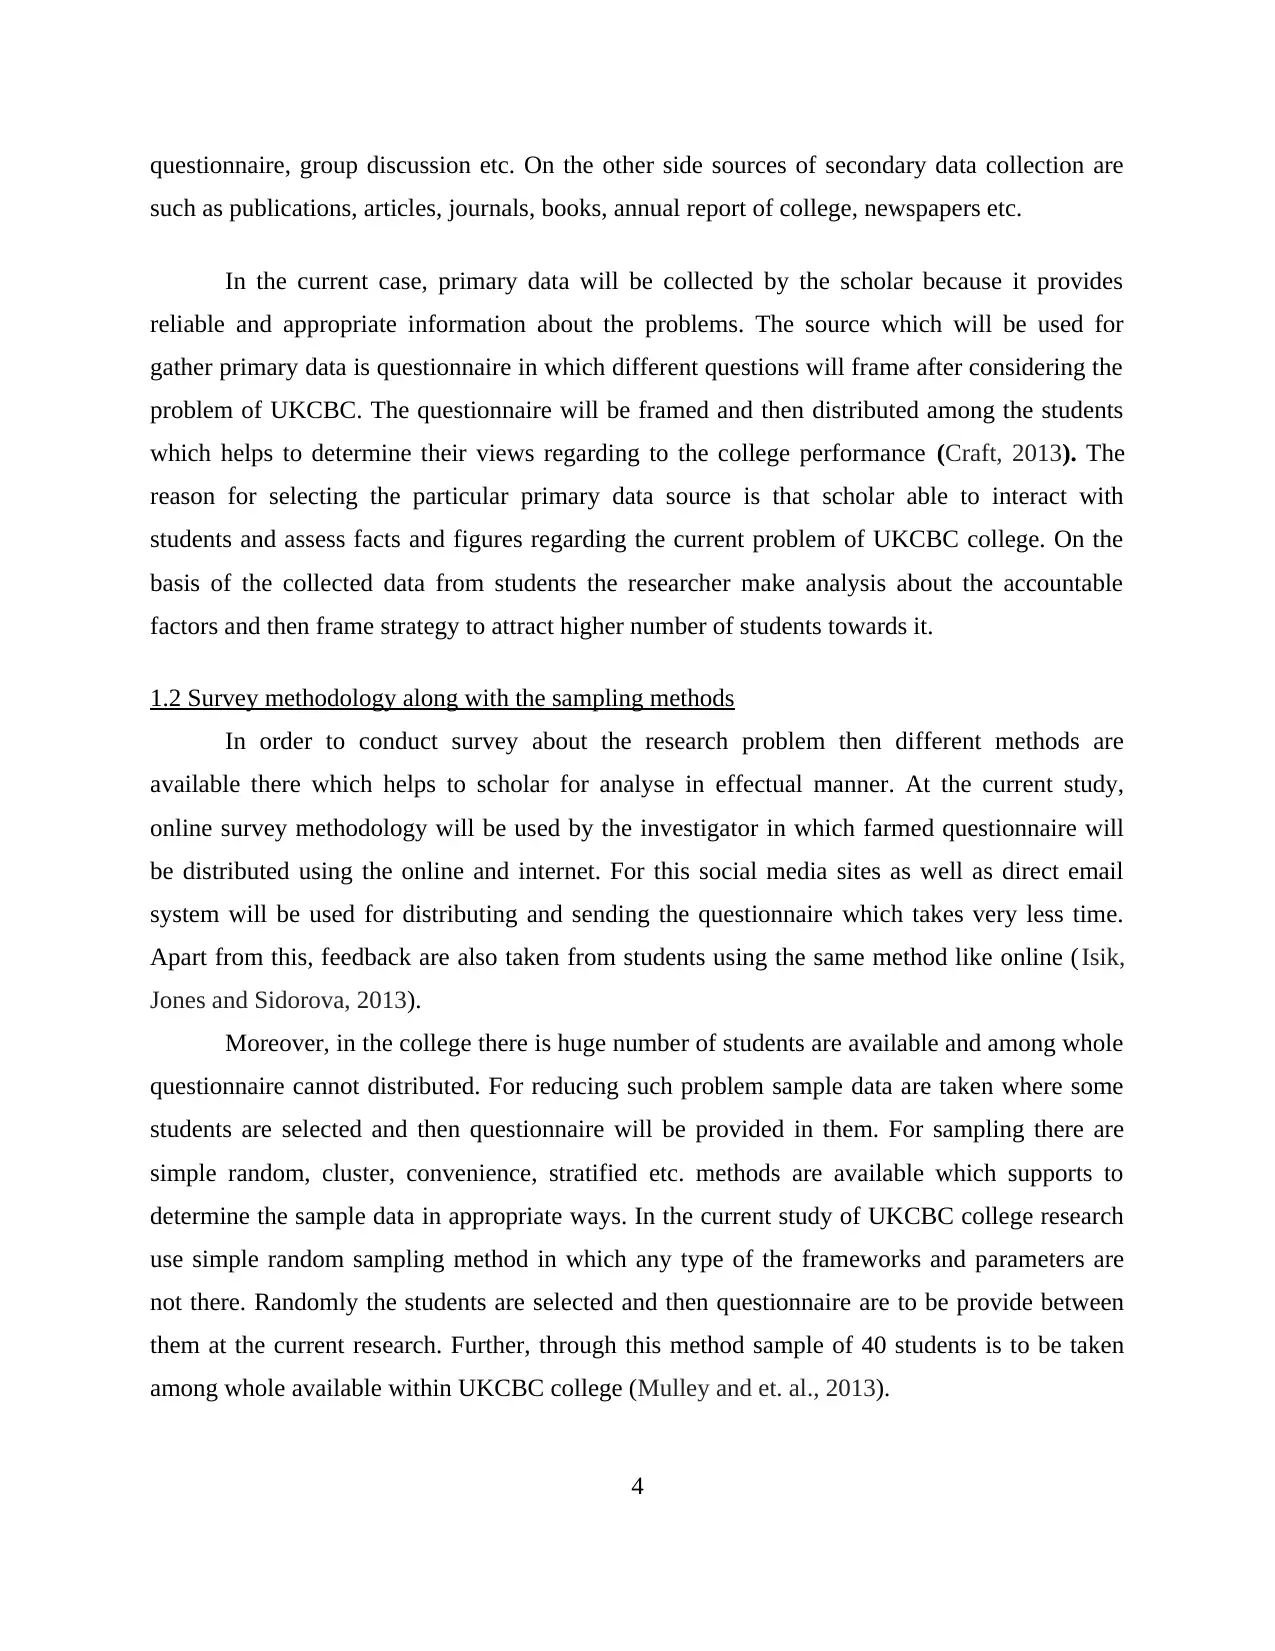
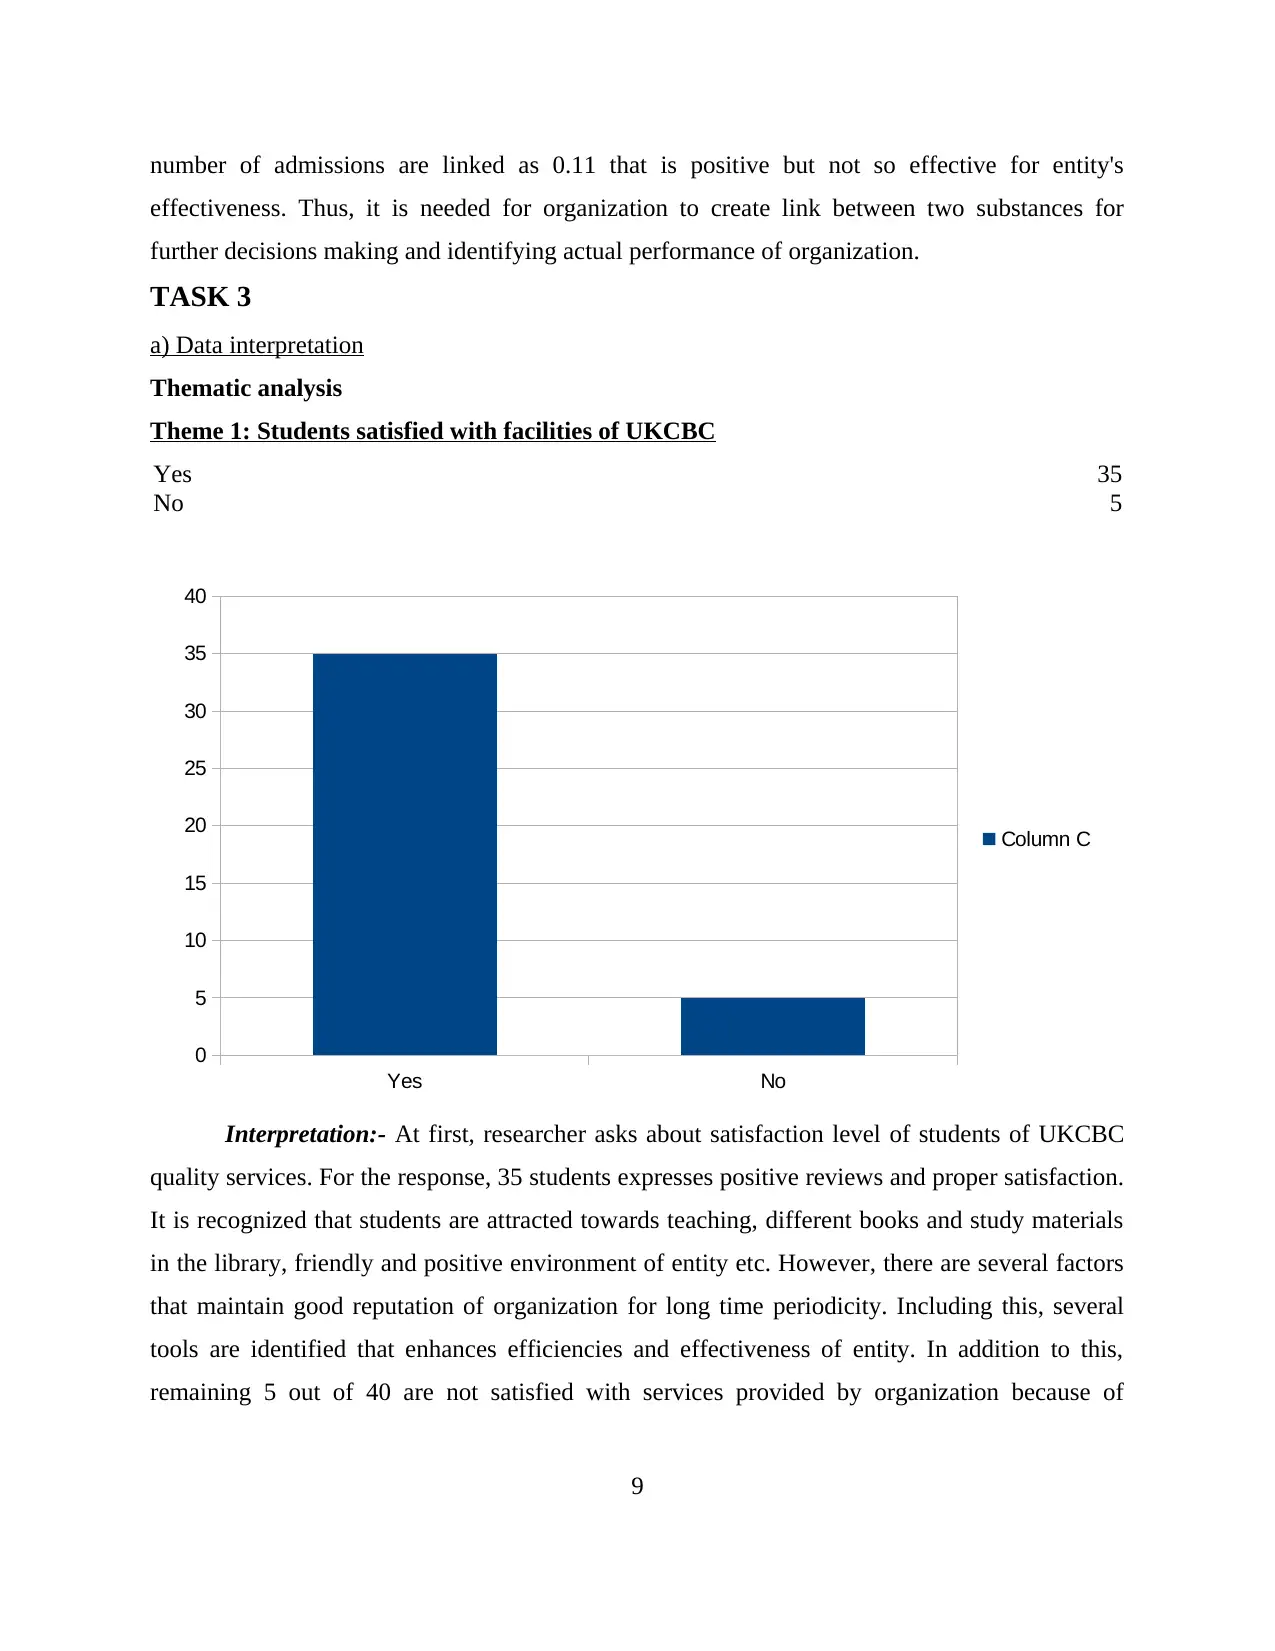
Theme 1: Students satisfied with facilities of UKCBC
Yes 35
No 5
Interpretation:- At first, researcher asks about satisfaction level of students of UKCBC
quality services. For the response, 35 students expresses positive reviews and proper satisfaction.
It is recognized that students are attracted towards teaching, different books and study materials
in the library, friendly and positive environment of entity etc. However, there are several factors
that maintain good reputation of organization for long time periodicity. Including this, several
tools are identified that enhances efficiencies and effectiveness of entity. In addition to this,
remaining 5 out of 40 are not satisfied with services provided by organization because of
9
Yes No
0
5
10
15
20
25
30
35
40
Column C
effectiveness. Thus, it is needed for organization to create link between two substances for
further decisions making and identifying actual performance of organization.
TASK 3
a) Data interpretation
Thematic analysis
Theme 1: Students satisfied with facilities of UKCBC
Yes 35
No 5
Interpretation:- At first, researcher asks about satisfaction level of students of UKCBC
quality services. For the response, 35 students expresses positive reviews and proper satisfaction.
It is recognized that students are attracted towards teaching, different books and study materials
in the library, friendly and positive environment of entity etc. However, there are several factors
that maintain good reputation of organization for long time periodicity. Including this, several
tools are identified that enhances efficiencies and effectiveness of entity. In addition to this,
remaining 5 out of 40 are not satisfied with services provided by organization because of
9
Yes No
0
5
10
15
20
25
30
35
40
Column C
⊘ This is a preview!⊘
Do you want full access?
Subscribe today to unlock all pages.
Trusted by 1+ million students worldwide
disputes and they think like all faculties do not focus on each student. Therefore, it is necessary
for organization to concentrate on this determinant to get 100% satisfaction from each and every
student of the entity.
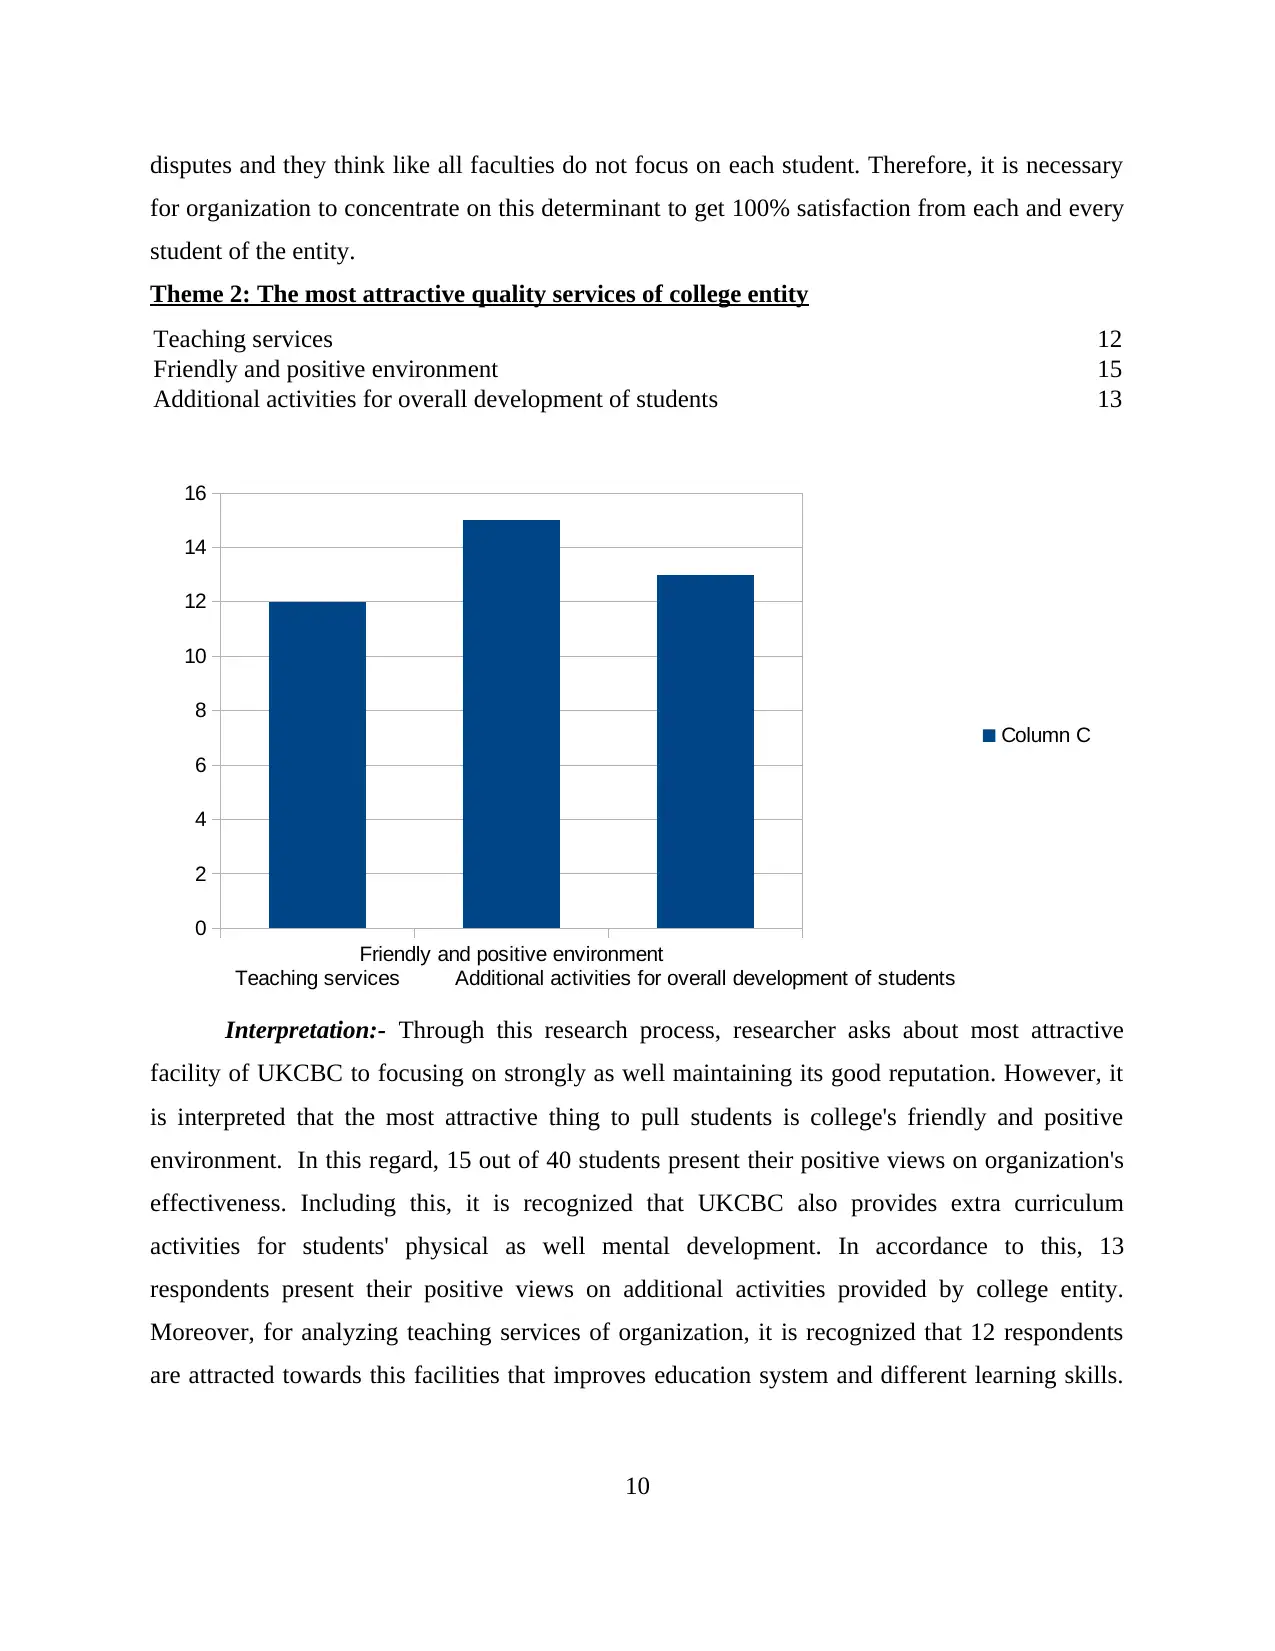
Theme 2: The most attractive quality services of college entity
Teaching services 12
Friendly and positive environment 15
Additional activities for overall development of students 13
Interpretation:- Through this research process, researcher asks about most attractive
facility of UKCBC to focusing on strongly as well maintaining its good reputation. However, it
is interpreted that the most attractive thing to pull students is college's friendly and positive
environment. In this regard, 15 out of 40 students present their positive views on organization's
effectiveness. Including this, it is recognized that UKCBC also provides extra curriculum
activities for students' physical as well mental development. In accordance to this, 13
respondents present their positive views on additional activities provided by college entity.
Moreover, for analyzing teaching services of organization, it is recognized that 12 respondents
are attracted towards this facilities that improves education system and different learning skills.
10
Teaching services
Friendly and positive environment
Additional activities for overall development of students
0
2
4
6
8
10
12
14
16
Column C
for organization to concentrate on this determinant to get 100% satisfaction from each and every
student of the entity.
Theme 2: The most attractive quality services of college entity
Teaching services 12
Friendly and positive environment 15
Additional activities for overall development of students 13
Interpretation:- Through this research process, researcher asks about most attractive
facility of UKCBC to focusing on strongly as well maintaining its good reputation. However, it
is interpreted that the most attractive thing to pull students is college's friendly and positive
environment. In this regard, 15 out of 40 students present their positive views on organization's
effectiveness. Including this, it is recognized that UKCBC also provides extra curriculum
activities for students' physical as well mental development. In accordance to this, 13
respondents present their positive views on additional activities provided by college entity.
Moreover, for analyzing teaching services of organization, it is recognized that 12 respondents
are attracted towards this facilities that improves education system and different learning skills.
10
Teaching services
Friendly and positive environment
Additional activities for overall development of students
0
2
4
6
8
10
12
14
16
Column C
Paraphrase This Document
Need a fresh take? Get an instant paraphrase of this document with our AI Paraphraser
However, it is gained through this research that UKCBC provides attractive services to maintain
students' views for future time effectively.
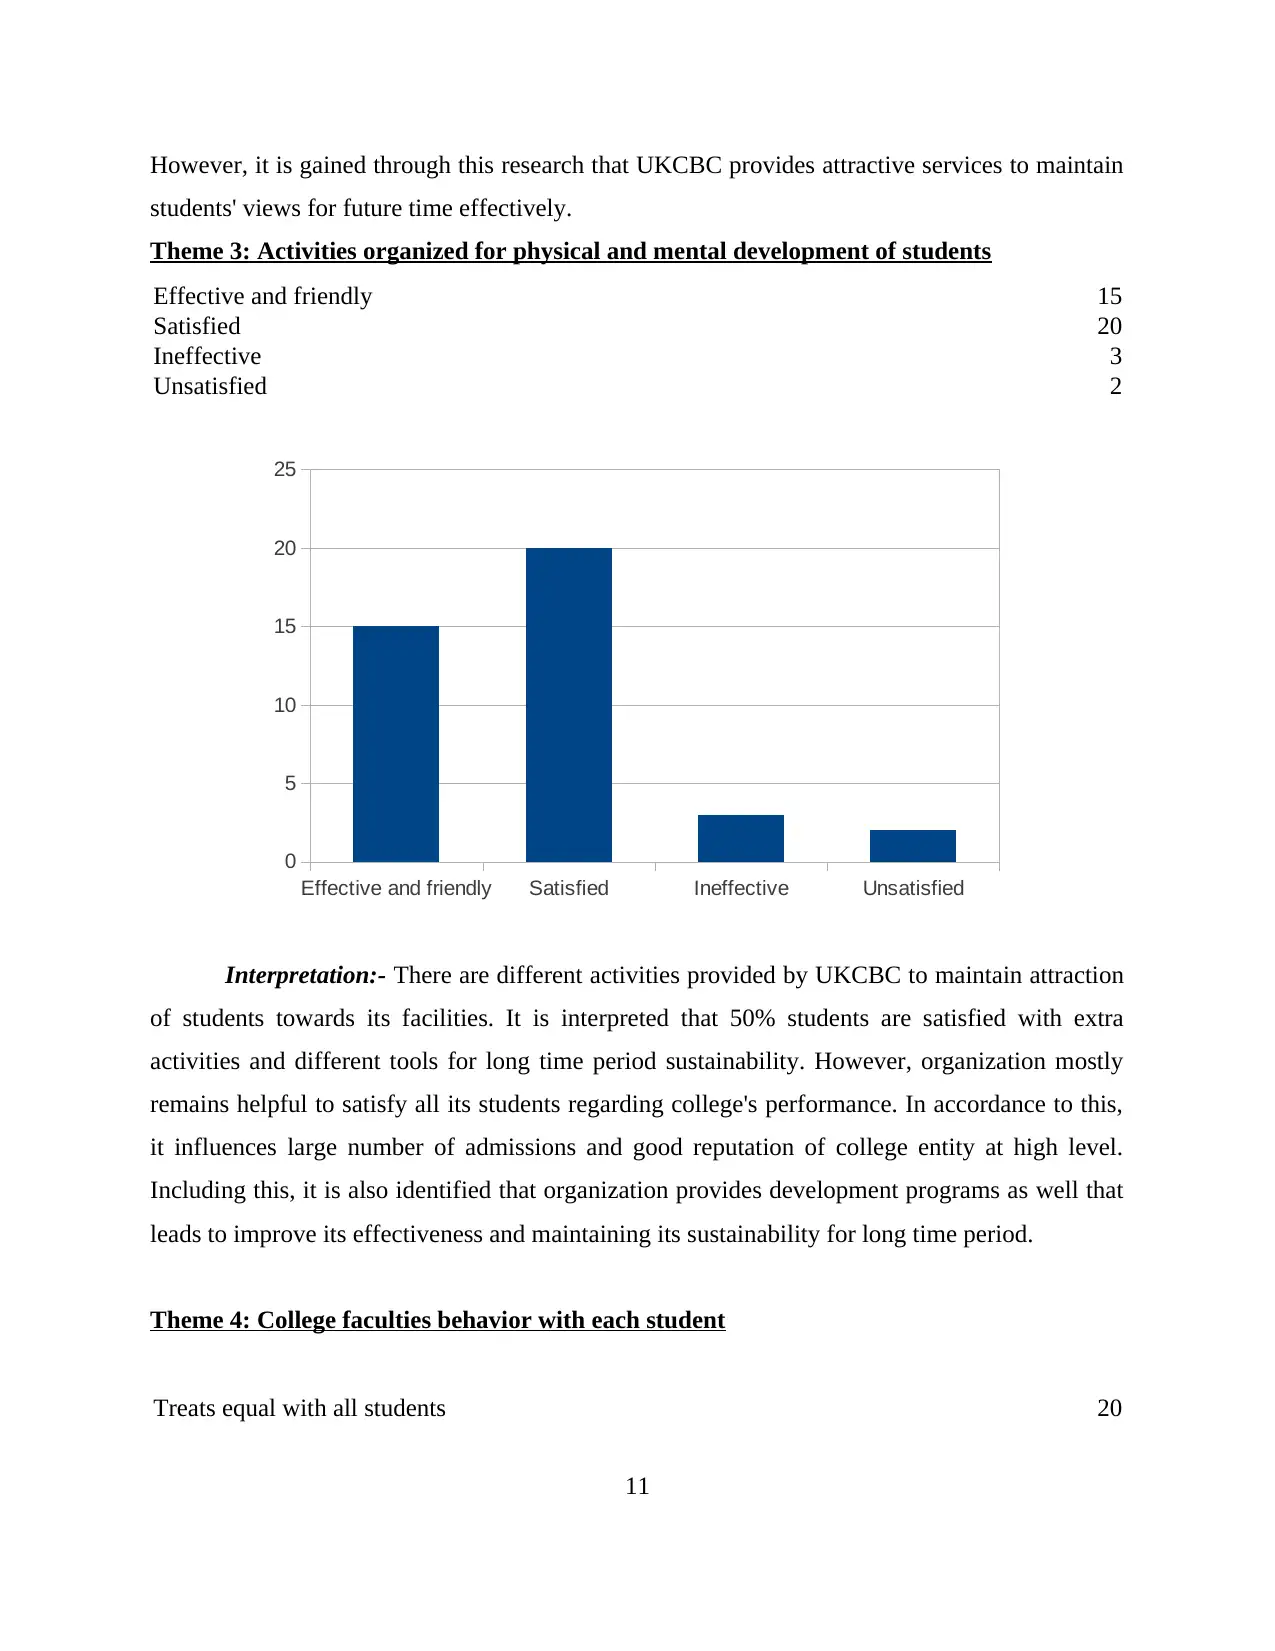
Theme 3: Activities organized for physical and mental development of students
Effective and friendly 15
Satisfied 20
Ineffective 3
Unsatisfied 2
Interpretation:- There are different activities provided by UKCBC to maintain attraction
of students towards its facilities. It is interpreted that 50% students are satisfied with extra
activities and different tools for long time period sustainability. However, organization mostly
remains helpful to satisfy all its students regarding college's performance. In accordance to this,
it influences large number of admissions and good reputation of college entity at high level.
Including this, it is also identified that organization provides development programs as well that
leads to improve its effectiveness and maintaining its sustainability for long time period.
Theme 4: College faculties behavior with each student
Treats equal with all students 20
11
Effective and friendly Satisfied Ineffective Unsatisfied
0
5
10
15
20
25
students' views for future time effectively.
Theme 3: Activities organized for physical and mental development of students
Effective and friendly 15
Satisfied 20
Ineffective 3
Unsatisfied 2
Interpretation:- There are different activities provided by UKCBC to maintain attraction
of students towards its facilities. It is interpreted that 50% students are satisfied with extra
activities and different tools for long time period sustainability. However, organization mostly
remains helpful to satisfy all its students regarding college's performance. In accordance to this,
it influences large number of admissions and good reputation of college entity at high level.
Including this, it is also identified that organization provides development programs as well that
leads to improve its effectiveness and maintaining its sustainability for long time period.
Theme 4: College faculties behavior with each student
Treats equal with all students 20
11
Effective and friendly Satisfied Ineffective Unsatisfied
0
5
10
15
20
25
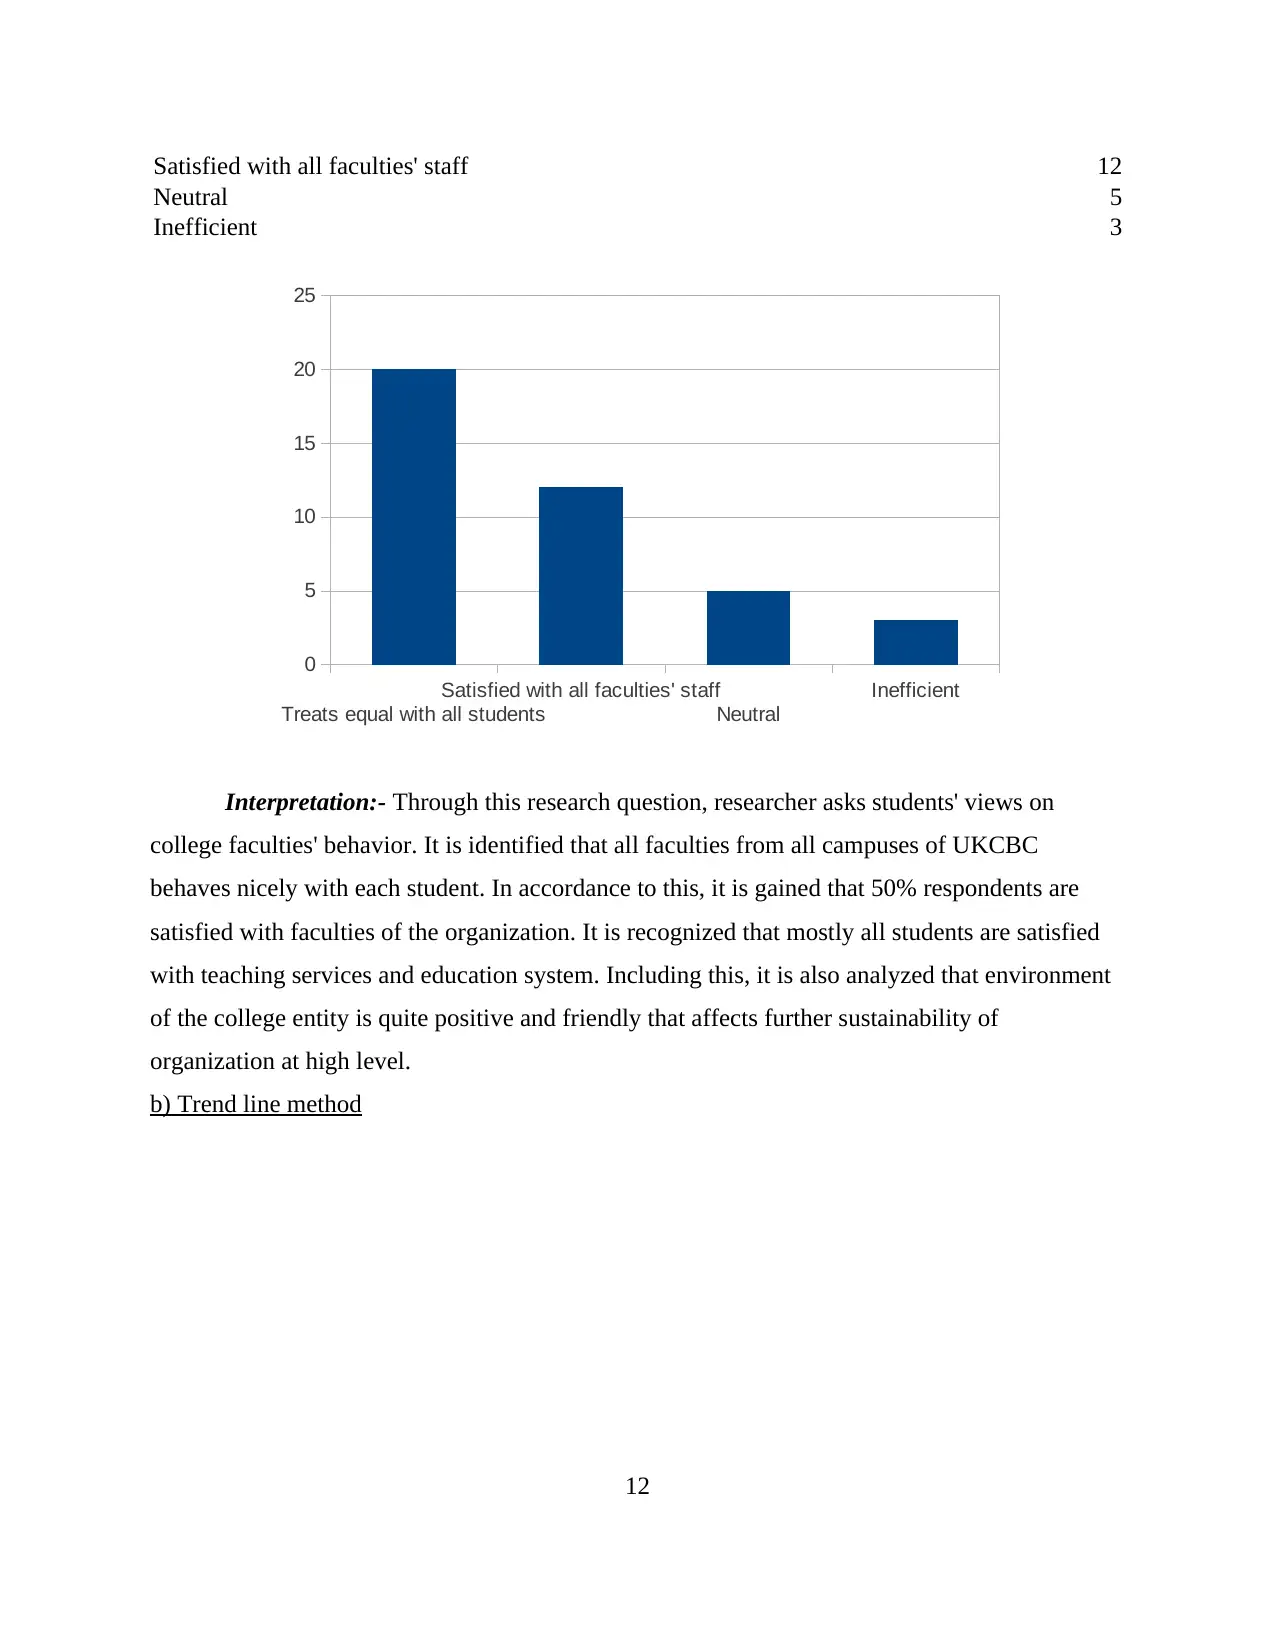
Satisfied with all faculties' staff 12
Neutral 5
Inefficient 3
Interpretation:- Through this research question, researcher asks students' views on
college faculties' behavior. It is identified that all faculties from all campuses of UKCBC
behaves nicely with each student. In accordance to this, it is gained that 50% respondents are
satisfied with faculties of the organization. It is recognized that mostly all students are satisfied
with teaching services and education system. Including this, it is also analyzed that environment
of the college entity is quite positive and friendly that affects further sustainability of
organization at high level.
b) Trend line method
12
Treats equal with all students
Satisfied with all faculties' staff
Neutral
Inefficient
0
5
10
15
20
25
⊘ This is a preview!⊘
Do you want full access?
Subscribe today to unlock all pages.
Trusted by 1+ million students worldwide
1 out of 24
Related Documents


Your All-in-One AI-Powered Toolkit for Academic Success.
+13062052269
info@desklib.com
Available 24*7 on WhatsApp / Email
![[object Object]](/_next/static/media/star-bottom.7253800d.svg)
Unlock your academic potential
Copyright © 2020–2026 A2Z Services. All Rights Reserved. Developed and managed by ZUCOL.