Business Decision Making: Data Collection Plan for UKCBC Survey
VerifiedAdded on 2020/01/28
|30
|5854
|31
Report
AI Summary
This report outlines a data collection plan for a student survey at UKCBC College, focusing on gathering data to inform business decisions. The report details the methodology, including the selection of four campuses, a two-week data collection schedule, and a budget of £20. It employs a mixed-methods approach, utilizing questionnaires for primary data collection and secondary data from books, journals, and online sources. The sampling frame is based on simple random sampling, with a sample size of 50 students. The report further describes the design of the questionnaire, which includes closed-ended questions, and presents the survey methodology and sampling framework used. Additionally, it analyzes the data collected, computing measures of central tendency such as mean, median, and mode for select questions. The report aims to assess student satisfaction with college facilities and educational offerings, providing valuable insights for UKCBC to improve its services.

BUSINESS DECISION
MAKING
MAKING
Paraphrase This Document
Need a fresh take? Get an instant paraphrase of this document with our AI Paraphraser
INTRODUCTION
Globalization has paved way for business organizations to gain success and growth.
However many challenges and difficulties also have been arises and it has become vital that
decisions and strategies for business should be formed by adopting strategic and innovative
approach. Decision making for business is a complex and critical process which requires
strategic approaches from the side of the entrepreneur so that required decisions for business can
be taken successfully. In addition to that it aids for making innovative and effective strategies for
performing the business functions successfully. Present report is based on UK college of
business and computing (UKCBC). The report describes about creating a plan for collecting
from students across all campuses. In addition to that survey methodology and sampling frame
presented has been mentioned. Moreover, a questionnaire has been designed for collecting the
data and summaries of data and information has been done in the report. Aim and Objectives
TASK 1
1.1 Plan for collection of data from students across campus
It is imperative that data should be collected from authentic and reliable data sources so
that required outcomes should be successfully gained (Ho, Xu and Dey, 2010). There are two
main methods that are used for gathering necessary data that is required for performing the study.
Plan for collection of data from students across campus is as mentioned :-
Location across all campus :- 4 Campus have been used for completing the study and the
campus are :-
1- Lords House
2 -Crikle Wood
3 -Park Royal
4 – Went worth house
Time/ schedule :- Data will be collected from the respondents in the time schedule of 2 weeks.
Cost or budget :- Total cost of £ 20 will be incurred for completing the study.
Methods to be used for collection of data :- The methods comprise of collection of primary
and secondary data. For collection of primary data, questionnaire will be used. This is comprise
1
⊘ This is a preview!⊘
Do you want full access?
Subscribe today to unlock all pages.
Trusted by 1+ million students worldwide
of close ended questions. Secondary data will be collected from books, journals and online
articles.
The sampling frame to be used :- Sampling frame is defined as source material from which the
entire samples of the study are drawn. The sampling frame for the present research will be
simple random sampling.
The sample size :- Total sample size for carrying out the research is 50 students.
Type of data : Both Qualitative and Quantitative data will be used for completing the study.
The resources to be used :- Resources that will be used for completing the study are Human
resources, financial resources and physical resources. Human resource includes individual who
will collect data from the consumers.
Anticipation of any risk :- There are probability that respondents might not answer the
questions properly that are mentioned in the questionnaire. other risks include loss of collected
data.
Primary data collection methods: - under this primary data has been gathered for conducting
the study in successful manner. Primary data is the data that is being collected at first time and in
this performance of the organization is evaluated. Questionnaire method in which questions
asked to the respondents proves useful for collecting all the necessary information in successful
manner. Along with this primary data collection method has been used for taking the information
from the respondents. It provides an effective medium that could be used for carrying out the
necessary activities of the institution in successful way (Vercellis, 2011).
Secondary data collection methods: - In this method use of secondary data is taken so that
required objectives of the study should be accomplished (Ho, Xu and Dey, 2010)). Data has
been collected from books, journals, online sources such as websites and internet. Use of various
non-econometric and econometric tools have been taken and it has helped for gathering
necessary information. Secondary information that is collected from different sources aids for
completing the study in effective and successful way.
Qualitative data :- It is defined as data that explains descriptive statements about a subject that
are based on observation. It is also known as Categorical data as in this information is grouped
into specific category. For example information about satisfaction level of students in UKCBC
2
Paraphrase This Document
Need a fresh take? Get an instant paraphrase of this document with our AI Paraphraser
college is type of qualitative data. Qualitative data is analysed by themes that are prepared from
descriptions. This type of data is collected through participants observation and interview.
Quantitative data :- This data is concerned about discovering numerical facts and figures about
the selected subject and it assumes a fixed and measurable reality. Quantitative data is collected
through numerical and statistical tools and techniques. Example of this type of data includes age
group of the students in UKCBC college. Quantitative data is collected through measuring things
such as questionnaire and interview method.
1.2 Presenting the survey methodology and sampling framework used
Survey methodology :- It is defined as field of applied mechanics in which study of
sampling of individual units is done (García-Peñalvo and Conde, 2014). Various survey data
collection techniques are used under it and it helps for completing the survey in successful
manner. This methodology helps for identifying and selecting the potential sample members and
evaluating and testing the questions. For example, questionnaire and interview methods are type
of survey methodology.
Methodologies used for the purpose of data collection :- Methodologies that are used for
collection of data includes observation, questionnaire method and interview method (Solomon,
2014). Observation method is used for collection of primary data. In this method observer
observes the population and records the results. Types of observation includes structured and
unstructured observations. When the observations are characterized by careful definition of units
to be observed, style of observations and selection of observation than it is defined as structured
observations. Interview method is also used for taking response from the participants of the
study. Types of interview comprise of face to face interview, focus group interview and
telephonic interview. In the present study questionnaire method has been used for collecting the
data and information from the respondents of the study. Survey monkey and Social media
websites also provides an effective medium for collecting all the necessary data and information.
Sampling :- Sampling is a process used in the research study for taking out the samples from
entire population.
3
Sampling frame used for the study :- sampling frame is a technique that is used by the
researcher for taking response from the participants of the research study. Simple random
sampling will be used in this study.
Simple random sampling :- In this type of sampling method Each unit of population gets equal
opportunity for being included in the population. This method provides for representing the
entire population and it is more efficient type of methods.
Quota sampling :- It is a sampling method in which representative group of individuals are
selected from a particular sub group.
Stratified sampling :- This sampling method provide medium for dividing the entire group of
population into homogeneous subgroups that are called as Strata. Every element representing the
population is divided into stratum.
Cluster sampling :- This type of sampling plan is used when mutually homogeneous groups
represents the entire population. Entire population is divided into subgroups which are known as
clusters.
Systematic sampling :- In this type of sampling method sample members from a large
population group are selected on the basis of random starting point and a fixed periodic interval.
In the present study Simple random sampling method has been used for taking response
from the respondents. Total 50 students from UKCBC college have been selected for completing
the study.
1.3 Designing a questionnaire for collecting the data
Definition of questionnaire: It is a set of written questions in printed form which is
designed for the purpose of completing the survey. It is a research instrument in which a series of
questions are mentioned with objective to collect the information from the participants of the
study.
Purpose of questionnaire: Major purpose of using questionnaire is to collect relevant data
from students.
In the present study scholar will make use of questionnaires method so that necessary
data for evaluating performance of UKCBC can be collected. Reviews of students about the
4
⊘ This is a preview!⊘
Do you want full access?
Subscribe today to unlock all pages.
Trusted by 1+ million students worldwide
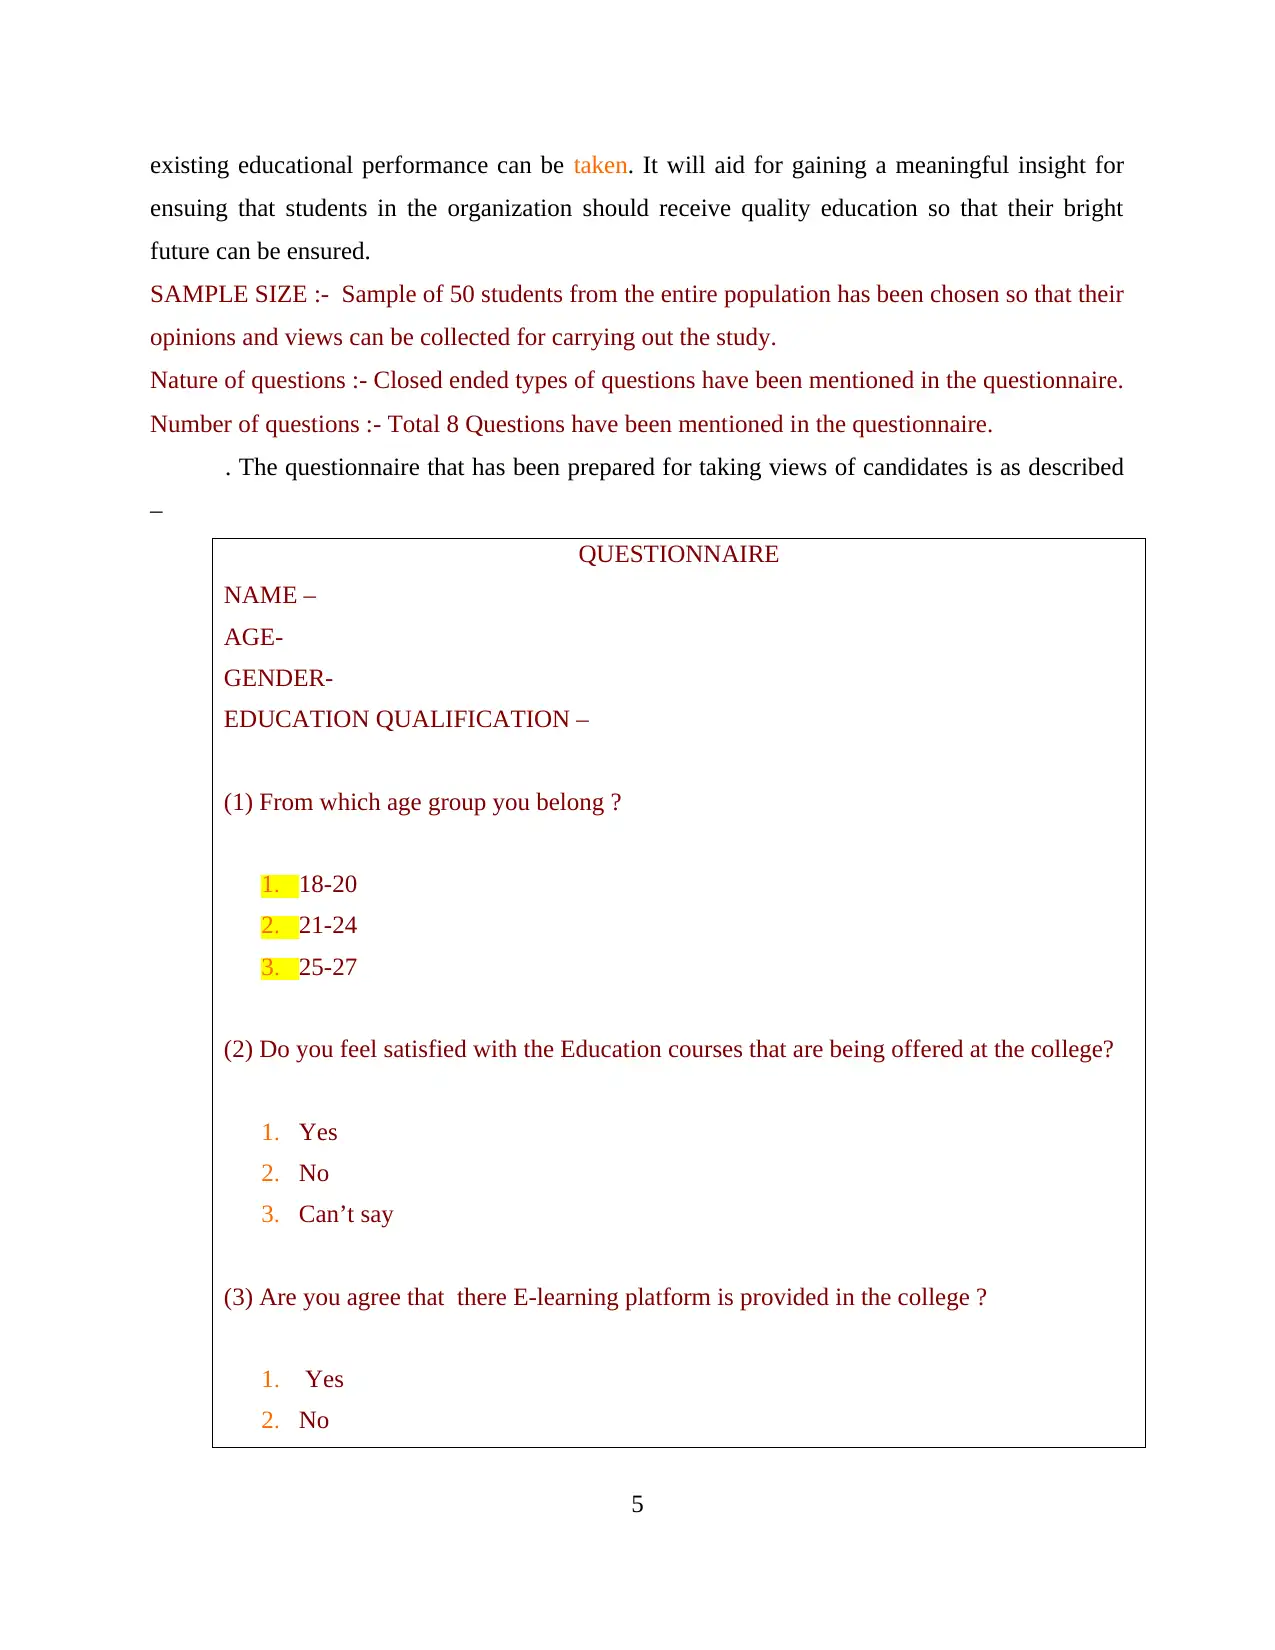
existing educational performance can be taken. It will aid for gaining a meaningful insight for
ensuing that students in the organization should receive quality education so that their bright
future can be ensured.
SAMPLE SIZE :- Sample of 50 students from the entire population has been chosen so that their
opinions and views can be collected for carrying out the study.
Nature of questions :- Closed ended types of questions have been mentioned in the questionnaire.
Number of questions :- Total 8 Questions have been mentioned in the questionnaire.
. The questionnaire that has been prepared for taking views of candidates is as described
–
QUESTIONNAIRE
NAME –
AGE-
GENDER-
EDUCATION QUALIFICATION –
(1) From which age group you belong ?
1. 18-20
2. 21-24
3. 25-27
(2) Do you feel satisfied with the Education courses that are being offered at the college?
1. Yes
2. No
3. Can’t say
(3) Are you agree that there E-learning platform is provided in the college ?
1. Yes
2. No
5
Paraphrase This Document
Need a fresh take? Get an instant paraphrase of this document with our AI Paraphraser
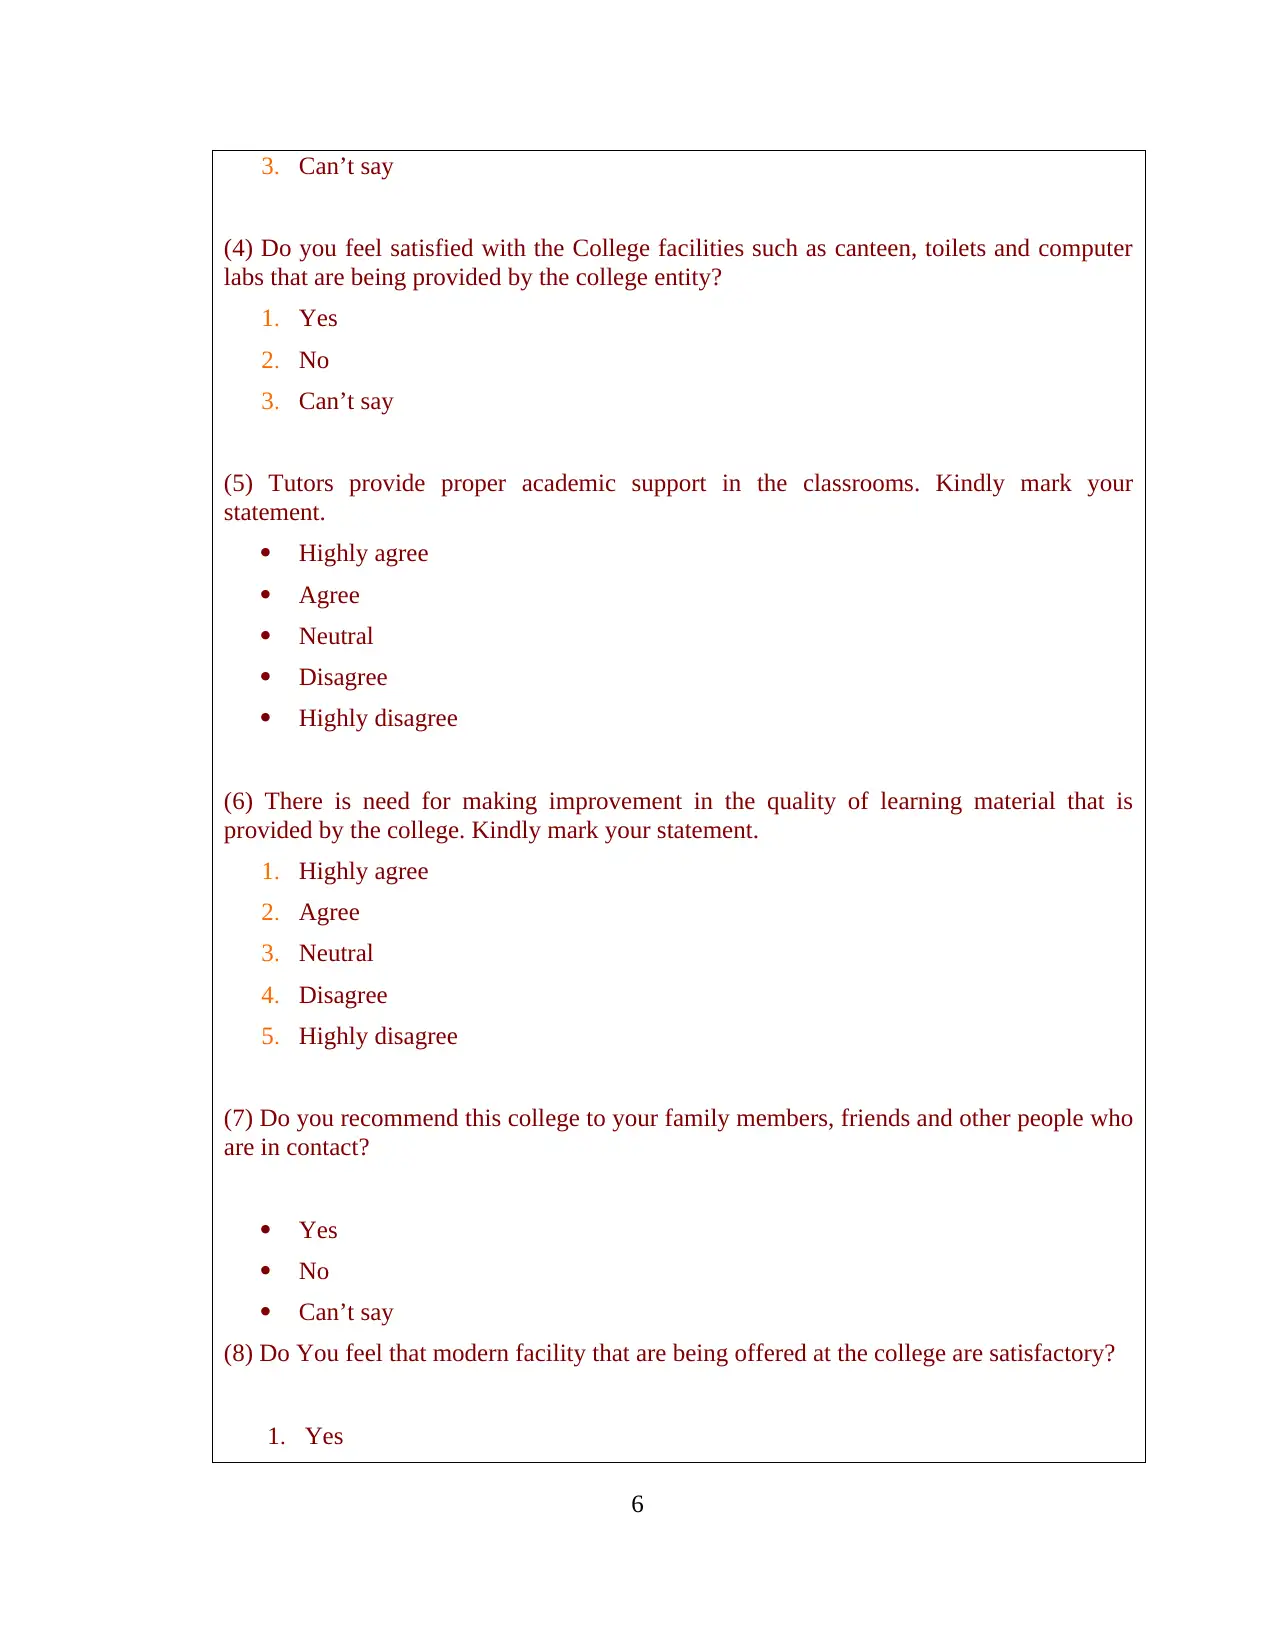
3. Can’t say
(4) Do you feel satisfied with the College facilities such as canteen, toilets and computer
labs that are being provided by the college entity?
1. Yes
2. No
3. Can’t say
(5) Tutors provide proper academic support in the classrooms. Kindly mark your
statement.
Highly agree
Agree
Neutral
Disagree
Highly disagree
(6) There is need for making improvement in the quality of learning material that is
provided by the college. Kindly mark your statement.
1. Highly agree
2. Agree
3. Neutral
4. Disagree
5. Highly disagree
(7) Do you recommend this college to your family members, friends and other people who
are in contact?
Yes
No
Can’t say
(8) Do You feel that modern facility that are being offered at the college are satisfactory?
1. Yes
6
2. No
3. Can’t say
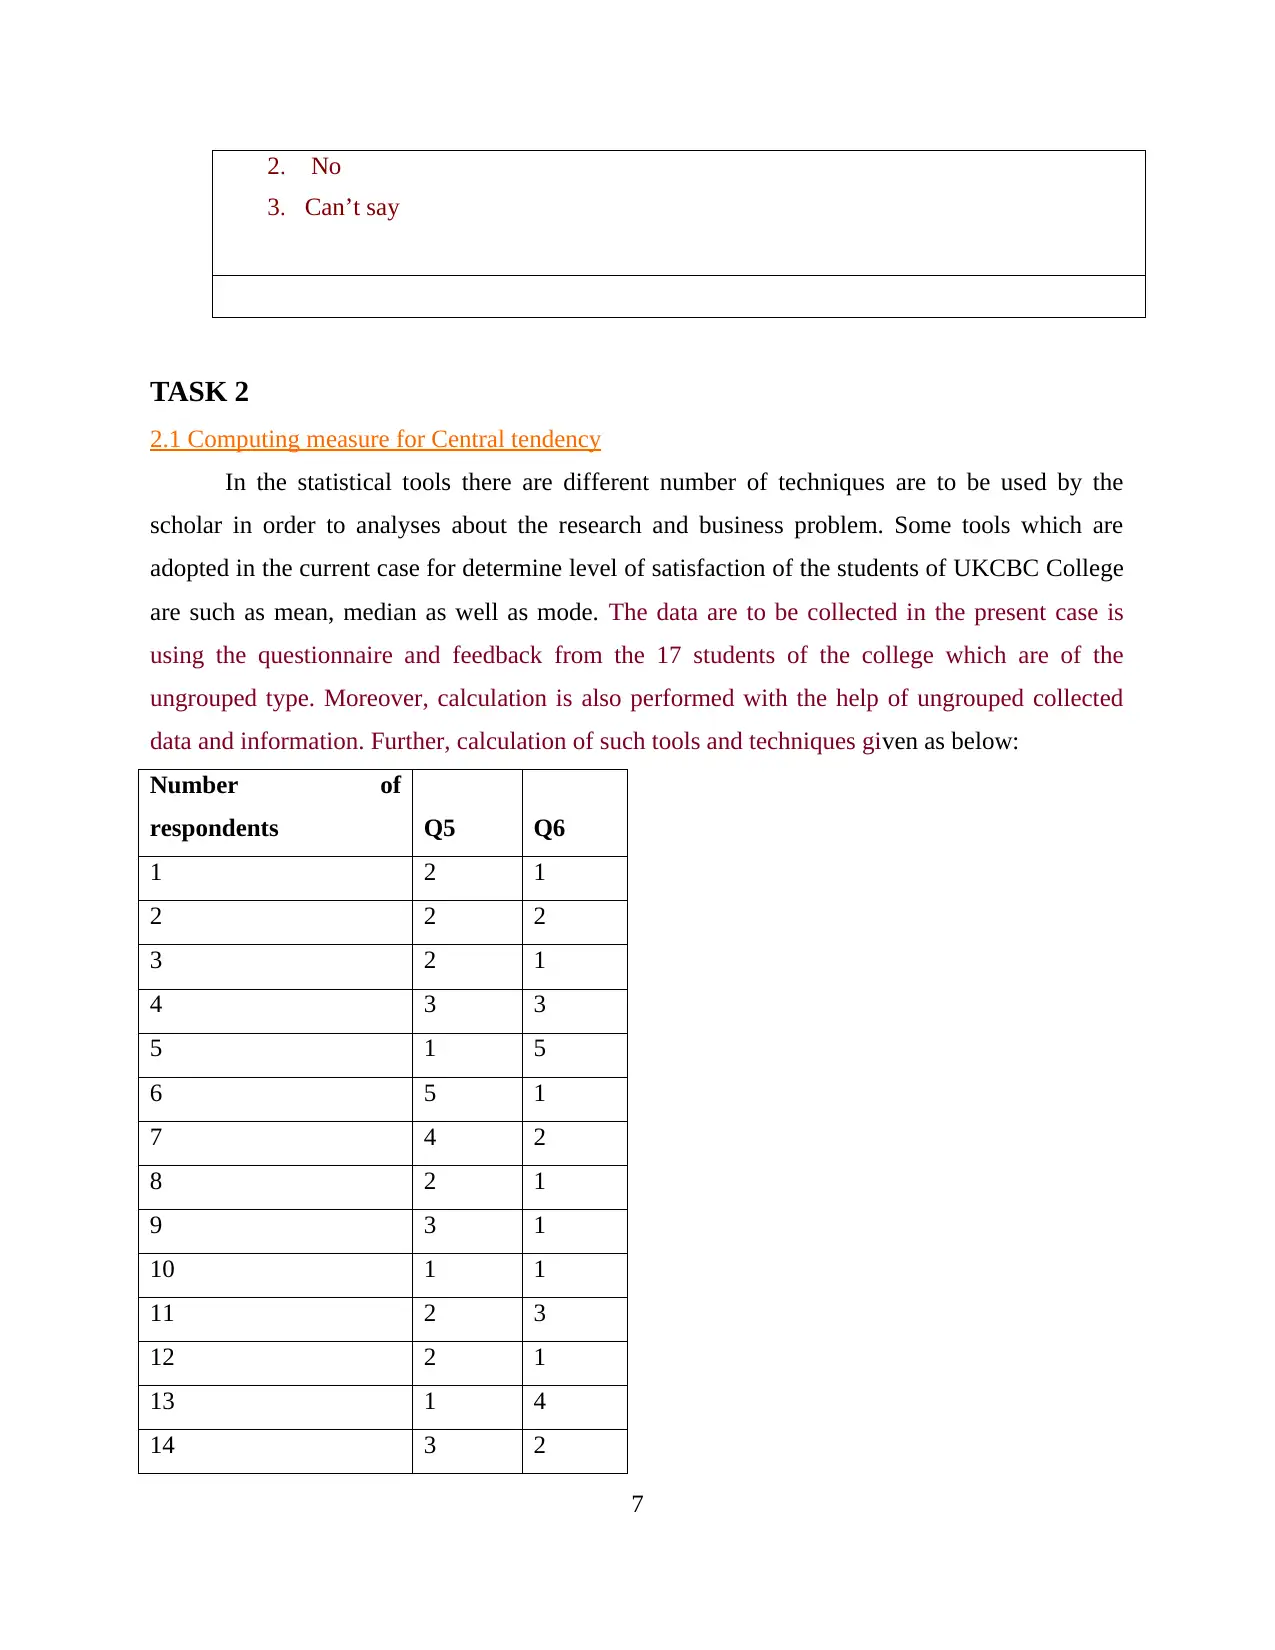
TASK 2
2.1 Computing measure for Central tendency
In the statistical tools there are different number of techniques are to be used by the
scholar in order to analyses about the research and business problem. Some tools which are
adopted in the current case for determine level of satisfaction of the students of UKCBC College
are such as mean, median as well as mode. The data are to be collected in the present case is
using the questionnaire and feedback from the 17 students of the college which are of the
ungrouped type. Moreover, calculation is also performed with the help of ungrouped collected
data and information. Further, calculation of such tools and techniques given as below:
Number of
respondents Q5 Q6
1 2 1
2 2 2
3 2 1
4 3 3
5 1 5
6 5 1
7 4 2
8 2 1
9 3 1
10 1 1
11 2 3
12 2 1
13 1 4
14 3 2
7
3. Can’t say
TASK 2
2.1 Computing measure for Central tendency
In the statistical tools there are different number of techniques are to be used by the
scholar in order to analyses about the research and business problem. Some tools which are
adopted in the current case for determine level of satisfaction of the students of UKCBC College
are such as mean, median as well as mode. The data are to be collected in the present case is
using the questionnaire and feedback from the 17 students of the college which are of the
ungrouped type. Moreover, calculation is also performed with the help of ungrouped collected
data and information. Further, calculation of such tools and techniques given as below:
Number of
respondents Q5 Q6
1 2 1
2 2 2
3 2 1
4 3 3
5 1 5
6 5 1
7 4 2
8 2 1
9 3 1
10 1 1
11 2 3
12 2 1
13 1 4
14 3 2
7
⊘ This is a preview!⊘
Do you want full access?
Subscribe today to unlock all pages.
Trusted by 1+ million students worldwide
15 2 1
16 4 5
17 2 1
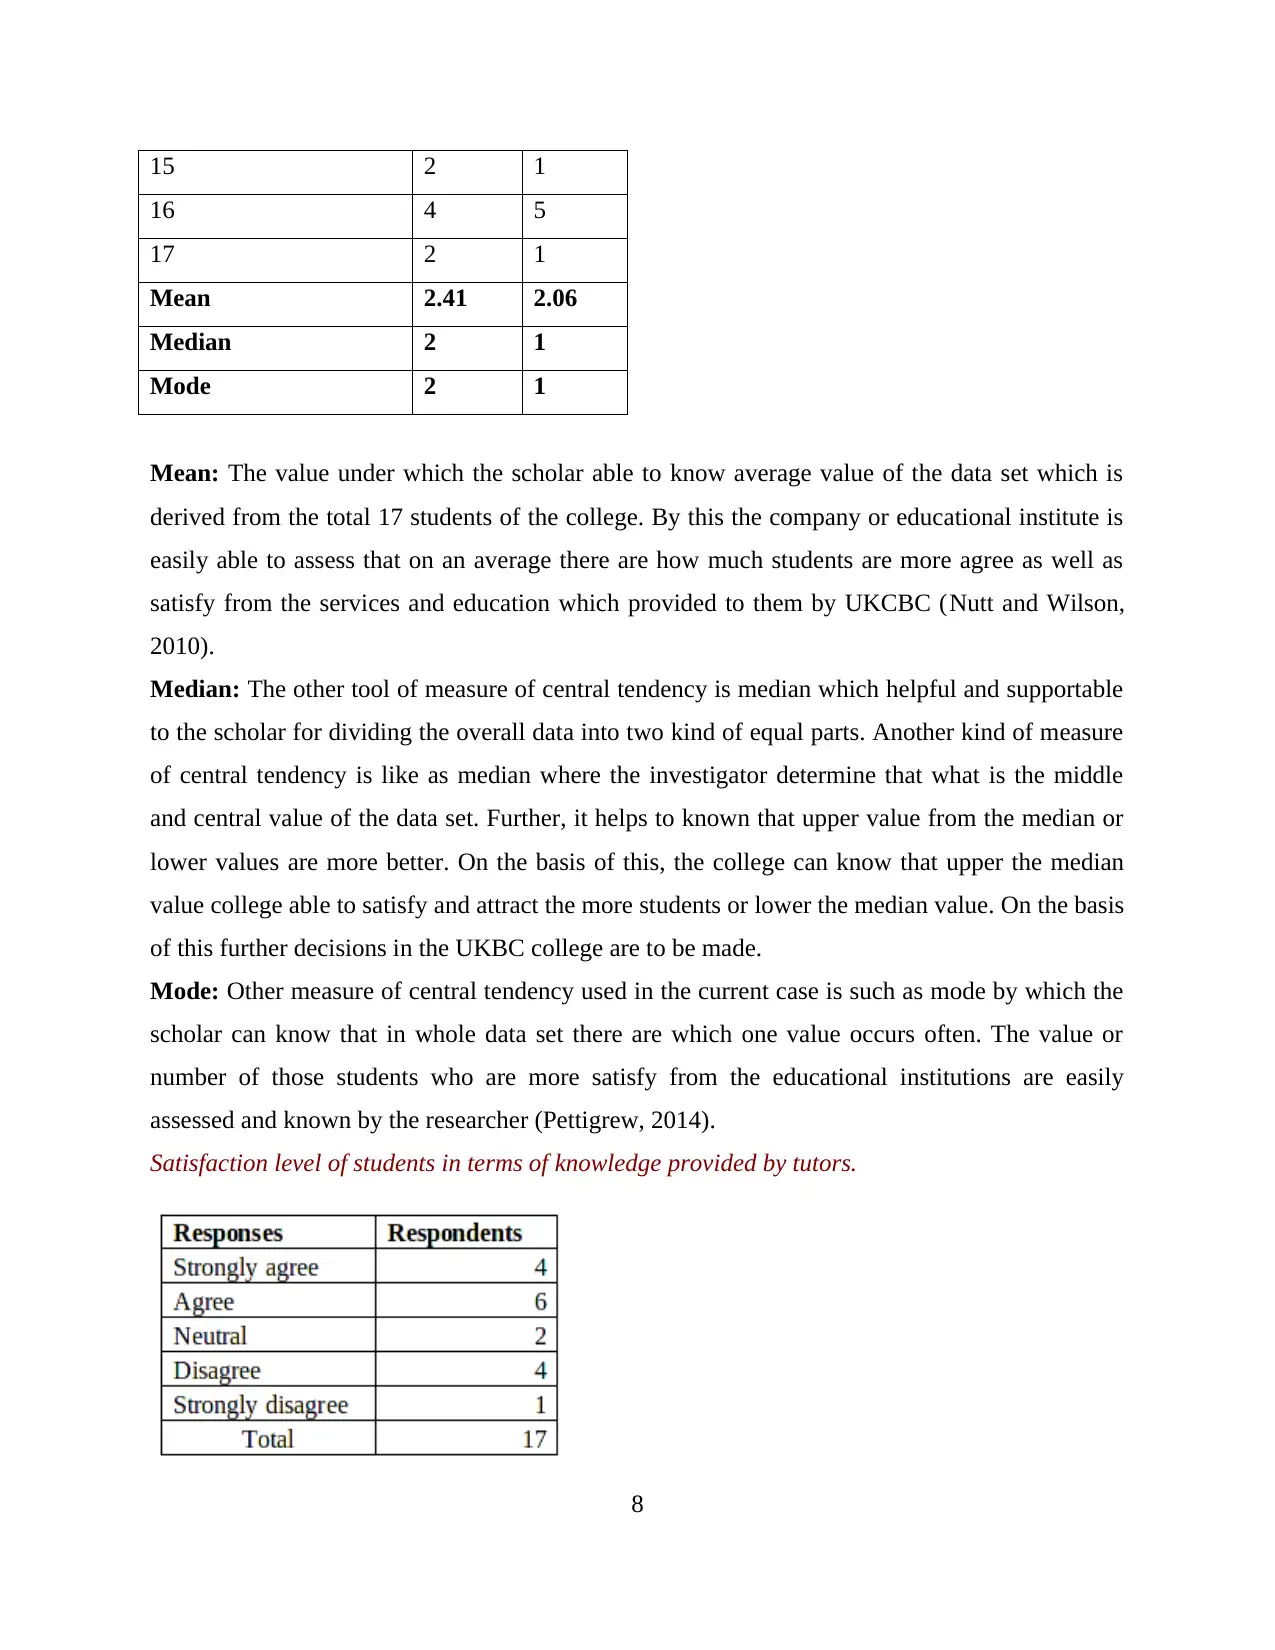
Mean 2.41 2.06
Median 2 1
Mode 2 1
Mean: The value under which the scholar able to know average value of the data set which is
derived from the total 17 students of the college. By this the company or educational institute is
easily able to assess that on an average there are how much students are more agree as well as
satisfy from the services and education which provided to them by UKCBC (Nutt and Wilson,
2010).
Median: The other tool of measure of central tendency is median which helpful and supportable
to the scholar for dividing the overall data into two kind of equal parts. Another kind of measure
of central tendency is like as median where the investigator determine that what is the middle
and central value of the data set. Further, it helps to known that upper value from the median or
lower values are more better. On the basis of this, the college can know that upper the median
value college able to satisfy and attract the more students or lower the median value. On the basis
of this further decisions in the UKBC college are to be made.
Mode: Other measure of central tendency used in the current case is such as mode by which the
scholar can know that in whole data set there are which one value occurs often. The value or
number of those students who are more satisfy from the educational institutions are easily
assessed and known by the researcher (Pettigrew, 2014).
Satisfaction level of students in terms of knowledge provided by tutors.
8
16 4 5
17 2 1
Mean 2.41 2.06
Median 2 1
Mode 2 1
Mean: The value under which the scholar able to know average value of the data set which is
derived from the total 17 students of the college. By this the company or educational institute is
easily able to assess that on an average there are how much students are more agree as well as
satisfy from the services and education which provided to them by UKCBC (Nutt and Wilson,
2010).
Median: The other tool of measure of central tendency is median which helpful and supportable
to the scholar for dividing the overall data into two kind of equal parts. Another kind of measure
of central tendency is like as median where the investigator determine that what is the middle
and central value of the data set. Further, it helps to known that upper value from the median or
lower values are more better. On the basis of this, the college can know that upper the median
value college able to satisfy and attract the more students or lower the median value. On the basis
of this further decisions in the UKBC college are to be made.
Mode: Other measure of central tendency used in the current case is such as mode by which the
scholar can know that in whole data set there are which one value occurs often. The value or
number of those students who are more satisfy from the educational institutions are easily
assessed and known by the researcher (Pettigrew, 2014).
Satisfaction level of students in terms of knowledge provided by tutors.
8
Paraphrase This Document
Need a fresh take? Get an instant paraphrase of this document with our AI Paraphraser
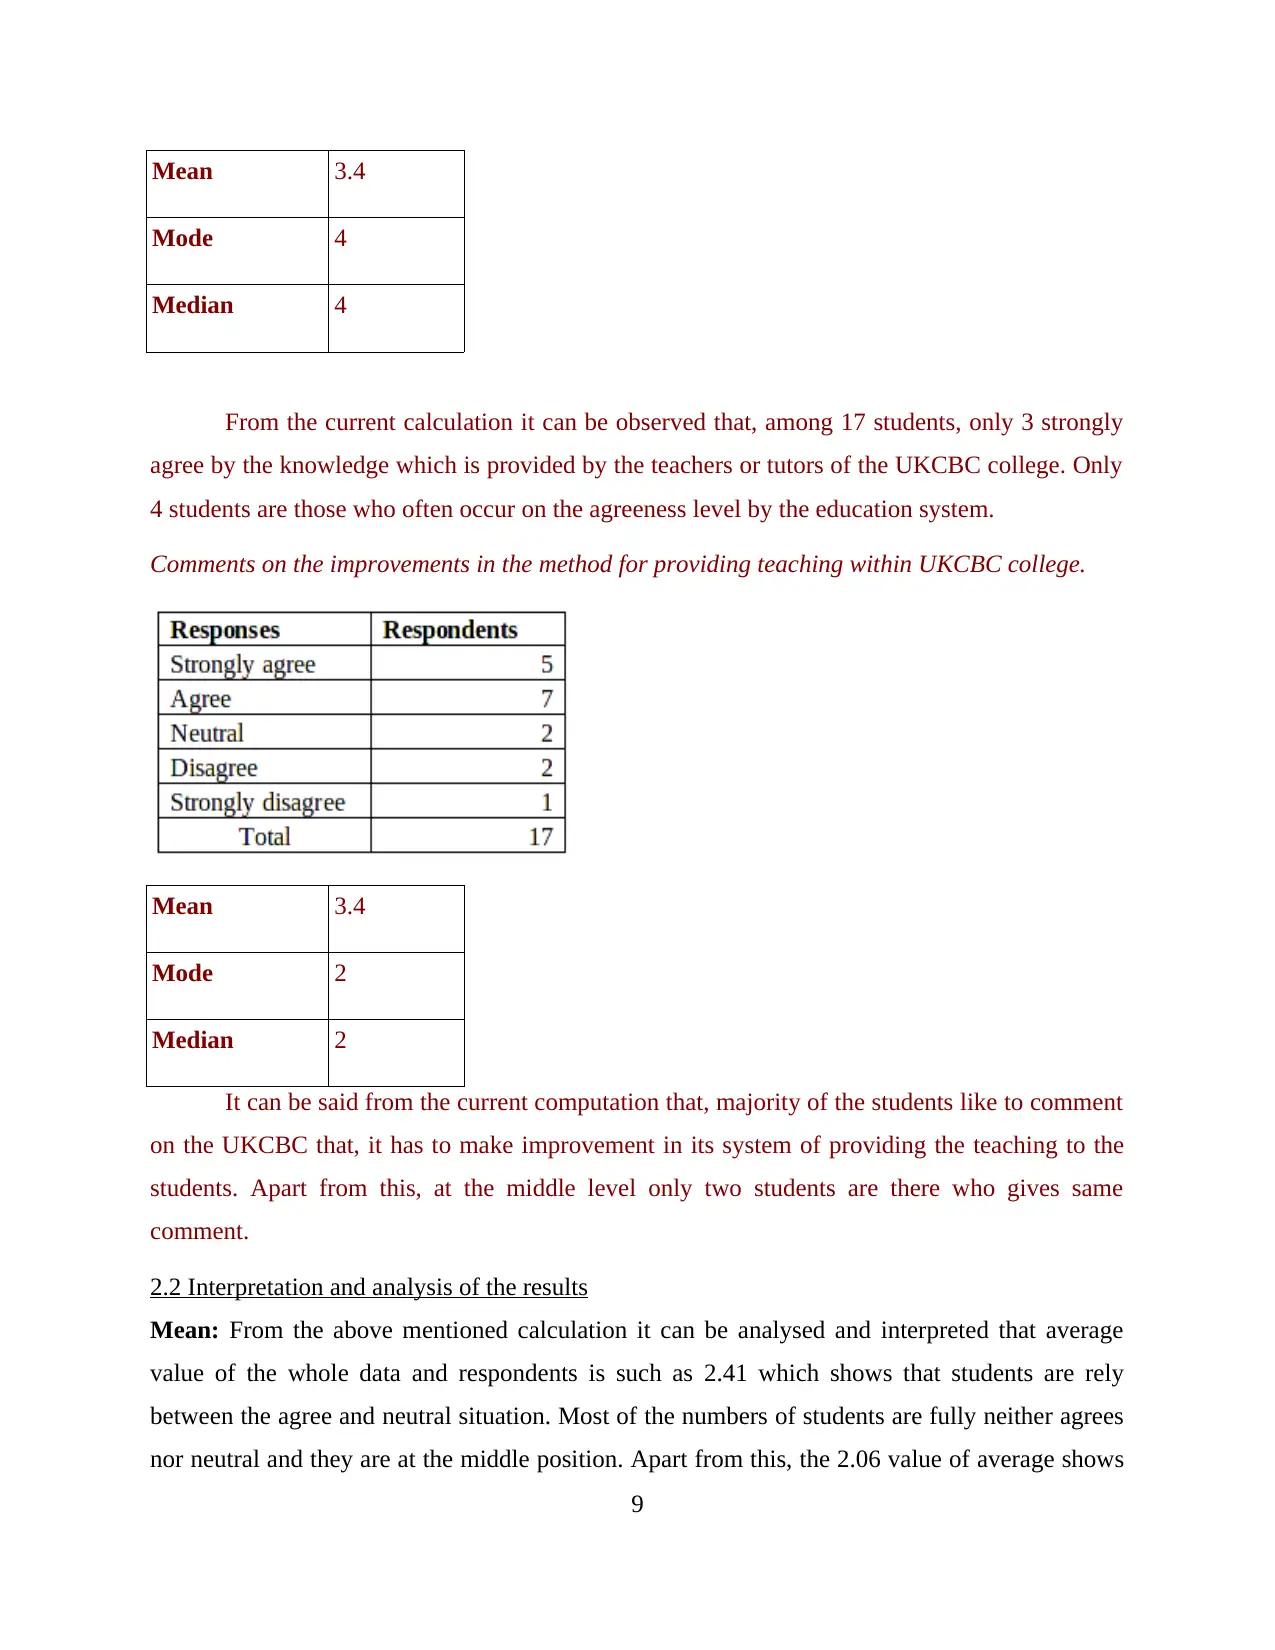
Mean 3.4
Mode 4
Median 4
From the current calculation it can be observed that, among 17 students, only 3 strongly
agree by the knowledge which is provided by the teachers or tutors of the UKCBC college. Only
4 students are those who often occur on the agreeness level by the education system.
Comments on the improvements in the method for providing teaching within UKCBC college.
Mean 3.4
Mode 2
Median 2
It can be said from the current computation that, majority of the students like to comment
on the UKCBC that, it has to make improvement in its system of providing the teaching to the
students. Apart from this, at the middle level only two students are there who gives same
comment.
2.2 Interpretation and analysis of the results
Mean: From the above mentioned calculation it can be analysed and interpreted that average
value of the whole data and respondents is such as 2.41 which shows that students are rely
between the agree and neutral situation. Most of the numbers of students are fully neither agrees
nor neutral and they are at the middle position. Apart from this, the 2.06 value of average shows
9
that the students of college totally agree that college needs to improve its educational systems for
make them highly satisfied.
Median: It is not possible that every time available data will be in small scale and due to
segregate in equal two parts the current measure of central tendency is to be used. At the current
case, middle value of overall data is 2 which shows that most of the students and respondents of
the UKCBC college are agree by the knowledge which is delivered to them (Robert, 2010).
Apart from thus, as pert the second kind of theme or question it has been ascertained that the
more number of students are highly agree and thinks that method of delivering the educational
knowledge must be improve.
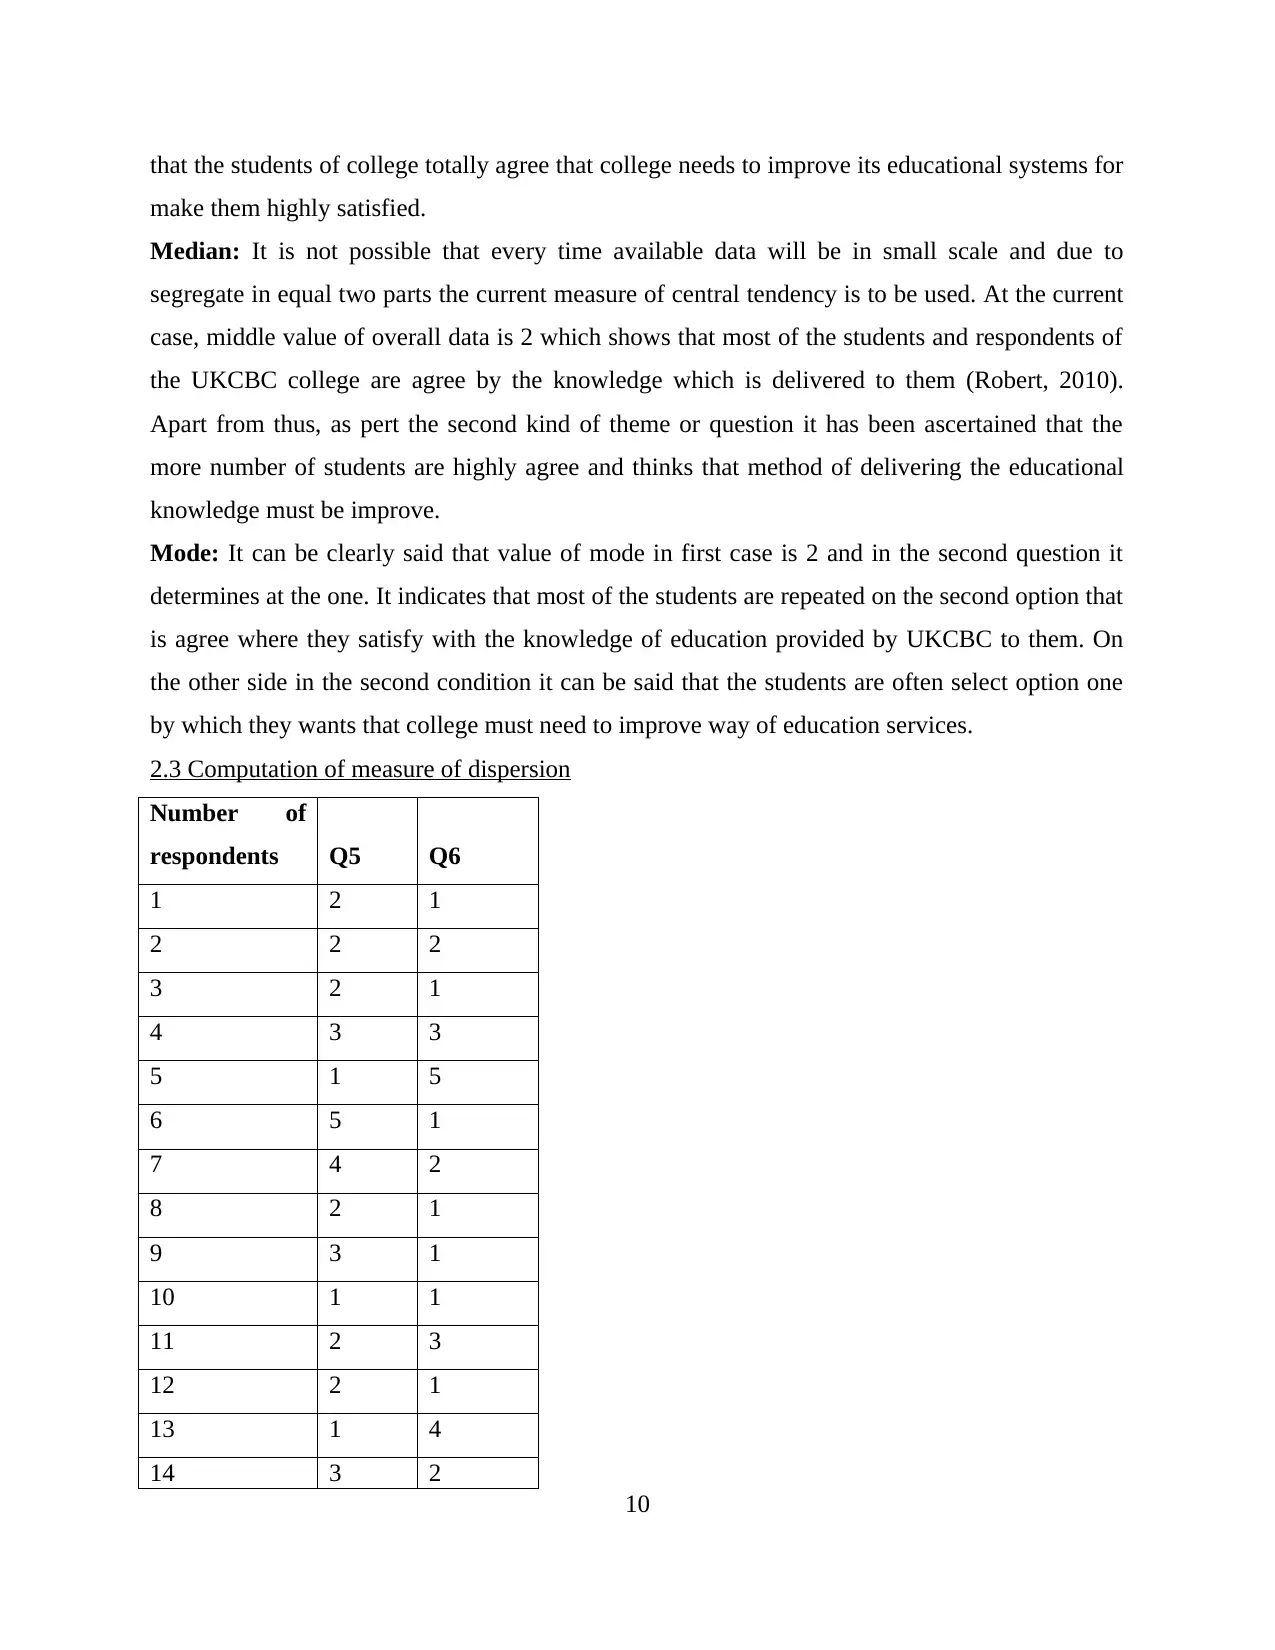
Mode: It can be clearly said that value of mode in first case is 2 and in the second question it
determines at the one. It indicates that most of the students are repeated on the second option that
is agree where they satisfy with the knowledge of education provided by UKCBC to them. On
the other side in the second condition it can be said that the students are often select option one
by which they wants that college must need to improve way of education services.
2.3 Computation of measure of dispersion
Number of
respondents Q5 Q6
1 2 1
2 2 2
3 2 1
4 3 3
5 1 5
6 5 1
7 4 2
8 2 1
9 3 1
10 1 1
11 2 3
12 2 1
13 1 4
14 3 2
10
make them highly satisfied.
Median: It is not possible that every time available data will be in small scale and due to
segregate in equal two parts the current measure of central tendency is to be used. At the current
case, middle value of overall data is 2 which shows that most of the students and respondents of
the UKCBC college are agree by the knowledge which is delivered to them (Robert, 2010).
Apart from thus, as pert the second kind of theme or question it has been ascertained that the
more number of students are highly agree and thinks that method of delivering the educational
knowledge must be improve.
Mode: It can be clearly said that value of mode in first case is 2 and in the second question it
determines at the one. It indicates that most of the students are repeated on the second option that
is agree where they satisfy with the knowledge of education provided by UKCBC to them. On
the other side in the second condition it can be said that the students are often select option one
by which they wants that college must need to improve way of education services.
2.3 Computation of measure of dispersion
Number of
respondents Q5 Q6
1 2 1
2 2 2
3 2 1
4 3 3
5 1 5
6 5 1
7 4 2
8 2 1
9 3 1
10 1 1
11 2 3
12 2 1
13 1 4
14 3 2
10
⊘ This is a preview!⊘
Do you want full access?
Subscribe today to unlock all pages.
Trusted by 1+ million students worldwide
1 out of 30
Related Documents


Your All-in-One AI-Powered Toolkit for Academic Success.
+13062052269
info@desklib.com
Available 24*7 on WhatsApp / Email
![[object Object]](/_next/static/media/star-bottom.7253800d.svg)
Unlock your academic potential
Copyright © 2020–2026 A2Z Services. All Rights Reserved. Developed and managed by ZUCOL.