MBA604 Financial Analysis Report: Ulta Beauty Inc. - Comparison
VerifiedAdded on 2022/12/27
|24
|4213
|1
Report
AI Summary
This report provides a comprehensive financial analysis of Ulta Beauty, employing both trend and ratio analysis methodologies. The report begins with an introduction and a detailed company profile of Ulta Beauty, covering its history, product lines, current market position, company structure, and competitive landscape. The core of the analysis is divided into two sections: trend analysis and ratio analysis. The trend analysis examines the company's financial performance over three years, including total revenue, profit, assets, and equity, and compares these trends with those of its competitor, Estee Lauder. The ratio analysis delves into liquidity, leverage (solvency), and profitability ratios, providing insights into Ulta Beauty's financial strengths and weaknesses relative to Estee Lauder. The report concludes with a summary of findings, highlighting Ulta Beauty's competitive position and financial health within the beauty and retail sector, emphasizing areas of strength and potential risks based on the comparative analysis.
Accounting Financial Analysis Report
1
1
Paraphrase This Document
Need a fresh take? Get an instant paraphrase of this document with our AI Paraphraser
Contents
Introduction......................................................................................................................................4
Section 1: Company Profile.............................................................................................................5
1.1: Introduction...........................................................................................................................5
1.2: Data Discussion....................................................................................................................5
1.2.1: History................................................................................................................................5
1.2.2: Product Lines.....................................................................................................................5
1.2.3: Current Position.................................................................................................................5
1.2.4: Company Structure............................................................................................................6
1.2.5: Industry and Main Competitors.........................................................................................6
1.3: Conclusion............................................................................................................................6
Section 2: Company Analysis (Trend Analysis).............................................................................8
2.0: Trend Analysis of Ulta Beauty Inc. and its competitor Estee Lauder Company..................8
2.1: Introduction...........................................................................................................................8
2.2: Discussion of Data................................................................................................................8
2.2.1: Trend Analysis (Trend in Financial Data over the last three years)..................................8
2.2.1.1: Total Revenue.................................................................................................................8
2.2.1.2: Total Profit......................................................................................................................9
2.2.1.3: Total Assets...................................................................................................................10
2.2.1.4: Total Equity..................................................................................................................12
2.3: Results & Conclusion.........................................................................................................12
Section 3: Company Analysis (Ratio Analysis)............................................................................14
3.0: Description, Analysis and Interpretation of Financial Ratios of Ulta beauty in Comparison
to Estee Lauder...........................................................................................................................14
3.1: Introduction.........................................................................................................................14
2
3.2: Discussion of Data..............................................................................................................14
3.2.1: Liquidity Analysis............................................................................................................14
3.2.1.1: Current Ratio.................................................................................................................14
3.2.1.2: Quick Ratio...................................................................................................................15
3.2.2: Leverage Analysis (Solvency Analysis)..........................................................................16
3.2.2.1: Debt Ratio.....................................................................................................................16
3.2.2.2: Debt to Equity Ratio.....................................................................................................17
3.2.3: Profitability Analysis.......................................................................................................18
3.2.3.1: Gross profit ratio...........................................................................................................18
3.2.3.2: Net Profit Ratio.............................................................................................................19
3.3: Results & Conclusion.........................................................................................................21
Conclusion.....................................................................................................................................22
References......................................................................................................................................23
3
⊘ This is a preview!⊘
Do you want full access?
Subscribe today to unlock all pages.
Trusted by 1+ million students worldwide
Introduction
The report has been prepared for analyzing the financial health of a selected company,
that is, Ulta Beauty, with the use of technique of trend and ratio analysis. This has been
conducted for examining the strengths and weakness of the company in terms of liquidity,
leverage and profitability. The results obtained are compared with selected competitor for
assessing its competitive position within the industry.
This report has been divided into three parts and they are company profile, trend analysis
and ratio analysis of the selected company (Listed on S&P 500) and comparison with its main
competitor. Each section has its own introduction, discussion and conclusion that provide
information in model used, results, details of spreadsheet and other details.
4
Paraphrase This Document
Need a fresh take? Get an instant paraphrase of this document with our AI Paraphraser
Section 1: Company Profile
1.1: Introduction
This part of the report has presented a brief discussion regarding the background of the
selected company that includes discussion about its history, industry trend, product lines and
current competitive position. This section includes an internal analysis of the company by
discussing its competitive position within industry and assessing its future potential of growth
and development.
1.2: Data Discussion
1.2.1: History
Ulta Beauty Inc is a recognized chain of beauty stores within the United States and is
involved in providing wide range of cosmetic products. It has been established in the year 1990
by Richard E. George and Terry Hanson. George has established the business plan for
introducing a retail concept and offering wide range of cosmetics and fragrance products as
compared to other cosmetic retail stores (Maros, 2018). The strong financial performance of the
company supported its growth and profitability and lead to its establishment of it’s about 949
stores across 48 states. The major success factor that contributed to the success of the company is
providing attractive mix of different products supported by good customer experience and
incorporating the use of online communication channels for its higher number of sales. It has
almost completely reinvented its stores since its establishment in the year 1990 by providing
diverse range of beauty products at a single place (Ulta Beauty, 2019).
1.2.2: Product Lines
Ulta Beauty is known to the best retailer within the US that is involved in providing
diverse range of products that includes cosmetics, fragrance, skin and hair products and salon
services. The company is involved in providing different types of beauty products to its
customers that includes from skin care, nails, skin care, hair, bath to different make up products.
It also provides full-service salon services in the segments of hair, skin, brow and make-up
services (Danzier, 2018).
5
1.2.3: Current Position
Ulta Beauty is known to be the top most national retailer by providing complete beauty
experience to its customers. It is known to be a leading cosmetic retailer within the US owing to
its high commitment to providing personalized service in the beauty segment. The company has
increased its products lines of cosmetics and fragrance since its establishment. The publicly
traded company has attained a distinctive position in the competitive cosmetic retail market of
the US owing to its higher number of sales supported by evolution and adding up of significant
product lines (Zion Market Research, 2018). It is realizing higher net income at a time in the US
when other retailers are struggling to retain their market share within the cosmetic sector. The
higher sales growth is supported by its good customer experience achieved due to its high quality
online as well as offline products and services (Daily Herald, 2017).
1.2.4: Company Structure
Its organizational structure comprises of establishing divisions in different geographical
areas within the US to offer its products and services. Its different retail stores across different
states within the US to provide its diverse beauty products to the customers. It also provides its
different beauty products to the customers through its online retail channel (Ulta Beauty, 2019).
1.2.5: Industry and Main Competitors
The Beauty and Cosmetic Industry within the US is highly competitive and is dominated
by the presence of large number of competitors. The industry has realized revenue of about $2.4
bn in the financial year 2019 with increase in the number of businesses by 2.6% (Industry
Market Research Report, 2019). The major competitors of Ulta Beauty are Sephora, Oriflame,
Estee Lauder and others cosmetic retail companies. However, it has maintained its distinctive
position within the retail sector by reporting increase in sales of about 17.4% in the year 2018
(Danzier, 2018).
1.3: Conclusion
It is inferred from this section of the report that company Ulta Beauty has attained a
competitive position within the beauty and retail sector of the US owing to high quality and
variety of products offered in the beauty segment. The online retail channel used by it has further
fostered its growth within the cosmetic retailing sector with increase in the number of sales by
reaching to large number of customers. The US cosmetic industry is however highly competitive
6
⊘ This is a preview!⊘
Do you want full access?
Subscribe today to unlock all pages.
Trusted by 1+ million students worldwide
and therefore it is essential that Ulta Beauty should maintain customer satisfaction by promoting
its continued growth. This section of the report ahs used internal environmental analysis model
for examining the selected company position and background.
7
its continued growth. This section of the report ahs used internal environmental analysis model
for examining the selected company position and background.
7
Paraphrase This Document
Need a fresh take? Get an instant paraphrase of this document with our AI Paraphraser
Section 2: Company Analysis (Trend Analysis)
2.0: Trend Analysis of Ulta Beauty Inc. and its competitor Estee Lauder Company
2.1: Introduction
This part of the report has conducted an evaluation of financial health of Ulta Beauty
with the use of the financial analysis model of trend analysis. The trend analysis model of
financial evaluation is used for comparison of business data over time for identifying the
consistency in the financial results of a selected company. The trend analysis of Ulta Beauty is
conducted with the use of examining the significant changes that have occurred in its key
financial elements of total revenue, total profit, total assets and total equity.
2.2: Discussion of Data
The section has analyzed the significant changes in the key financial elements of the
company such as revenue, assets, equity and profits as compared to its competitor with the use of
the model of the trend analysis. The key assumption of the model is that the results obtained are
based on the past information provided within the financial statements and therefore cannot be
regarded as highly useful for predicting the future growth trends of the company.
2.2.1: Trend Analysis (Trend in Financial Data over the last three years)
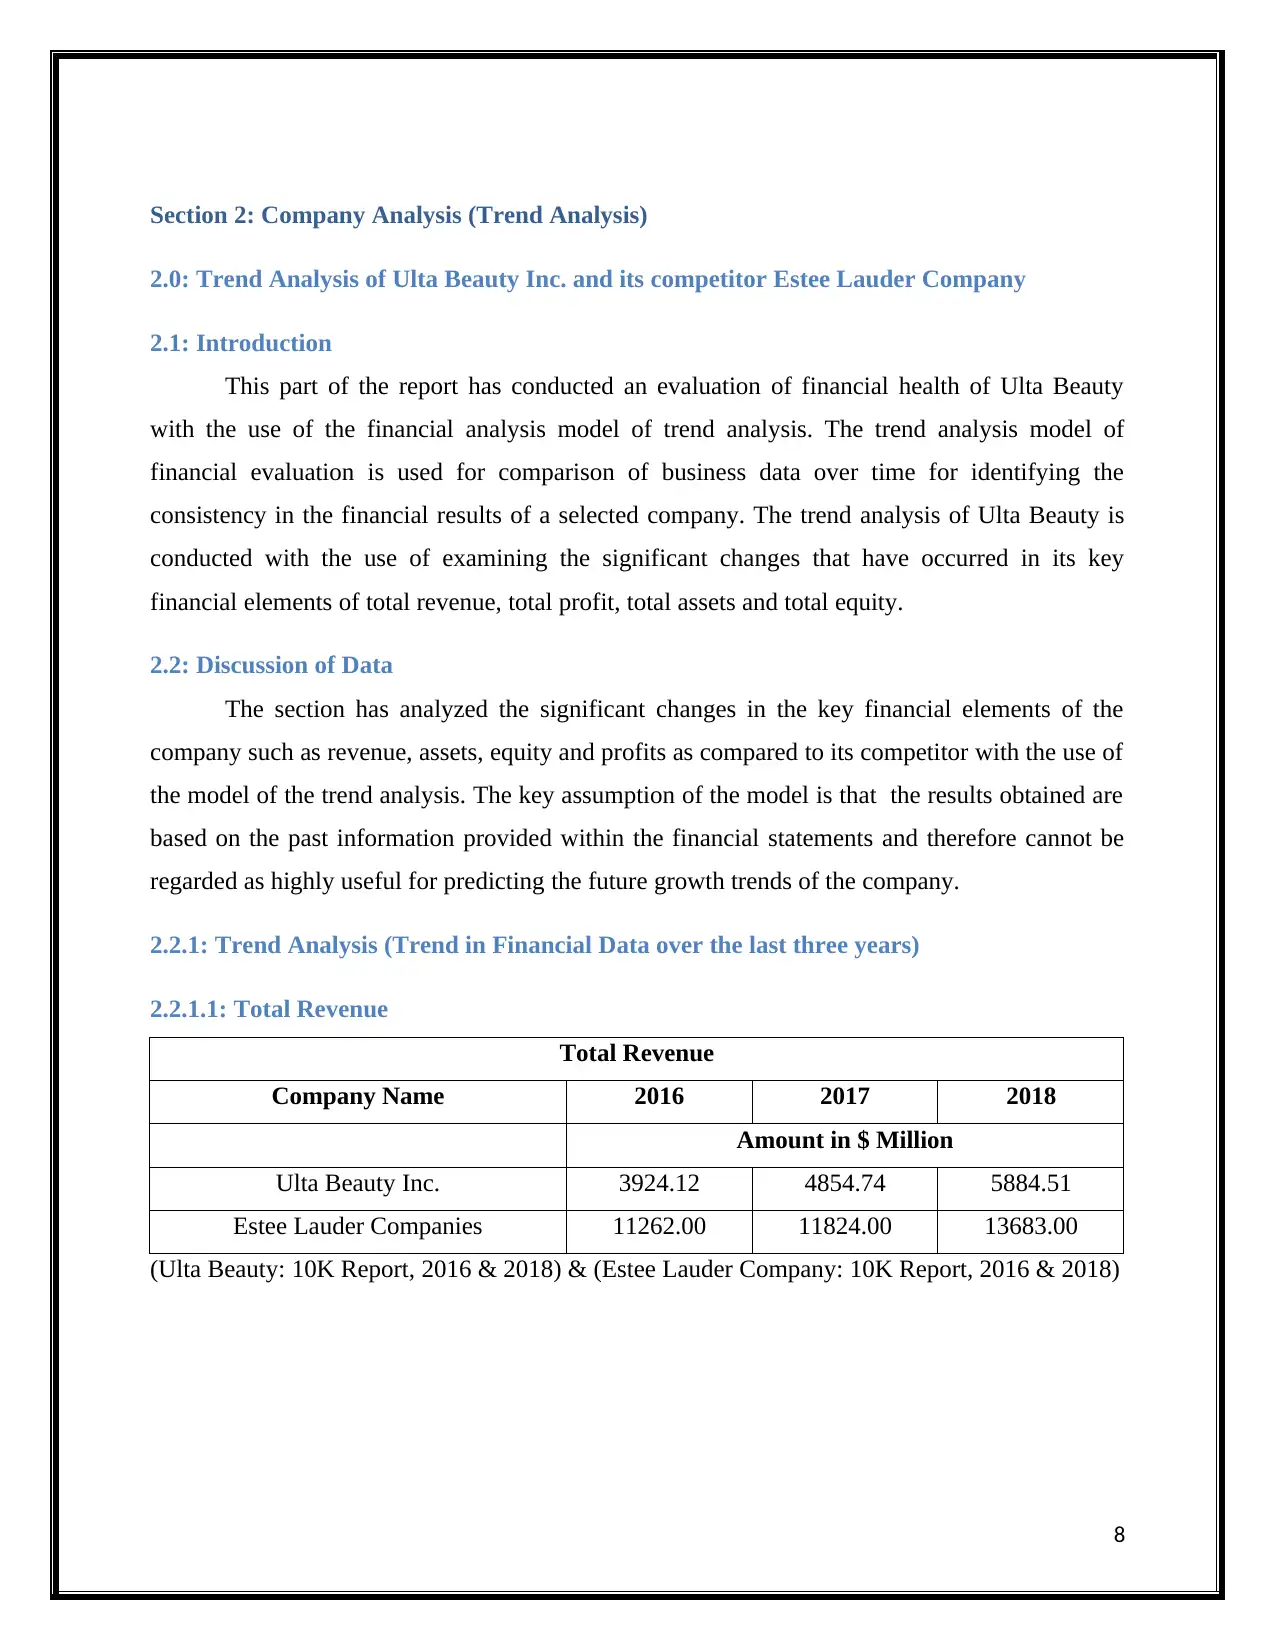
2.2.1.1: Total Revenue
Total Revenue
Company Name 2016 2017 2018
Amount in $ Million
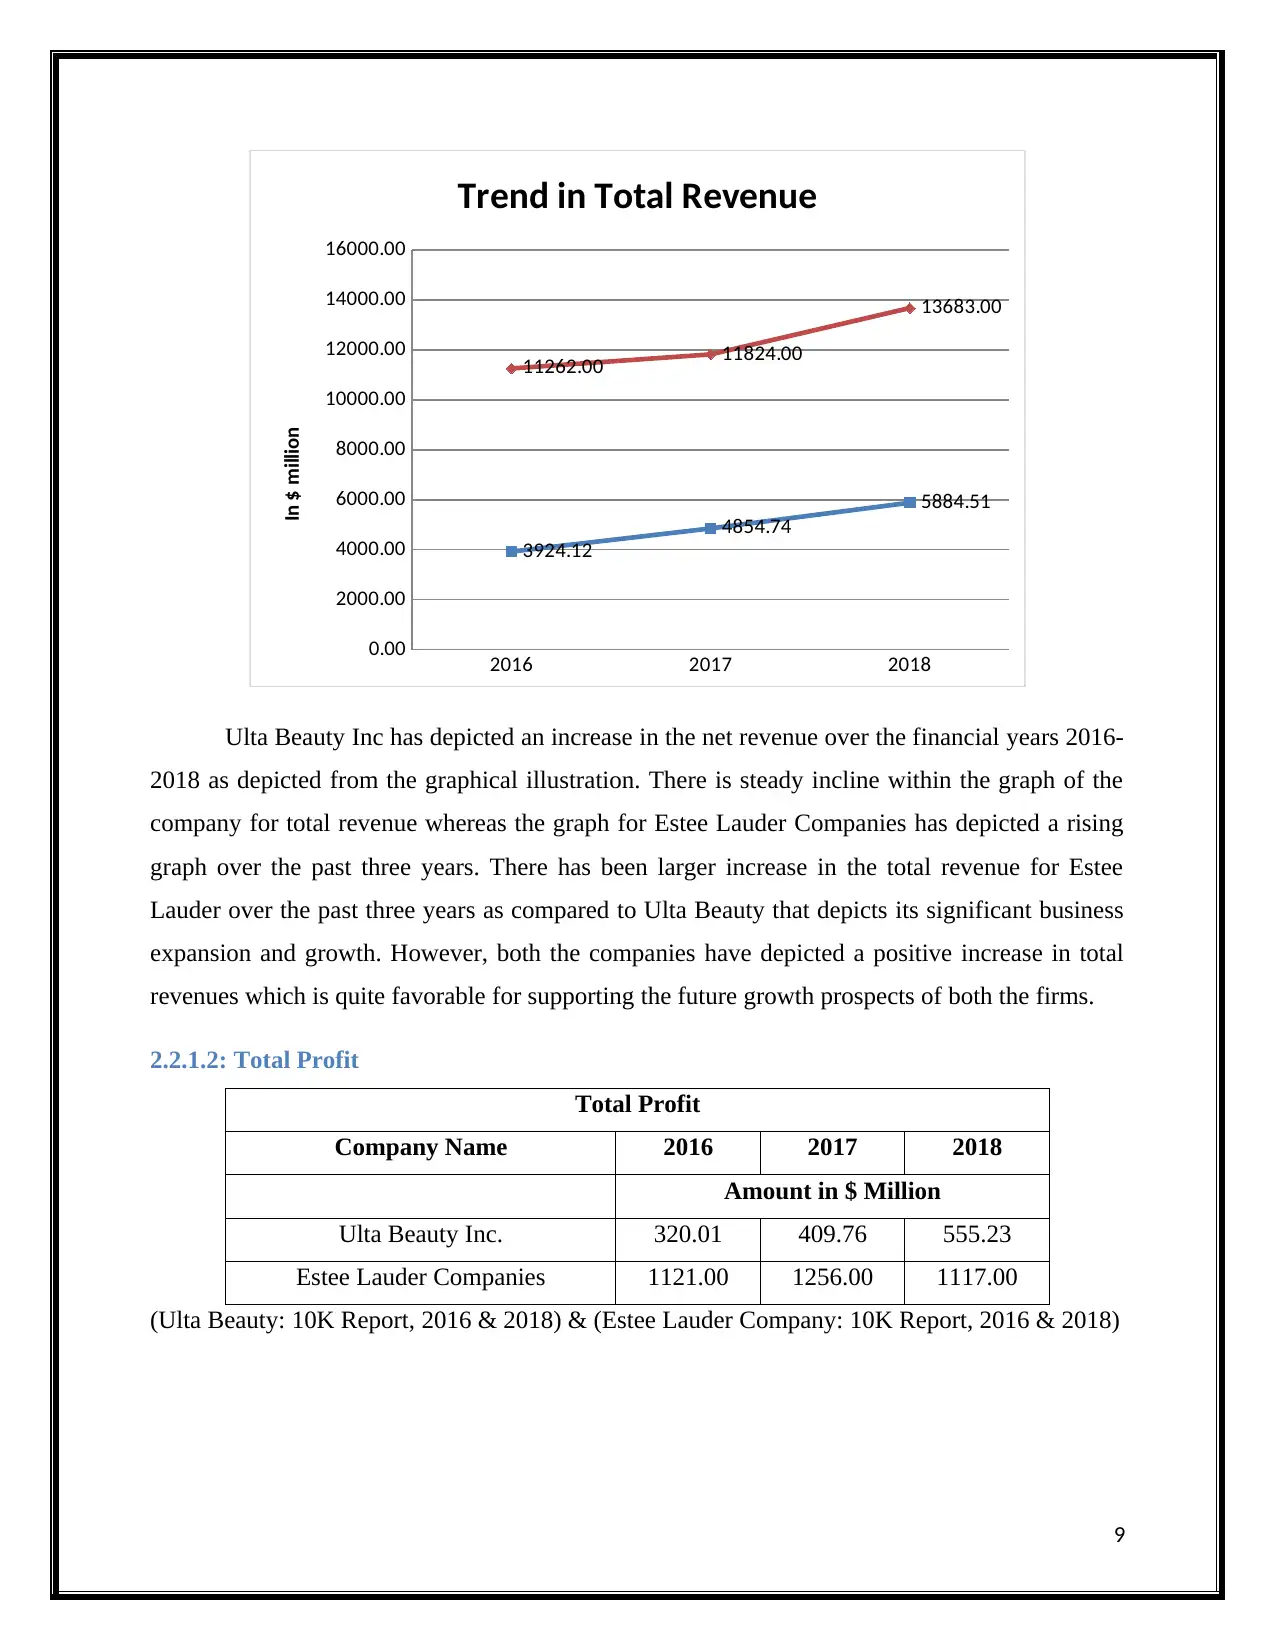
Ulta Beauty Inc. 3924.12 4854.74 5884.51
Estee Lauder Companies 11262.00 11824.00 13683.00
(Ulta Beauty: 10K Report, 2016 & 2018) & (Estee Lauder Company: 10K Report, 2016 & 2018)
8
2.0: Trend Analysis of Ulta Beauty Inc. and its competitor Estee Lauder Company
2.1: Introduction
This part of the report has conducted an evaluation of financial health of Ulta Beauty
with the use of the financial analysis model of trend analysis. The trend analysis model of
financial evaluation is used for comparison of business data over time for identifying the
consistency in the financial results of a selected company. The trend analysis of Ulta Beauty is
conducted with the use of examining the significant changes that have occurred in its key
financial elements of total revenue, total profit, total assets and total equity.
2.2: Discussion of Data
The section has analyzed the significant changes in the key financial elements of the
company such as revenue, assets, equity and profits as compared to its competitor with the use of
the model of the trend analysis. The key assumption of the model is that the results obtained are
based on the past information provided within the financial statements and therefore cannot be
regarded as highly useful for predicting the future growth trends of the company.
2.2.1: Trend Analysis (Trend in Financial Data over the last three years)
2.2.1.1: Total Revenue
Total Revenue
Company Name 2016 2017 2018
Amount in $ Million
Ulta Beauty Inc. 3924.12 4854.74 5884.51
Estee Lauder Companies 11262.00 11824.00 13683.00
(Ulta Beauty: 10K Report, 2016 & 2018) & (Estee Lauder Company: 10K Report, 2016 & 2018)
8
2016 2017 2018
0.00
2000.00
4000.00
6000.00
8000.00
10000.00
12000.00
14000.00
16000.00
3924.12
4854.74
5884.51
11262.00 11824.00
13683.00
Trend in Total Revenue
In $ million
Ulta Beauty Inc has depicted an increase in the net revenue over the financial years 2016-
2018 as depicted from the graphical illustration. There is steady incline within the graph of the
company for total revenue whereas the graph for Estee Lauder Companies has depicted a rising
graph over the past three years. There has been larger increase in the total revenue for Estee
Lauder over the past three years as compared to Ulta Beauty that depicts its significant business
expansion and growth. However, both the companies have depicted a positive increase in total
revenues which is quite favorable for supporting the future growth prospects of both the firms.
2.2.1.2: Total Profit
Total Profit
Company Name 2016 2017 2018
Amount in $ Million
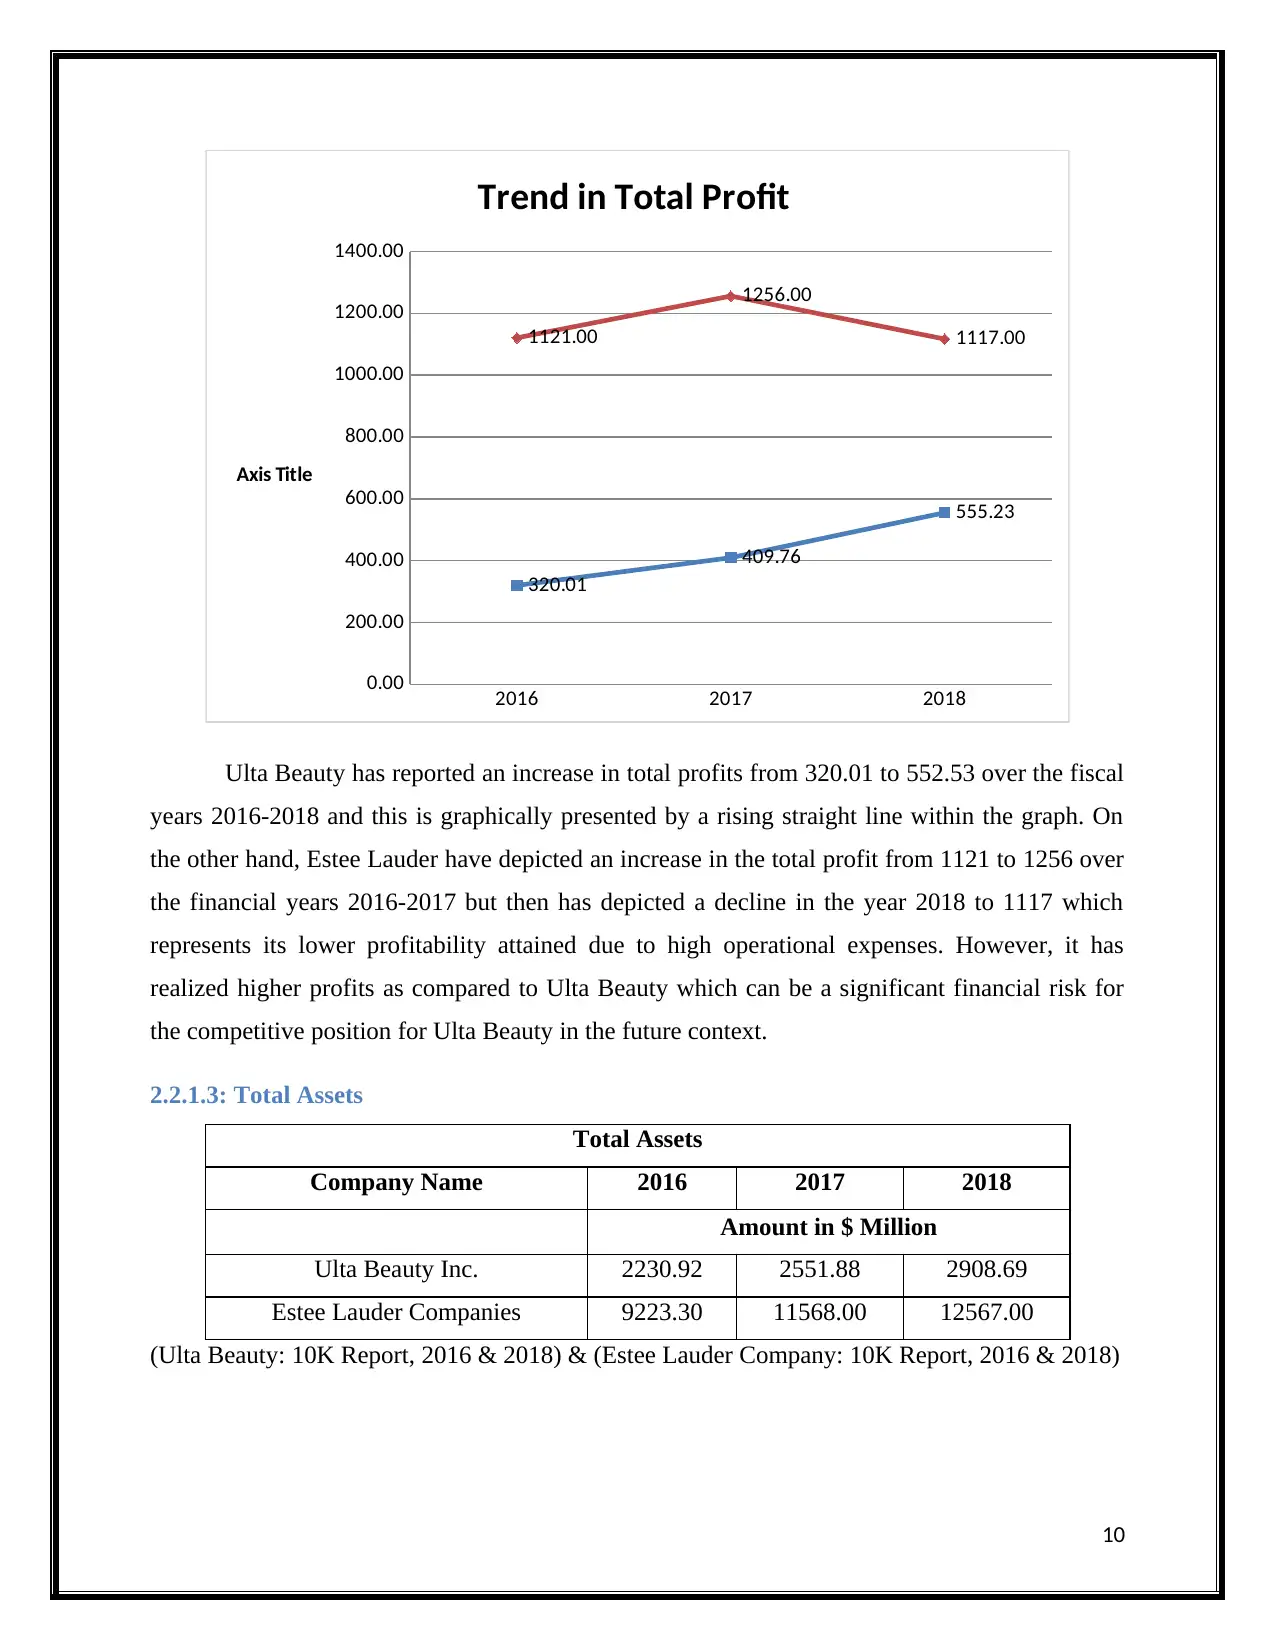
Ulta Beauty Inc. 320.01 409.76 555.23
Estee Lauder Companies 1121.00 1256.00 1117.00
(Ulta Beauty: 10K Report, 2016 & 2018) & (Estee Lauder Company: 10K Report, 2016 & 2018)
9
0.00
2000.00
4000.00
6000.00
8000.00
10000.00
12000.00
14000.00
16000.00
3924.12
4854.74
5884.51
11262.00 11824.00
13683.00
Trend in Total Revenue
In $ million
Ulta Beauty Inc has depicted an increase in the net revenue over the financial years 2016-
2018 as depicted from the graphical illustration. There is steady incline within the graph of the
company for total revenue whereas the graph for Estee Lauder Companies has depicted a rising
graph over the past three years. There has been larger increase in the total revenue for Estee
Lauder over the past three years as compared to Ulta Beauty that depicts its significant business
expansion and growth. However, both the companies have depicted a positive increase in total
revenues which is quite favorable for supporting the future growth prospects of both the firms.
2.2.1.2: Total Profit
Total Profit
Company Name 2016 2017 2018
Amount in $ Million
Ulta Beauty Inc. 320.01 409.76 555.23
Estee Lauder Companies 1121.00 1256.00 1117.00
(Ulta Beauty: 10K Report, 2016 & 2018) & (Estee Lauder Company: 10K Report, 2016 & 2018)
9
⊘ This is a preview!⊘
Do you want full access?
Subscribe today to unlock all pages.
Trusted by 1+ million students worldwide
2016 2017 2018
0.00
200.00
400.00
600.00
800.00
1000.00
1200.00
1400.00
320.01
409.76
555.23
1121.00
1256.00
1117.00
Trend in Total Profit
Axis Title
Ulta Beauty has reported an increase in total profits from 320.01 to 552.53 over the fiscal
years 2016-2018 and this is graphically presented by a rising straight line within the graph. On
the other hand, Estee Lauder have depicted an increase in the total profit from 1121 to 1256 over
the financial years 2016-2017 but then has depicted a decline in the year 2018 to 1117 which
represents its lower profitability attained due to high operational expenses. However, it has
realized higher profits as compared to Ulta Beauty which can be a significant financial risk for
the competitive position for Ulta Beauty in the future context.
2.2.1.3: Total Assets
Total Assets
Company Name 2016 2017 2018
Amount in $ Million
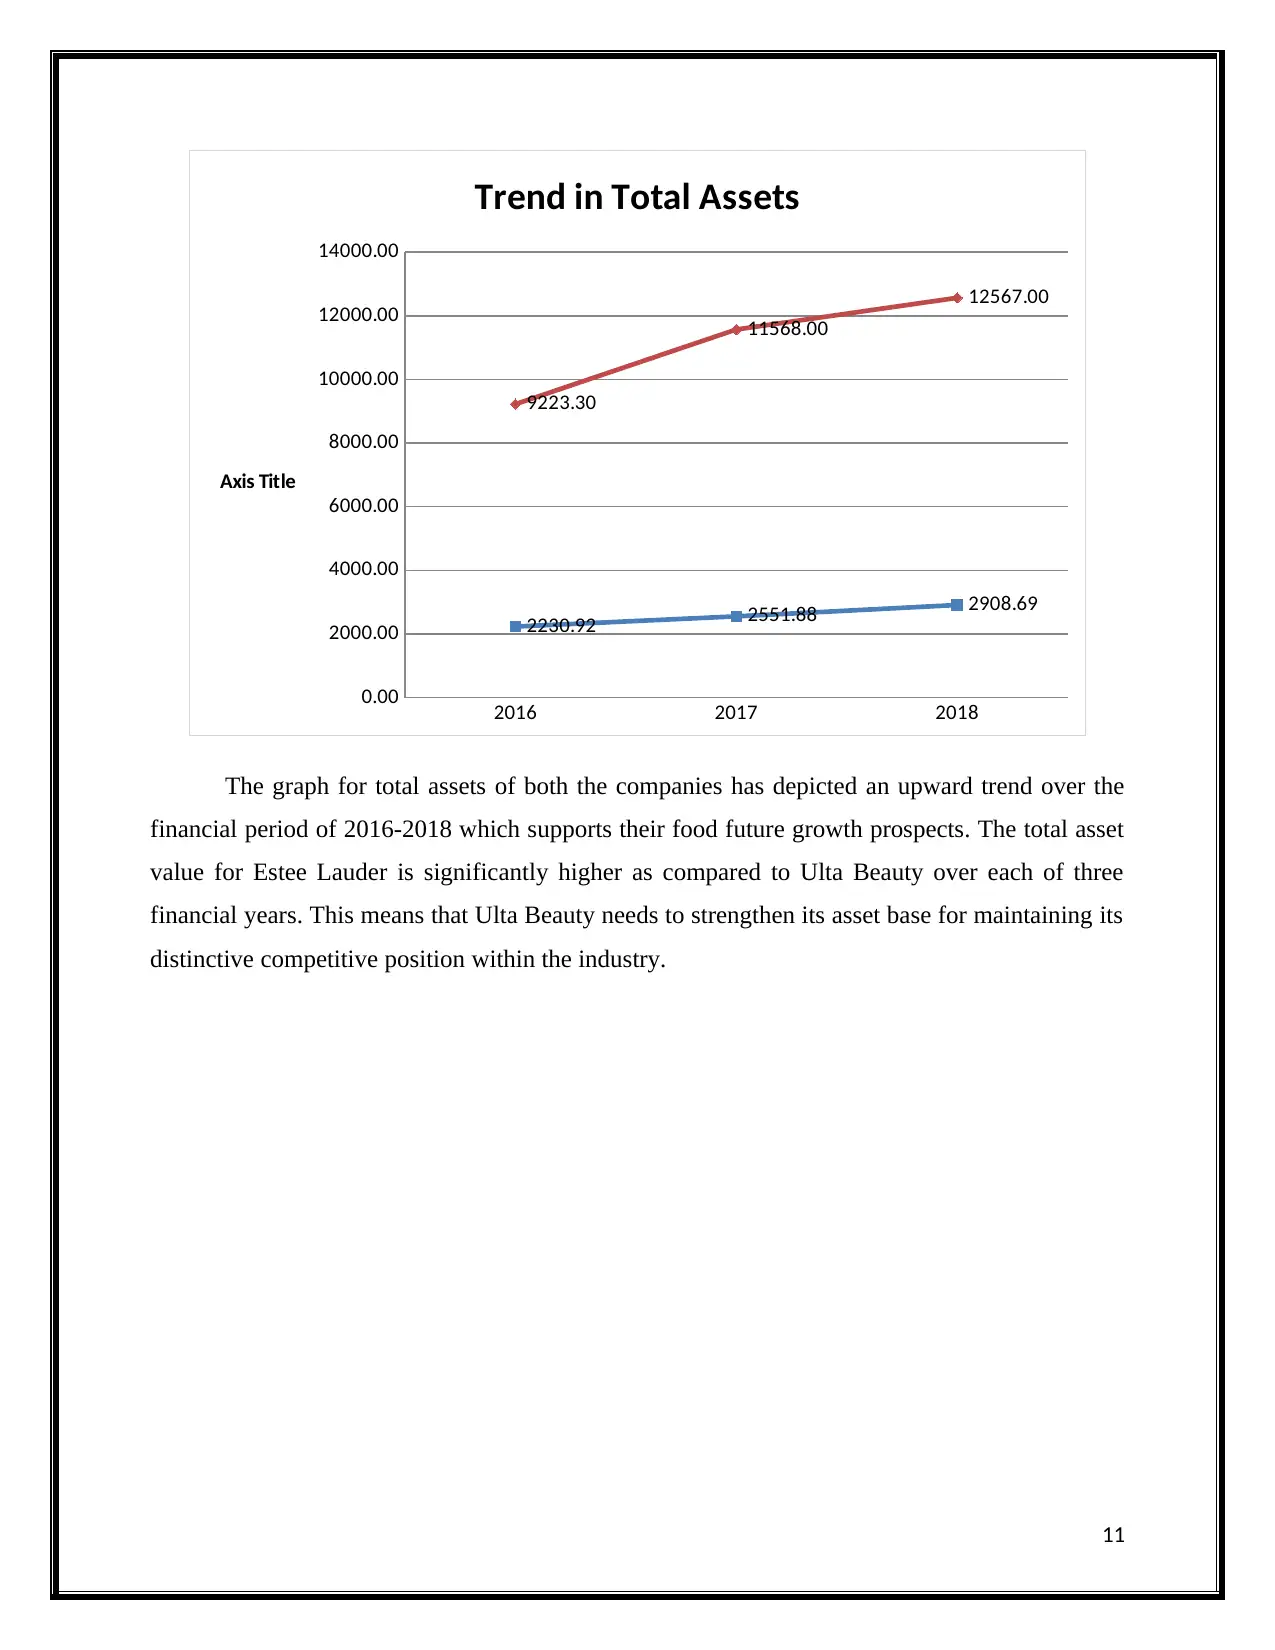
Ulta Beauty Inc. 2230.92 2551.88 2908.69
Estee Lauder Companies 9223.30 11568.00 12567.00
(Ulta Beauty: 10K Report, 2016 & 2018) & (Estee Lauder Company: 10K Report, 2016 & 2018)
10
0.00
200.00
400.00
600.00
800.00
1000.00
1200.00
1400.00
320.01
409.76
555.23
1121.00
1256.00
1117.00
Trend in Total Profit
Axis Title
Ulta Beauty has reported an increase in total profits from 320.01 to 552.53 over the fiscal
years 2016-2018 and this is graphically presented by a rising straight line within the graph. On
the other hand, Estee Lauder have depicted an increase in the total profit from 1121 to 1256 over
the financial years 2016-2017 but then has depicted a decline in the year 2018 to 1117 which
represents its lower profitability attained due to high operational expenses. However, it has
realized higher profits as compared to Ulta Beauty which can be a significant financial risk for
the competitive position for Ulta Beauty in the future context.
2.2.1.3: Total Assets
Total Assets
Company Name 2016 2017 2018
Amount in $ Million
Ulta Beauty Inc. 2230.92 2551.88 2908.69
Estee Lauder Companies 9223.30 11568.00 12567.00
(Ulta Beauty: 10K Report, 2016 & 2018) & (Estee Lauder Company: 10K Report, 2016 & 2018)
10
Paraphrase This Document
Need a fresh take? Get an instant paraphrase of this document with our AI Paraphraser
2016 2017 2018
0.00
2000.00
4000.00
6000.00
8000.00
10000.00
12000.00
14000.00
2230.92 2551.88 2908.69
9223.30
11568.00
12567.00
Trend in Total Assets
Axis Title
The graph for total assets of both the companies has depicted an upward trend over the
financial period of 2016-2018 which supports their food future growth prospects. The total asset
value for Estee Lauder is significantly higher as compared to Ulta Beauty over each of three
financial years. This means that Ulta Beauty needs to strengthen its asset base for maintaining its
distinctive competitive position within the industry.
11
2.2.1.4: Total Equity
Total Equity
Company Name 2016 2017 2018
Amount in $ Million
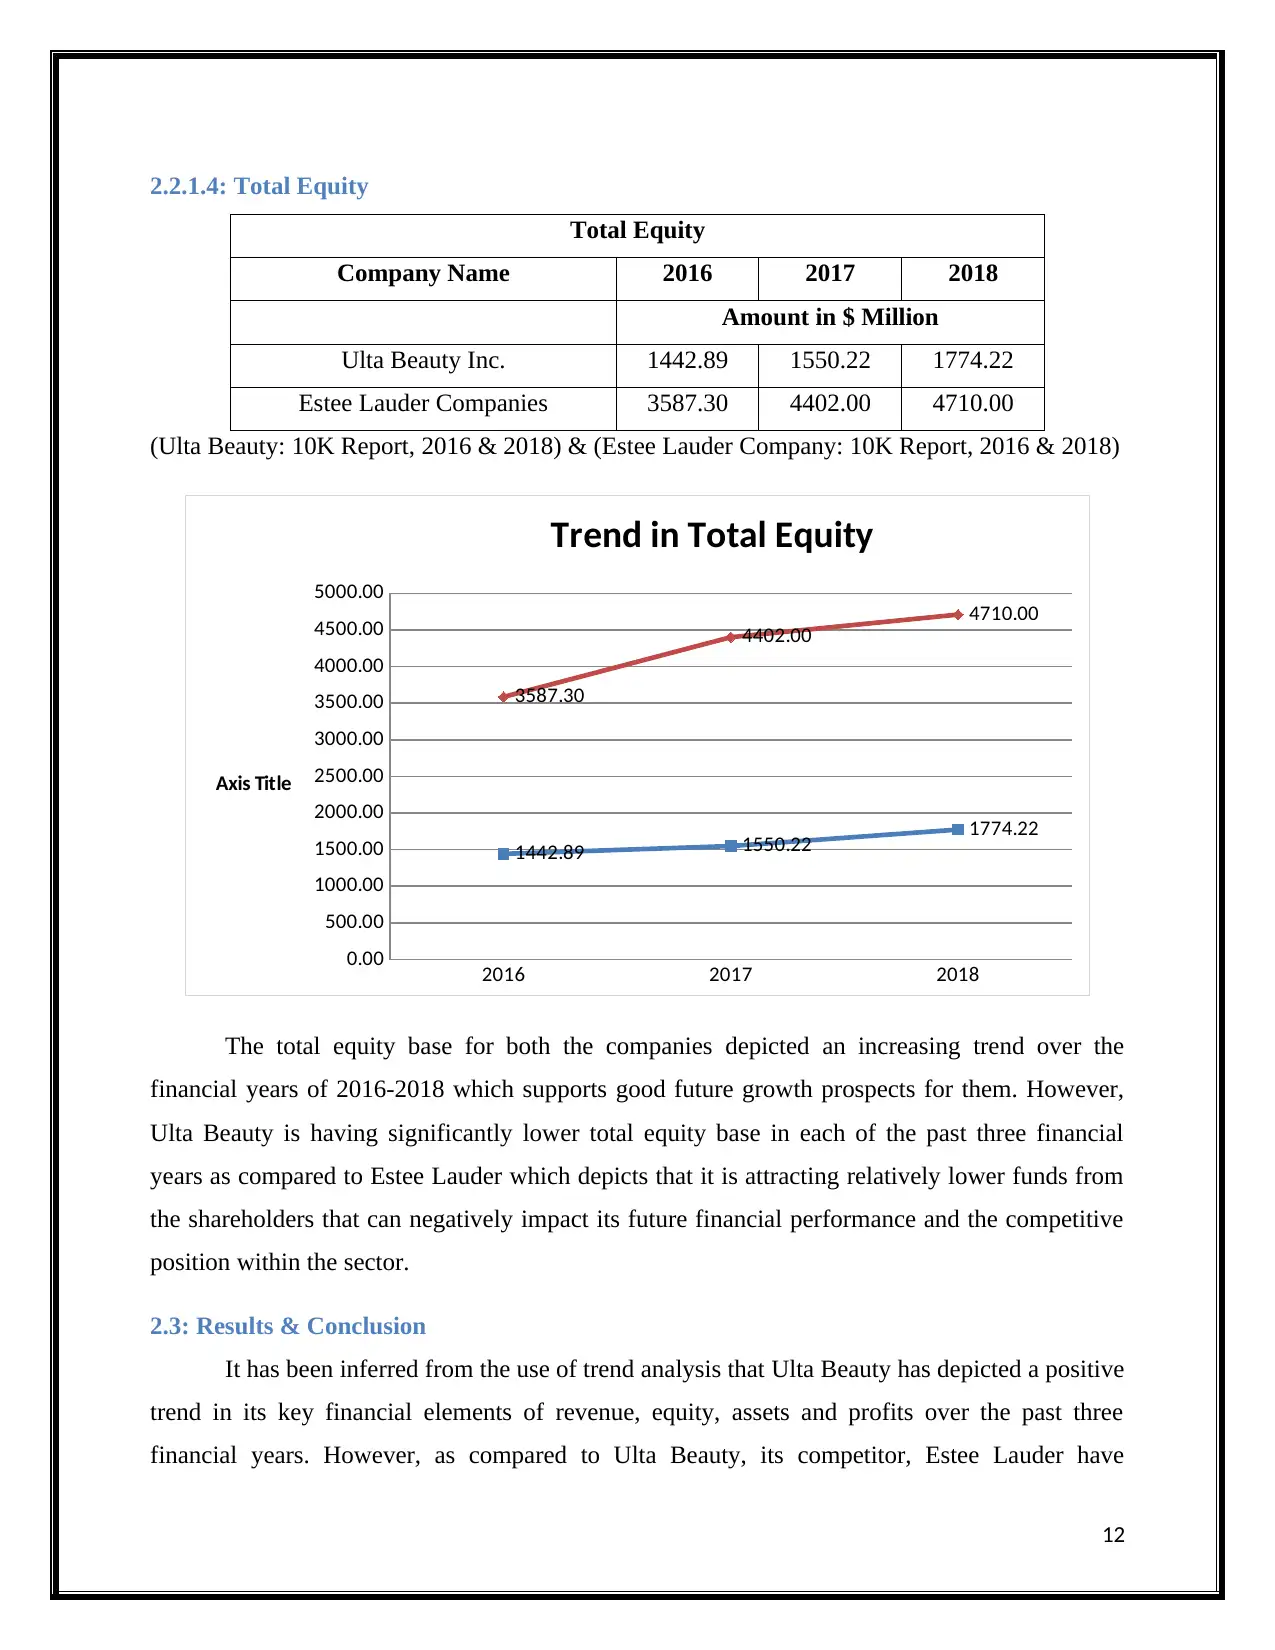
Ulta Beauty Inc. 1442.89 1550.22 1774.22
Estee Lauder Companies 3587.30 4402.00 4710.00
(Ulta Beauty: 10K Report, 2016 & 2018) & (Estee Lauder Company: 10K Report, 2016 & 2018)
2016 2017 2018
0.00
500.00
1000.00
1500.00
2000.00
2500.00
3000.00
3500.00
4000.00
4500.00
5000.00
1442.89 1550.22 1774.22
3587.30
4402.00
4710.00
Trend in Total Equity
Axis Title
The total equity base for both the companies depicted an increasing trend over the
financial years of 2016-2018 which supports good future growth prospects for them. However,
Ulta Beauty is having significantly lower total equity base in each of the past three financial
years as compared to Estee Lauder which depicts that it is attracting relatively lower funds from
the shareholders that can negatively impact its future financial performance and the competitive
position within the sector.
2.3: Results & Conclusion
It has been inferred from the use of trend analysis that Ulta Beauty has depicted a positive
trend in its key financial elements of revenue, equity, assets and profits over the past three
financial years. However, as compared to Ulta Beauty, its competitor, Estee Lauder have
12
Total Equity
Company Name 2016 2017 2018
Amount in $ Million
Ulta Beauty Inc. 1442.89 1550.22 1774.22
Estee Lauder Companies 3587.30 4402.00 4710.00
(Ulta Beauty: 10K Report, 2016 & 2018) & (Estee Lauder Company: 10K Report, 2016 & 2018)
2016 2017 2018
0.00
500.00
1000.00
1500.00
2000.00
2500.00
3000.00
3500.00
4000.00
4500.00
5000.00
1442.89 1550.22 1774.22
3587.30
4402.00
4710.00
Trend in Total Equity
Axis Title
The total equity base for both the companies depicted an increasing trend over the
financial years of 2016-2018 which supports good future growth prospects for them. However,
Ulta Beauty is having significantly lower total equity base in each of the past three financial
years as compared to Estee Lauder which depicts that it is attracting relatively lower funds from
the shareholders that can negatively impact its future financial performance and the competitive
position within the sector.
2.3: Results & Conclusion
It has been inferred from the use of trend analysis that Ulta Beauty has depicted a positive
trend in its key financial elements of revenue, equity, assets and profits over the past three
financial years. However, as compared to Ulta Beauty, its competitor, Estee Lauder have
12
⊘ This is a preview!⊘
Do you want full access?
Subscribe today to unlock all pages.
Trusted by 1+ million students worldwide
1 out of 24
Related Documents


Your All-in-One AI-Powered Toolkit for Academic Success.
+13062052269
info@desklib.com
Available 24*7 on WhatsApp / Email
![[object Object]](/_next/static/media/star-bottom.7253800d.svg)
Unlock your academic potential
Copyright © 2020–2026 A2Z Services. All Rights Reserved. Developed and managed by ZUCOL.