ITECH1100 Assignment: Maternitywear Revival Automation Project
VerifiedAdded on 2022/08/23
|7
|852
|18
Project
AI Summary
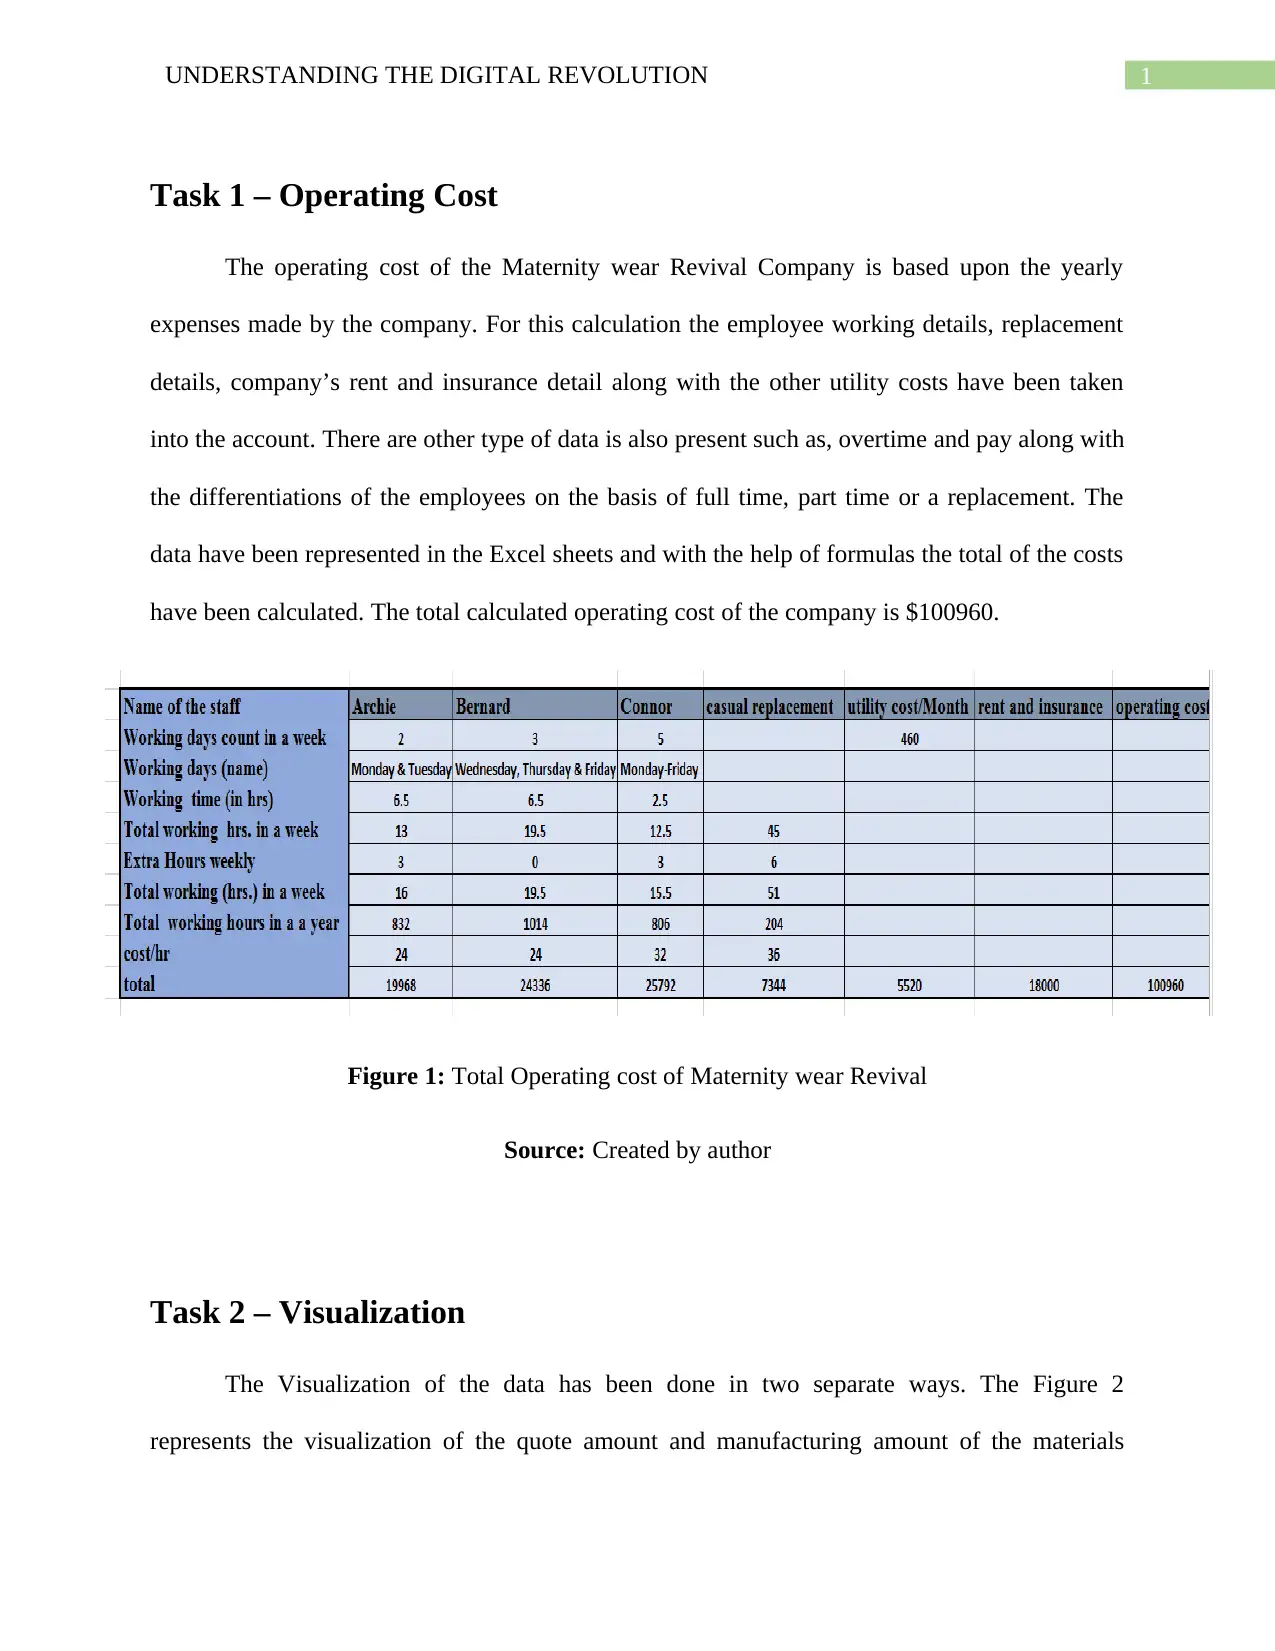
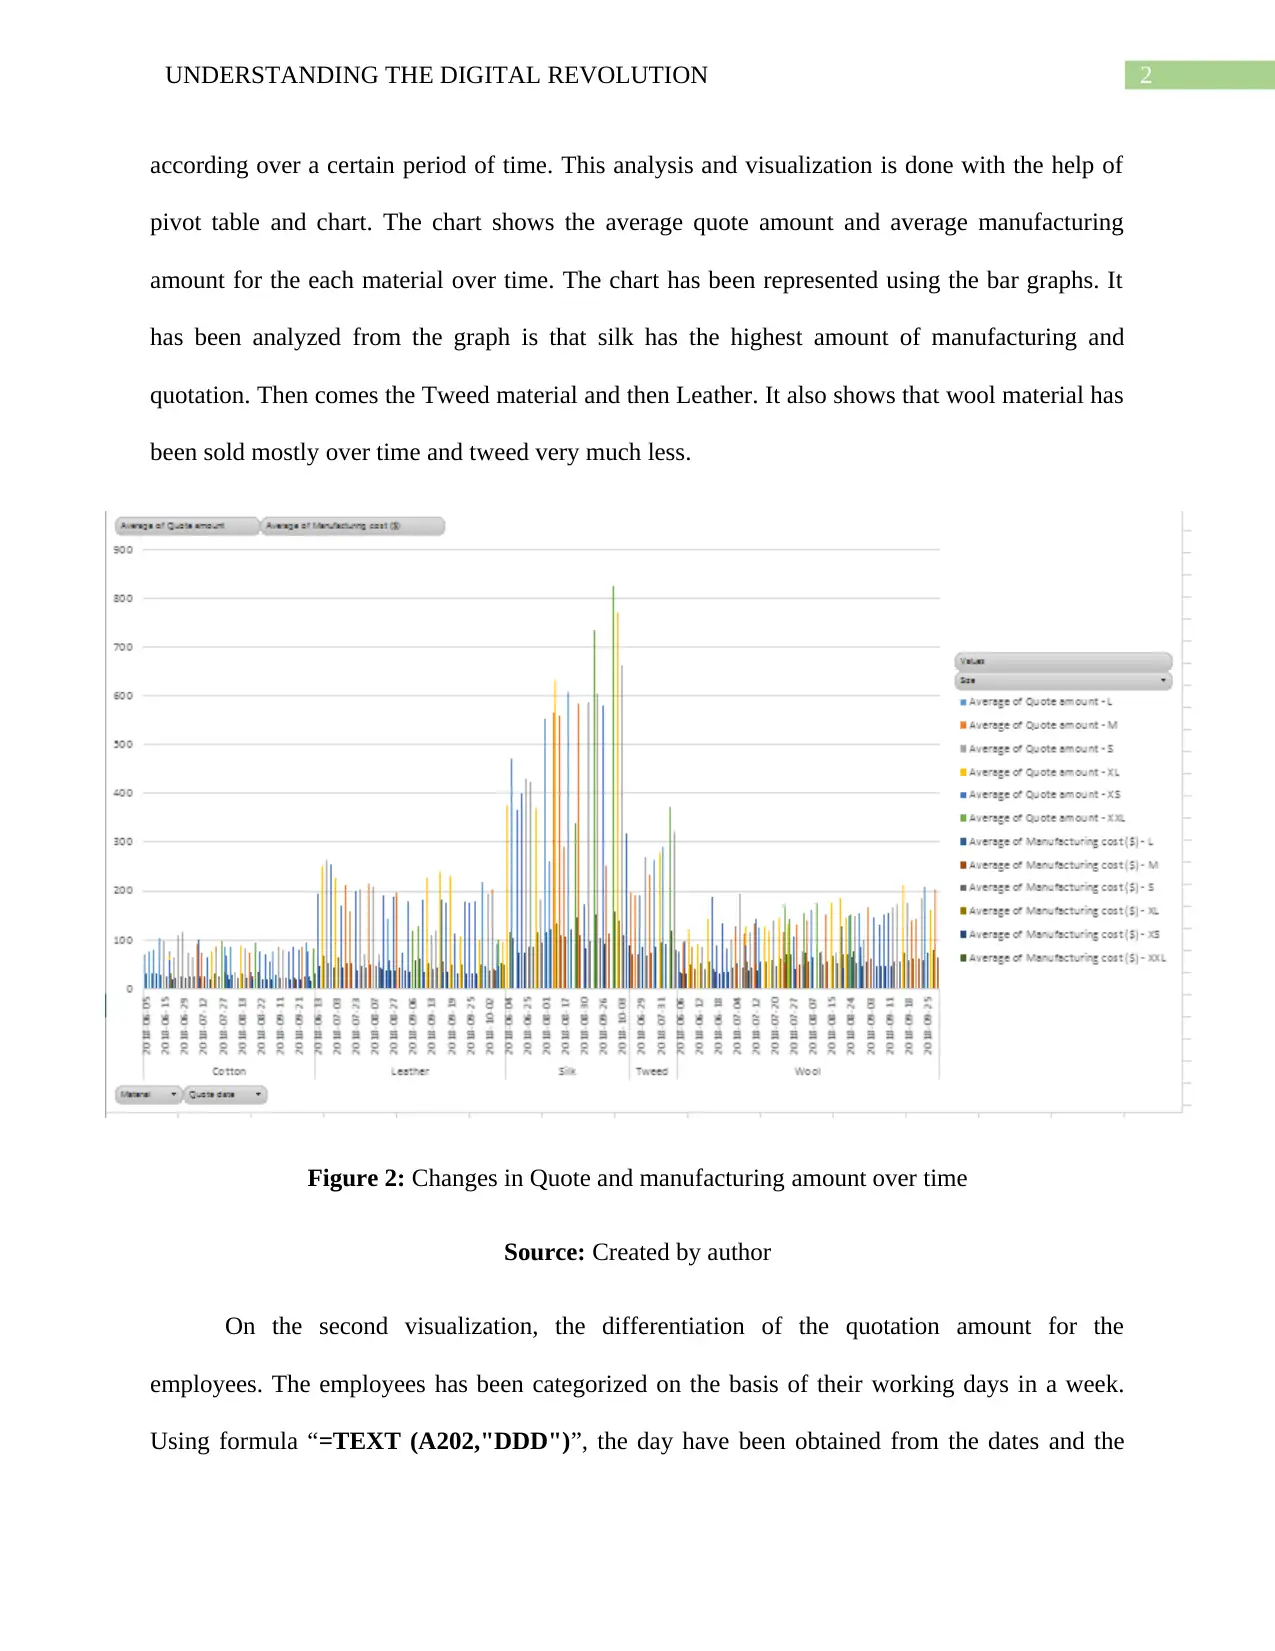
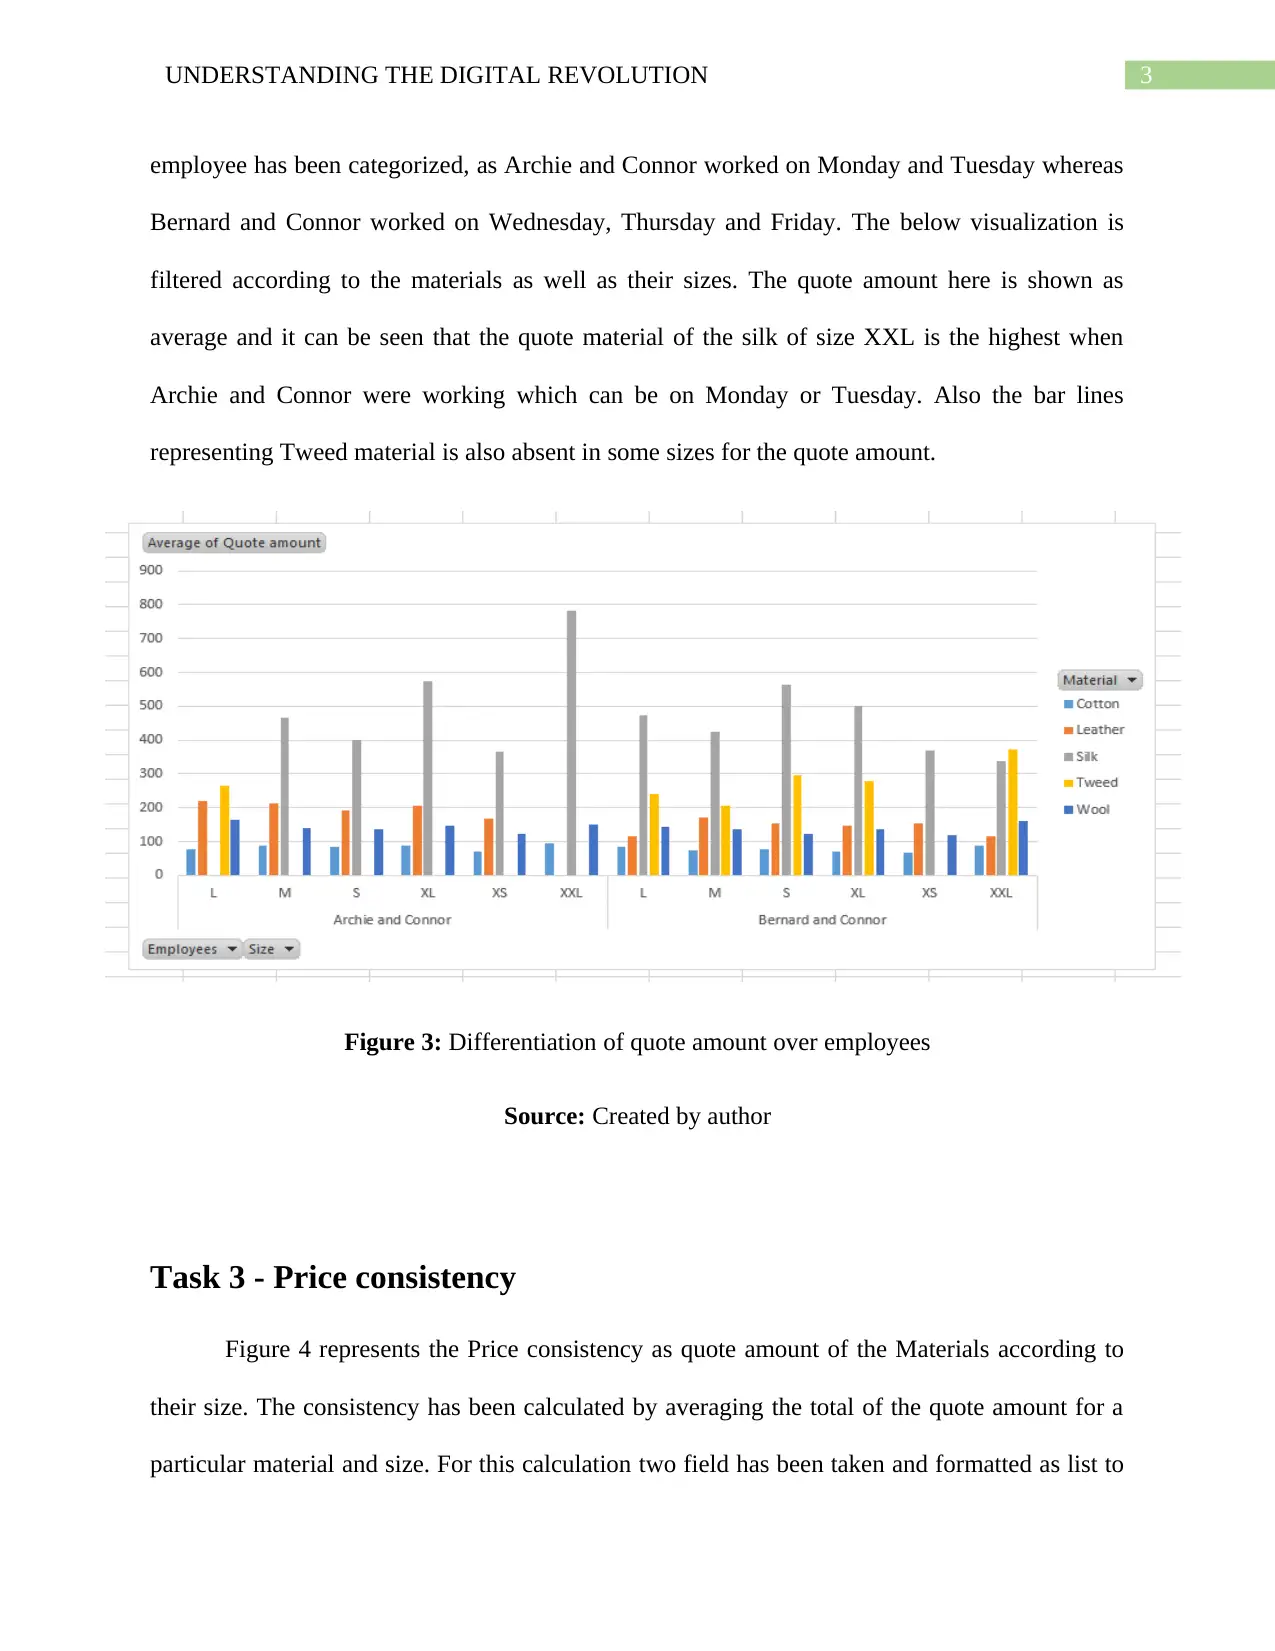
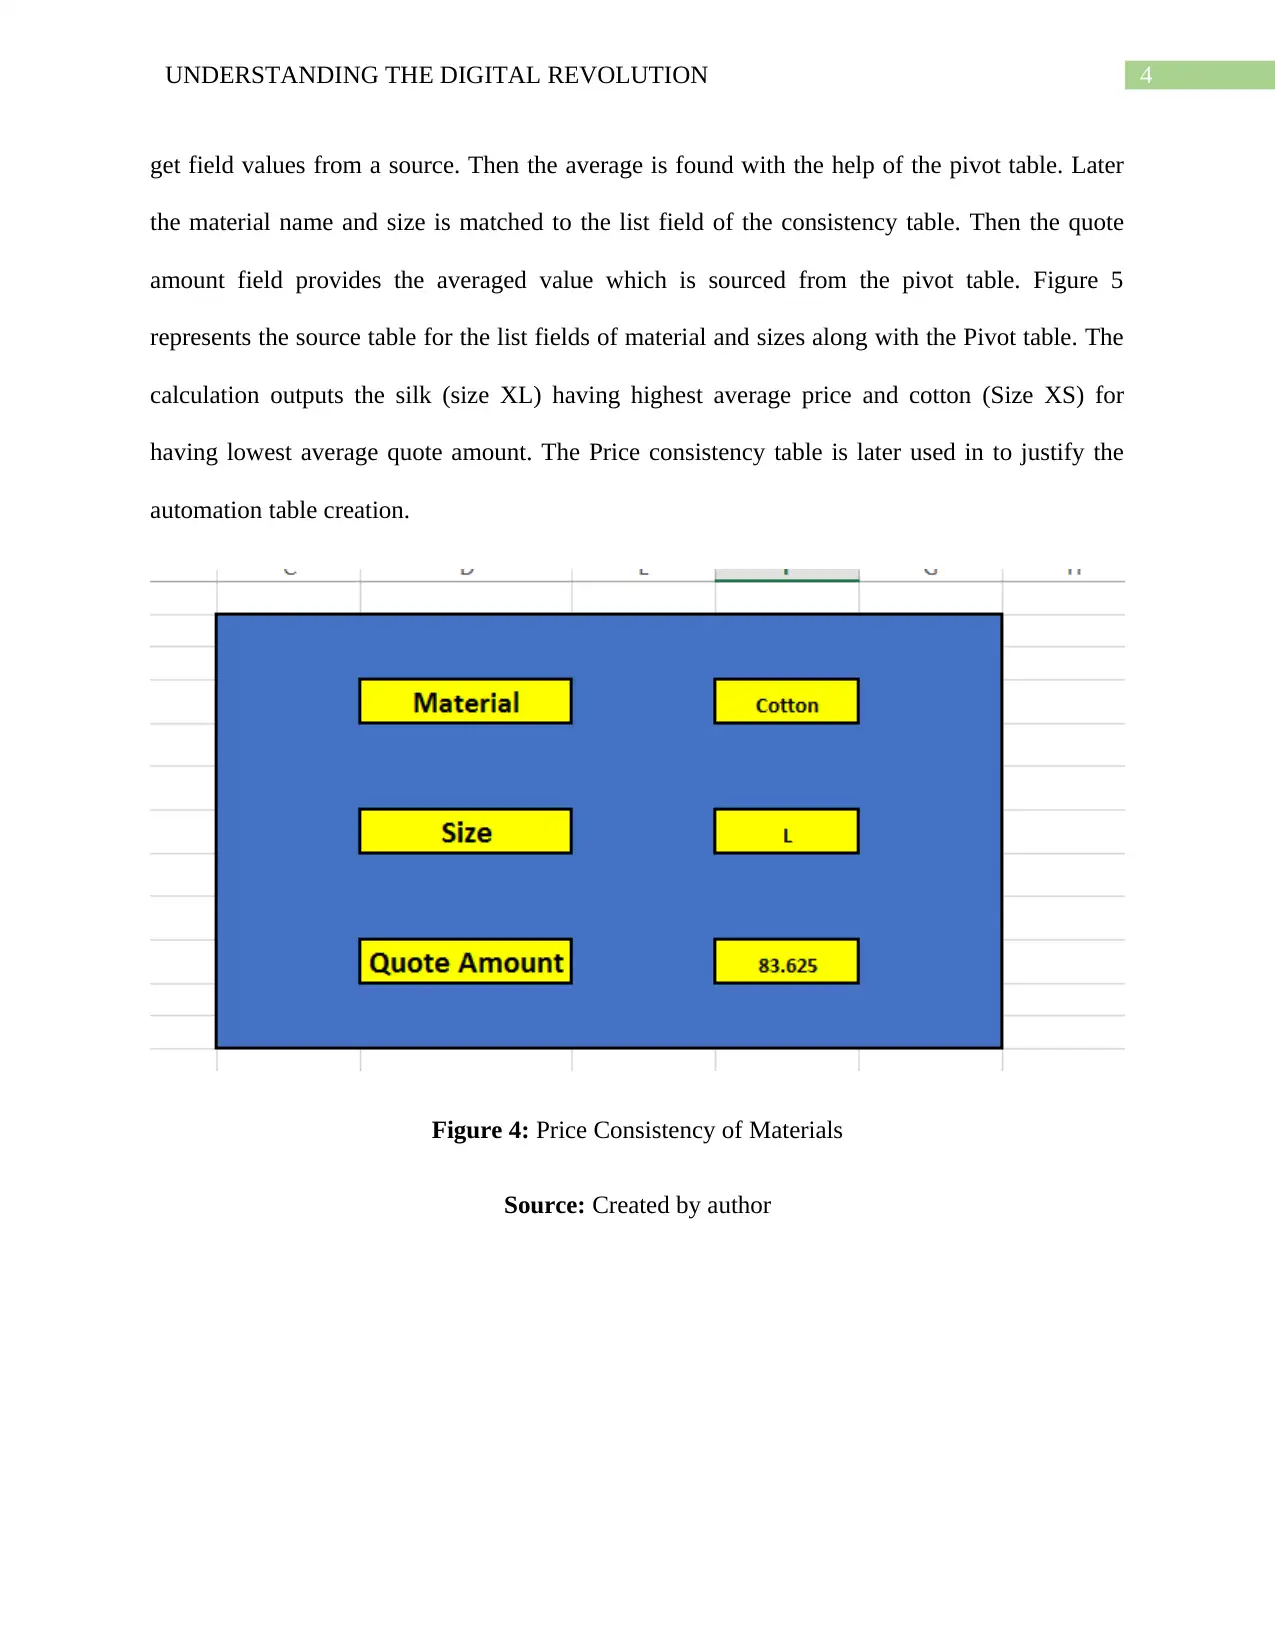
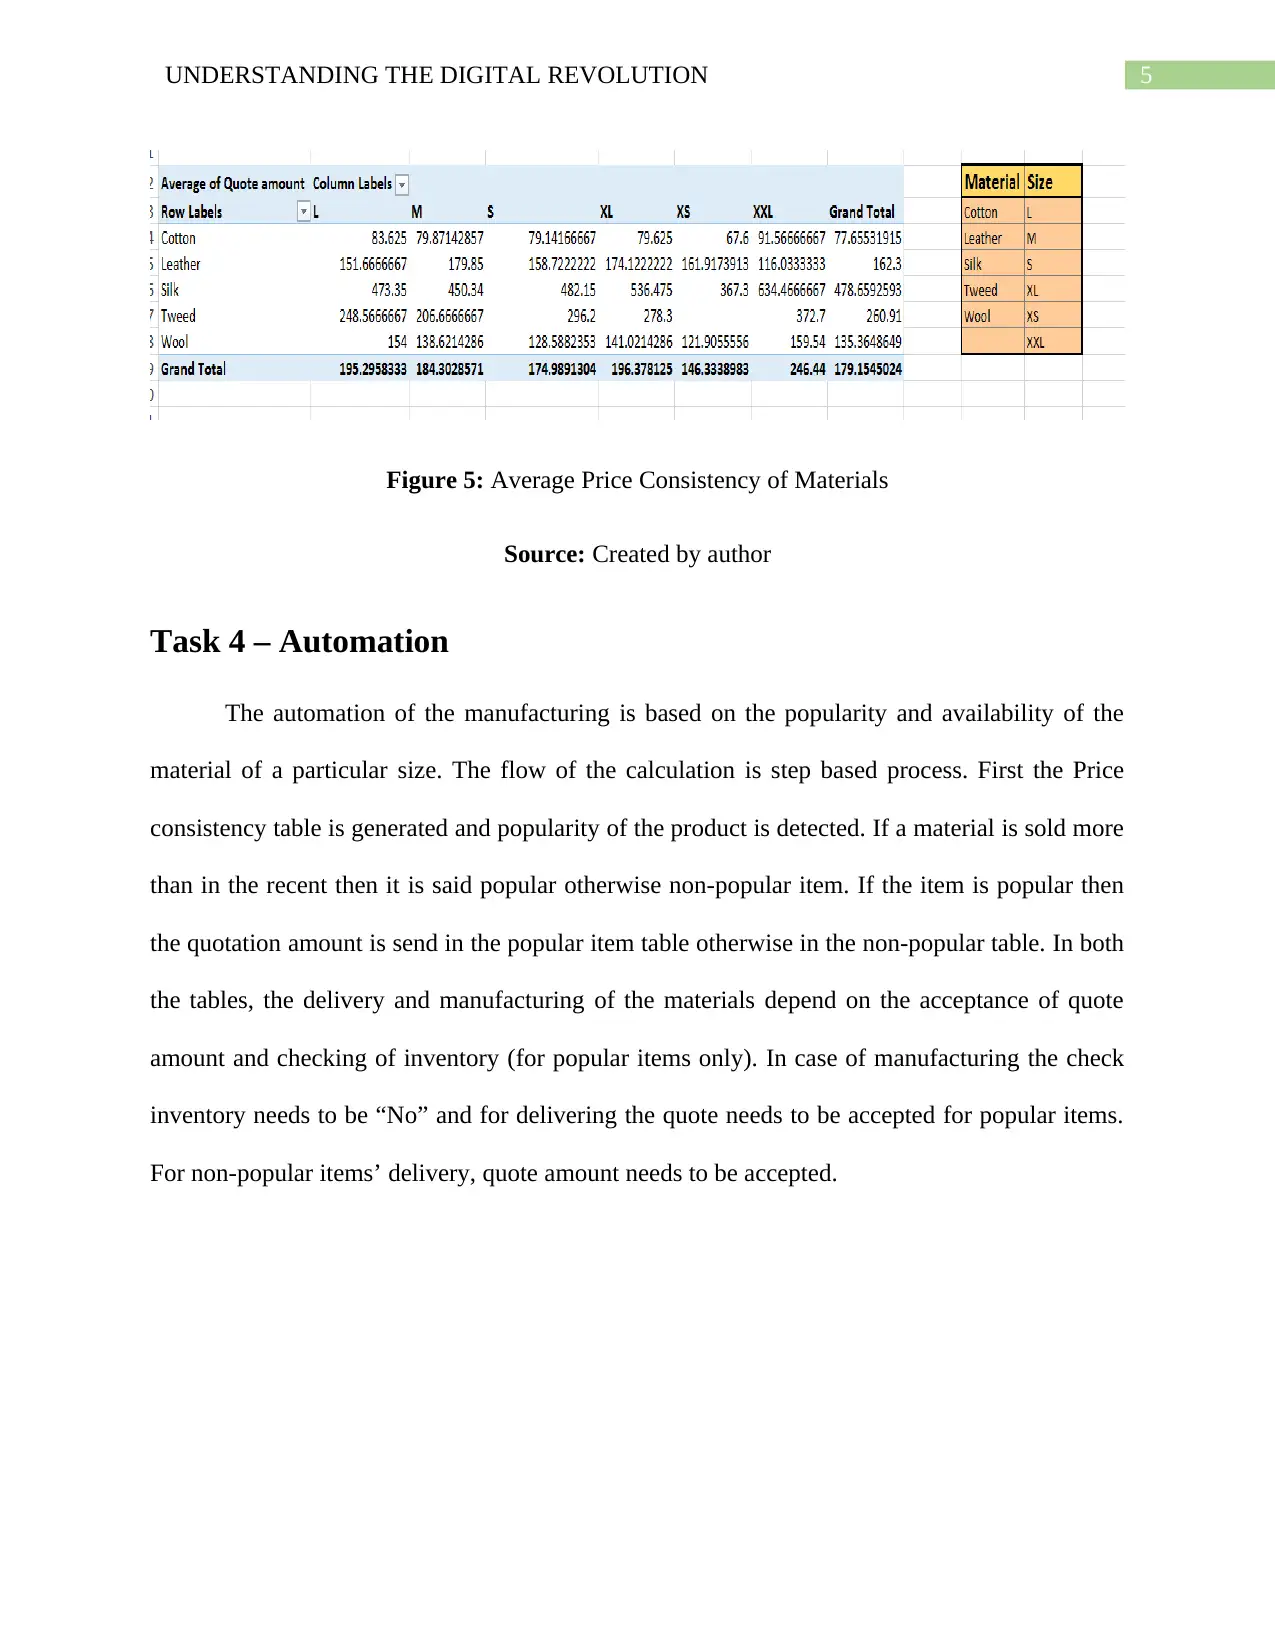
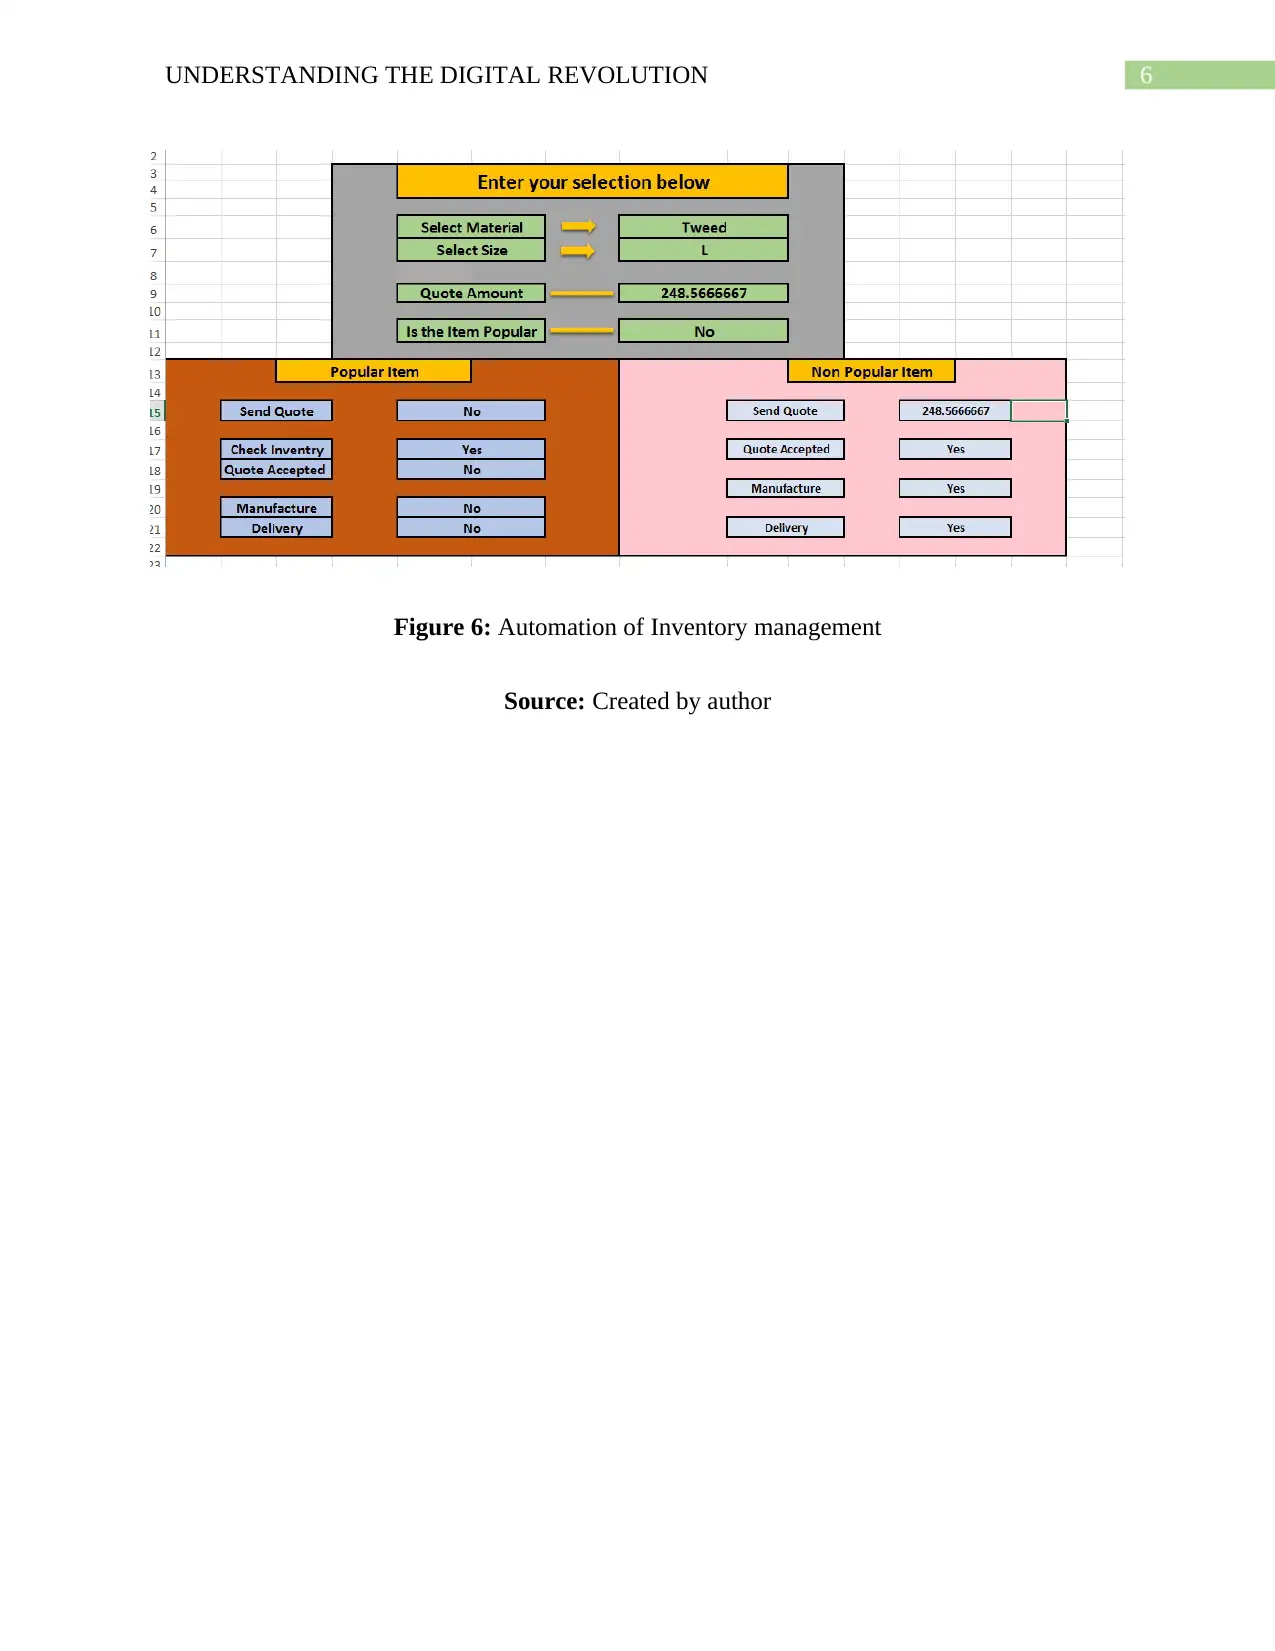
This assignment focuses on automating business processes for the Maternitywear Revival Company using Microsoft Excel. The project begins with calculating the company's total operating costs, considering employee details, rent, insurance, and other utilities, with a total operating cost of $100960. The next task involves data visualization, using pivot tables and charts to analyze quote amounts and manufacturing amounts over time for different materials like silk, tweed, leather, and wool. The visualization also differentiates quote amounts based on employee working days and material sizes. The third task addresses price consistency, calculating average quote amounts for materials based on size, and uses pivot tables for analysis. The final task automates manufacturing based on the popularity and availability of materials, creating tables for popular and non-popular items, and managing inventory based on quote acceptance and inventory checks. The project includes figures illustrating each step of the analysis and automation process.
1 out of 7
Related Documents


Your All-in-One AI-Powered Toolkit for Academic Success.
+13062052269
info@desklib.com
Available 24*7 on WhatsApp / Email
![[object Object]](/_next/static/media/star-bottom.7253800d.svg)
Copyright © 2020–2026 A2Z Services. All Rights Reserved. Developed and managed by ZUCOL.