Comprehensive Report: The Oil and Gas Industry Analysis
VerifiedAdded on 2021/04/16
|11
|2353
|35
Report
AI Summary
This report provides a comprehensive overview of the oil and gas industry, examining its structure, key players such as international oil companies (IOCs), national oil companies (NOCs), and government-sponsored enterprises. It delves into the industry's supply chain, including upstream, midstream, and downstream operations, and explores the journey of petroleum and natural gas products like gasoline and biogas. The report also analyzes the demand and seasonality of these products, highlighting factors that influence market dynamics. The oil and gas industry is a global powerhouse, employing thousands and generating billions annually. The report emphasizes the importance of NOCs in regions with significant contributions to the national GDP. The discussion includes the rise of NOCs, the journey of petroleum and natural gas products, and the supply chain components. The report concludes with a summary of the industry's significance and its contribution to the global economy.
Running head: UNDERSTANDING OIL AND GAS
Understanding Oil and Gas
Name of the University:
Name of the Student:
Author Note:
Understanding Oil and Gas
Name of the University:
Name of the Student:
Author Note:
Paraphrase This Document
Need a fresh take? Get an instant paraphrase of this document with our AI Paraphraser
1UNDERSTANDING OIL AND GAS
Table of Contents
Introduction................................................................................................................................2
Discussion..................................................................................................................................2
International Oil Companies..................................................................................................2
National Oil Companies.........................................................................................................3
Government Sponsored Enterprises.......................................................................................4
Journey of a petroleum product and natural gas product.......................................................4
Supply chain (Upstream, Midstream and Downstream)....................................................5
Demand and seasonality of the products............................................................................7
Conclusion..................................................................................................................................8
References..................................................................................................................................9
2UNDERSTANDING OIL AND GAS
Introduction
The oil and gas industry is regarded as the leading sector of the world in the terms of
dollar value. It is the global powerhouse that employs thousands of workers all across the
world and at the same time, it generates billions of dollars each year, globally. In the regions
that house the major NOCs, the oil and gas companies are considered to be immensely
important and vital for their contribution of a significant amount to the national Gross
Domestic Product (Kelland 2014). The oil and gas industry is broken into three major areas,
that is; Upstream, midstream and downstream. Upstream component refers to the exploration,
which involves the search for underground and underwater natural gas fields. The report
discusses about the history and structure of this industry, different roles of international,
national and government sponsored enterprises, the supply chains and the demand as well as
seasonality of the chosen products (Yusuf et al. 2014).
Discussion
International Oil Companies
There has been a wild ride for the investors in world’s biggest publicly traded
companies of oil and natural gas, for the past two years. As compared with the high water
marks in the middle 2014, the shares of Big Oil went down to around twenty five percent and
the earnings collapsed. The big irony was that even the oil prices reduced, Big Oil is growing
and getting bigger. According to the Energy Information Administration, in the mid 2014, the
production of oil was 8.75 million barrels per day, in the United States. Later on, it has grown
to around 9.69 million bpd, which became its highest level in the forty five years (Warneke et
al. 2014).
⊘ This is a preview!⊘
Do you want full access?
Subscribe today to unlock all pages.
Trusted by 1+ million students worldwide
3UNDERSTANDING OIL AND GAS
However, the production of oil, in the United States has declined to more than half a
billion, but the global production still continues to increase. The global production of the oil
industry has increased to 94.8 million bpd from 92.4 million bpd. In addition to this, a unique
aspect of recent surge is that majority of the gains did not come from the oil companies of
OPEC’s. However, Saudi Arabia has one of the major national oil companies; Saudi Aramco
remains the world’s most undisputed production leader and the Western as well as Russian
companies have made their contributions towards the production level since the past few
decades (Olaguer 2012).
National Oil Companies
A national oil company, often abbreviated as NOC, is the oil and gas company that is
fully or the majority is owned by the national government. As per the World Bank, the
national oil and gas company accounts for around seventy percent of the global oil production
as well as controlled by ninety percent of the proven oil reserves in the year 2010. Due to the
ever increasing dominance on the global reserves, the overall importance of the NOCs in
comparison to the international oil companies like Royal Dutch Shell, British Petroleum,
Exxon Mobil and more, has increased dramatically in the recent times (Papavinasam 2013).
In reference to this, the national oil companies are also increasing their investments
outside the national borders. The government controlled companies have managed to
dominate the ranks of world’s biggest energy producers. On the basis of the combined oil as
well as gas productions for the year 2014, fifteen out of twenty world’s biggest energy
production companies are the state owned organizations controlled by the national
governments. Moreover, out of six, four biggest oil companies owned by the state
government, operate in Middle East region with the state controlled energy resources (Logan
and McNeish 2012). In addition to this, other state owned companies of oil and gas are
located in China and Russia, Africa and Latin America.
Paraphrase This Document
Need a fresh take? Get an instant paraphrase of this document with our AI Paraphraser
4UNDERSTANDING OIL AND GAS
Government Sponsored Enterprises
The government sponsored enterprises comprises privately held oil corporations along
with the public purposes as created by the United States’ congressmen in order to reduce the
costs of oil and gas. Moreover, in Mexico, there are two major government sponsored
enterprises and both of them are in the energy sector. The government sponsored enterprises
are the ones where the state has control over the companies, either by full, significant
minority or majority ownership. In most of the OPEC countries, government officials own
several oil and gas companies that operate on their areas (Kumar and Rabinovitch 2013). In
addition to this, the government sponsored enterprises prove to be beneficial as they reduce
the influence of the politicians over the services.
A noteworthy example of this is Saudi national oil and gas company and Saudi
Aramco that the government of the Saudi bought in the year 1988. It changed its name to
Saudi Arabian Oil Company from the Arabian American Oil Company. Moreover, the
government officials of Saudi Arabia also operate and own Saudi Arabian Airlines. In
addition to this, it owns around seventy percent of the Saudi Basic Industries Corporation and
other companies as well (Bergh et al. 2014). In the year 2012, according to the IMF reports,
around eighty percent of the world’s petroleum reservoirs were controlled by the government
owned companies and out of twenty, fifteen oil companies were state owned (Paik 2012).
Journey of a petroleum product and natural gas product
Gasoline is a petroleum product, which is transparent in nature and used primarily as
the fuel in the spark ignited internal combustion engines. It comprises of the organic
compounds and is obtained by fractional distillation of the petroleum that is enhanced with
various additives. However, bio gas is a natural gas product, which is typically a mixture of
various gases that is produced by breakdown of the organic matters due to the absence of
5UNDERSTANDING OIL AND GAS
oxygen. The differences between gasoline and bio gas is that gasoline is a non renewable
resource and bio gas is a renewable resource (Skogdalen and Vinnem 2012).
Gasoline is made from the crude oil that was formed millions of years ago from the
remains of the tiny aquatic animals and plants. The bio gas is a bio fuel that is produced from
anaerobic fermentation of the carbohydrates in waste materials of bacteria or plant materials.
The comparison between both the products is that they are both from natural sources and
human beings highly depend on them. Both the products produce huge amount of energy and
grow on earth (Mohanty et al. 2013). In addition to this, people must use both the products
wisely as they may impact the environment, at large.
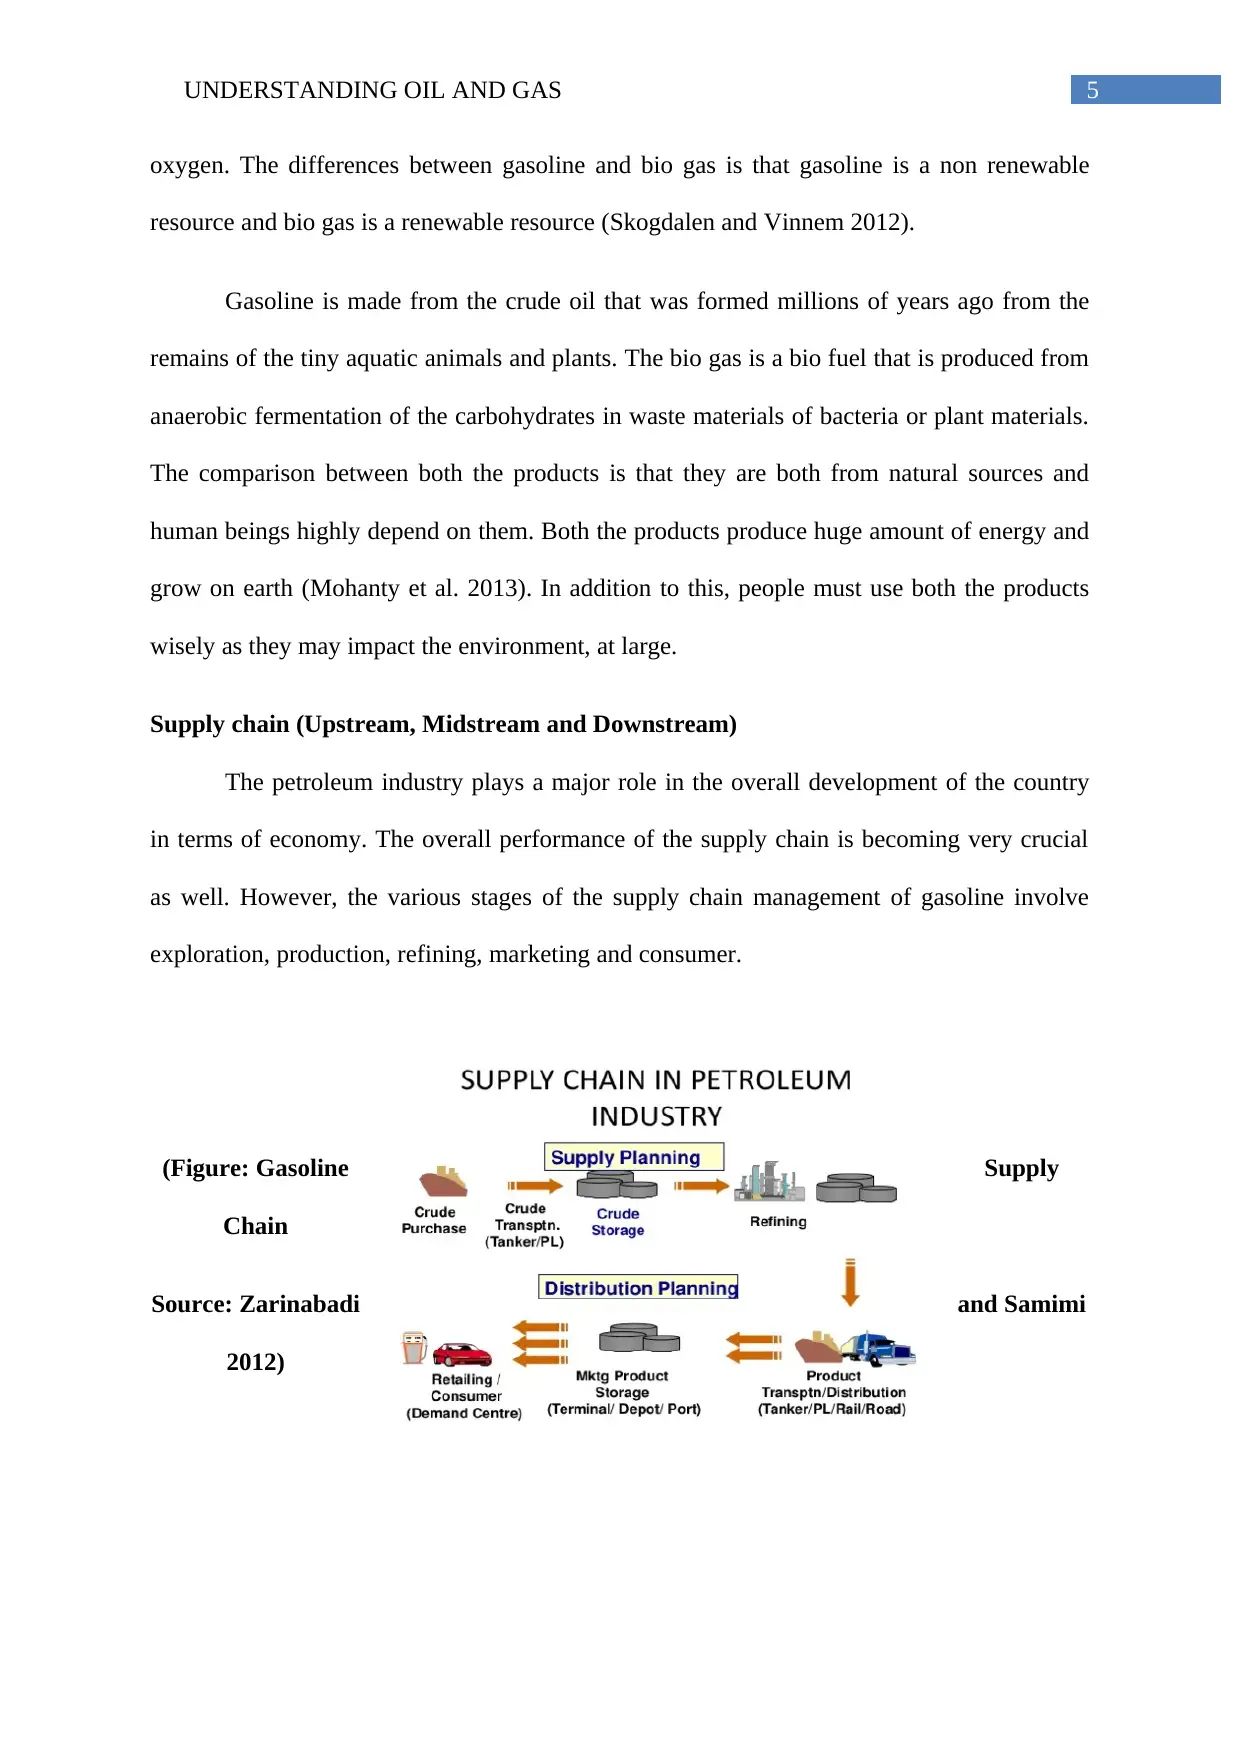
Supply chain (Upstream, Midstream and Downstream)
The petroleum industry plays a major role in the overall development of the country
in terms of economy. The overall performance of the supply chain is becoming very crucial
as well. However, the various stages of the supply chain management of gasoline involve
exploration, production, refining, marketing and consumer.
(Figure: Gasoline Supply
Chain
Source: Zarinabadi and Samimi
2012)
oxygen. The differences between gasoline and bio gas is that gasoline is a non renewable
resource and bio gas is a renewable resource (Skogdalen and Vinnem 2012).
Gasoline is made from the crude oil that was formed millions of years ago from the
remains of the tiny aquatic animals and plants. The bio gas is a bio fuel that is produced from
anaerobic fermentation of the carbohydrates in waste materials of bacteria or plant materials.
The comparison between both the products is that they are both from natural sources and
human beings highly depend on them. Both the products produce huge amount of energy and
grow on earth (Mohanty et al. 2013). In addition to this, people must use both the products
wisely as they may impact the environment, at large.
Supply chain (Upstream, Midstream and Downstream)
The petroleum industry plays a major role in the overall development of the country
in terms of economy. The overall performance of the supply chain is becoming very crucial
as well. However, the various stages of the supply chain management of gasoline involve
exploration, production, refining, marketing and consumer.
(Figure: Gasoline Supply
Chain
Source: Zarinabadi and Samimi
2012)
⊘ This is a preview!⊘
Do you want full access?
Subscribe today to unlock all pages.
Trusted by 1+ million students worldwide
6UNDERSTANDING OIL AND GAS
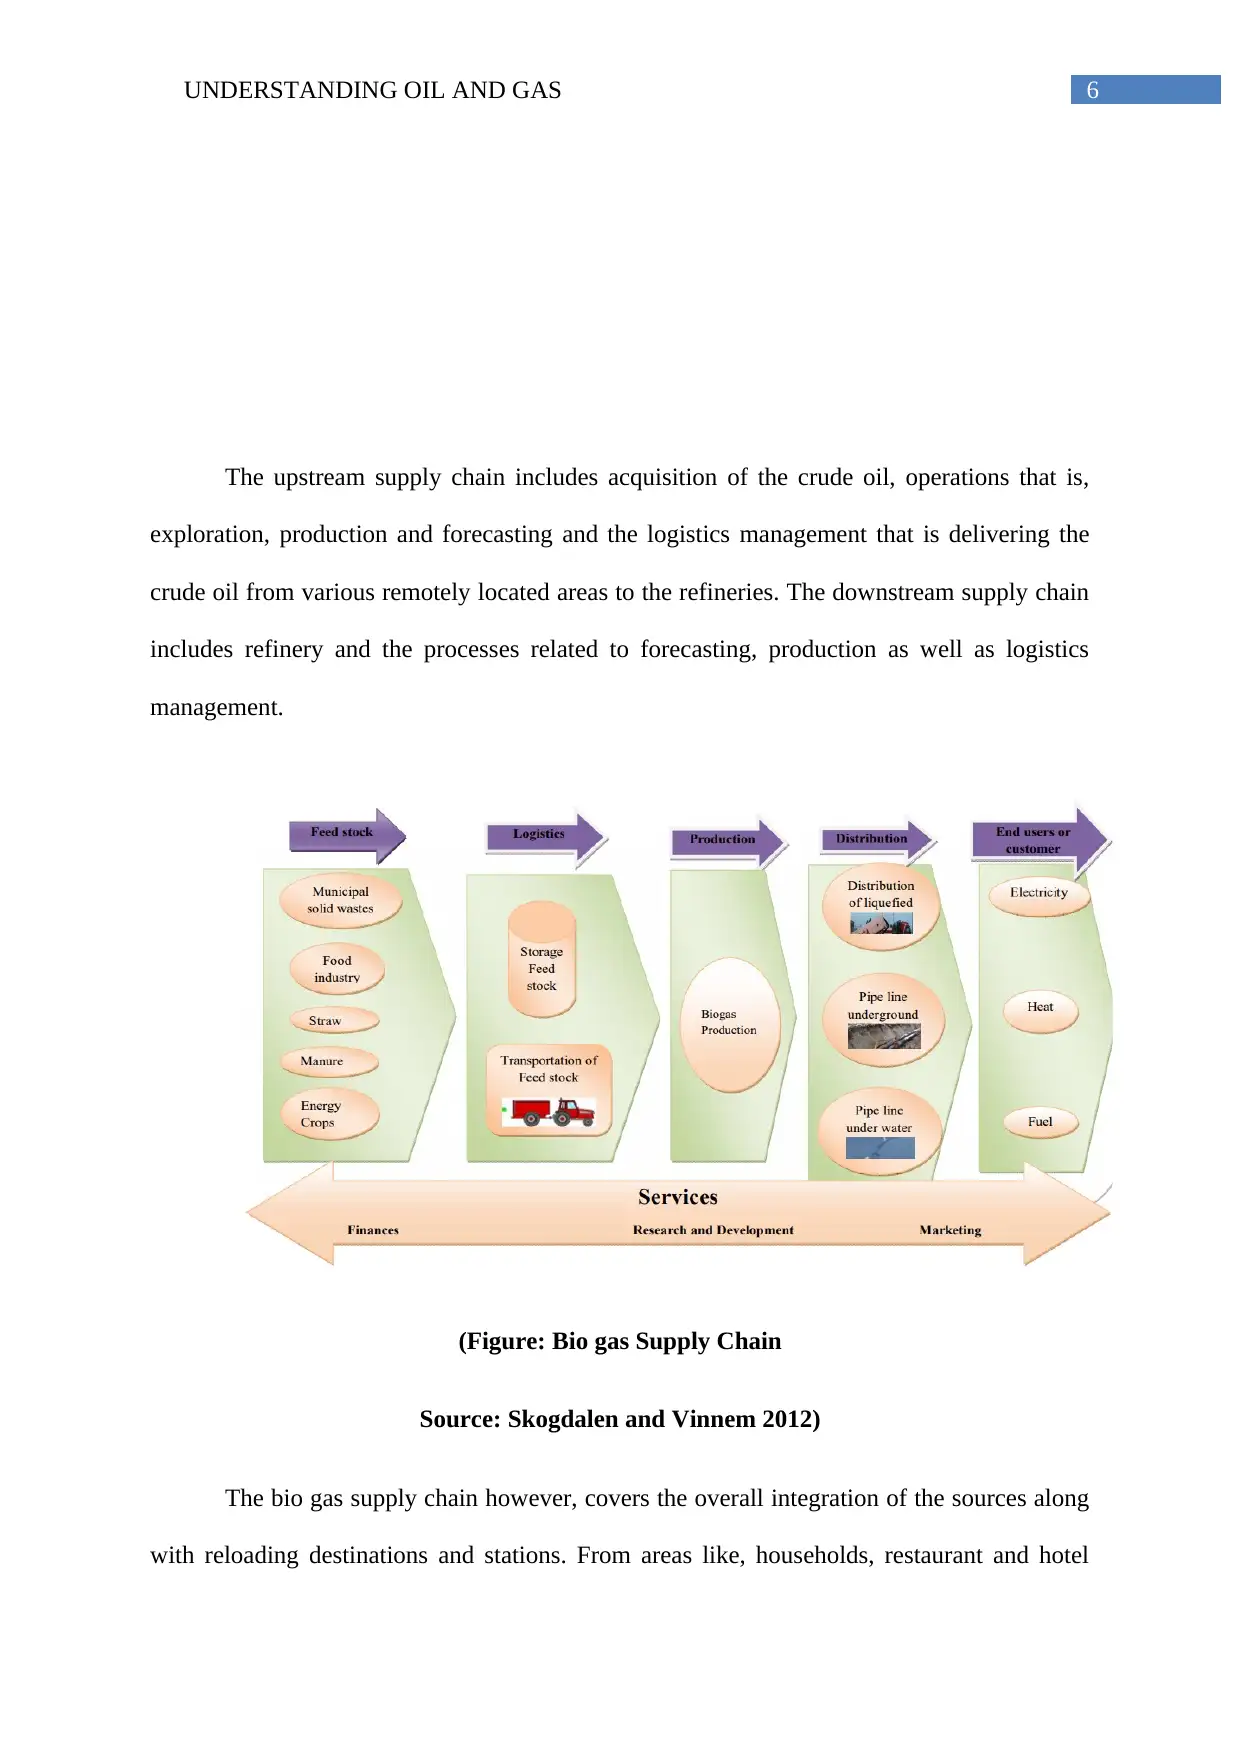
The upstream supply chain includes acquisition of the crude oil, operations that is,
exploration, production and forecasting and the logistics management that is delivering the
crude oil from various remotely located areas to the refineries. The downstream supply chain
includes refinery and the processes related to forecasting, production as well as logistics
management.
(Figure: Bio gas Supply Chain
Source: Skogdalen and Vinnem 2012)
The bio gas supply chain however, covers the overall integration of the sources along
with reloading destinations and stations. From areas like, households, restaurant and hotel
ExpatioProdtionRefingMaringConmer
Paraphrase This Document
Need a fresh take? Get an instant paraphrase of this document with our AI Paraphraser
7UNDERSTANDING OIL AND GAS
industries, food industries, slaughterhouses and meat industries, huge quantity of the bio-
genous raw material results (Kelland 2014). Therefore, depending on the overall condition of
the distance and bio mass, the production centers direct their transportation reloading stations.
Demand and seasonality of the products
In the year 2007, the gasoline demand reached a higher level in the United States of
around 9.286 million barrels per day. However, it declined during the period of Great
Recession. Later on, it expanded again and the consumption increased around 90,000 bpd to
8.774 million bpd. It has been the largest year over year growth since the 2006. The retail
prices of the gasoline are however, affected by the crude oil prices and the overall gasoline
level supply has become relative to the demand. Historically, the retail prices of gasoline tend
to rise during the spring or peak summer. The prices are generally low during the winter
season (Papavinasam 2013). The environmental regulations generally require that the
gasoline sold during the summer be less prone to evaporation during the warmer weather.
The environmentally friendly product, biogas is a renewable source of energy that is
being generated from the anaerobic digestion of the trio mass wastes like animal dung, food
wastes, residues of plant, solid wastes and more. The gas comprises of around fifty percent of
methane and fifty percent of carbon dioxide. However, with the natural gas becoming
cheaper these days, the demand for bio gas is also increasing and it can be a challenging
option. The increasing demand among the farmers, industrial processors, municipalities have
led to widening of the opportunities of renewable gases for treatment technologies (Olaguer
2012).
Conclusion
To conclude, the oil and gas industry is still regarded as one of the extraordinarily
successful industries, which still experiences massive growth in their segment. The large

8UNDERSTANDING OIL AND GAS
volume of the products of oil and gas industry is gasoline, fuel oil, bio gas and more. The
petroleum is considered to be the primary material for the magnitude of certain chemical
products like pharmaceuticals, plastics, solvents, fertilizers and more. It is integral to various
industries and is considered to be of critical importance for various nations as the core
foundation of the several industries. The industry is considered to be one of the major
industries which contribute a huge chunk to the country’s overall economy.
⊘ This is a preview!⊘
Do you want full access?
Subscribe today to unlock all pages.
Trusted by 1+ million students worldwide
9UNDERSTANDING OIL AND GAS
References
Bergh, L.I.V., Hinna, S., Leka, S. and Jain, A., 2014. Developing a performance indicator for
psychosocial risk in the oil and gas industry. Safety science, 62, pp.98-106.
Kelland, M.A., 2014. Production chemicals for the oil and gas industry. CRC press.
Kumar, P. and Rabinovitch, R., 2013. CEO entrenchment and corporate hedging: Evidence
from the oil and gas industry. Journal of financial and quantitative analysis, 48(3), pp.887-
917.
Logan, O. and McNeish, J.A., 2012. Flammable societies: Studies on the socio-economics of
oil and gas. Pluto Press.
Mohanty, S.K., Akhigbe, A., Al-Khyal, T.A. and Bugshan, T., 2013. Oil and stock market
activity when prices go up and down: the case of the oil and gas industry. Review of
Quantitative Finance and Accounting, 41(2), pp.253-272.
Olaguer, E.P., 2012. The potential near-source ozone impacts of upstream oil and gas
industry emissions. Journal of the Air & Waste Management Association, 62(8), pp.966-977.
Paik, K.W., 2012. Sino-Russian Oil and Gas Cooperation: the reality and implications. OUP
Catalogue.
Papavinasam, S., 2013. Corrosion control in the oil and gas industry. Elsevier.
Skogdalen, J.E. and Vinnem, J.E., 2012. Combining precursor incidents investigations and
QRA in oil and gas industry. Reliability Engineering & System Safety, 101, pp.48-58.
Warneke, C., Geiger, F., Edwards, P.M., Dube, W., Pétron, G., Kofler, J., Zahn, A., Brown,
S.S., Graus, M., Gilman, J.B. and Lerner, B.M., 2014. Volatile organic compound emissions
Paraphrase This Document
Need a fresh take? Get an instant paraphrase of this document with our AI Paraphraser
10UNDERSTANDING OIL AND GAS
from the oil and natural gas industry in the Uintah Basin, Utah: oil and gas well pad
emissions compared to ambient air composition. Atmos. Chem. Phys, 14(20), pp.10-977.
Yusuf, Y.Y., Gunasekaran, A., Musa, A., Dauda, M., El-Berishy, N.M. and Cang, S., 2014. A
relational study of supply chain agility, competitiveness and business performance in the oil
and gas industry. International Journal of Production Economics, 147, pp.531-543.
Zarinabadi, S. and Samimi, A., 2012. Problems of hydrate formation in oil and gas pipes
deals. Journal of American Science, 8(8).
1 out of 11
Related Documents


Your All-in-One AI-Powered Toolkit for Academic Success.
+13062052269
info@desklib.com
Available 24*7 on WhatsApp / Email
![[object Object]](/_next/static/media/star-bottom.7253800d.svg)
Unlock your academic potential
Copyright © 2020–2026 A2Z Services. All Rights Reserved. Developed and managed by ZUCOL.