Comprehensive Analysis of GDP, Unemployment, and Inflation: Assignment
VerifiedAdded on 2020/04/07
|5
|1574
|242
Homework Assignment
AI Summary
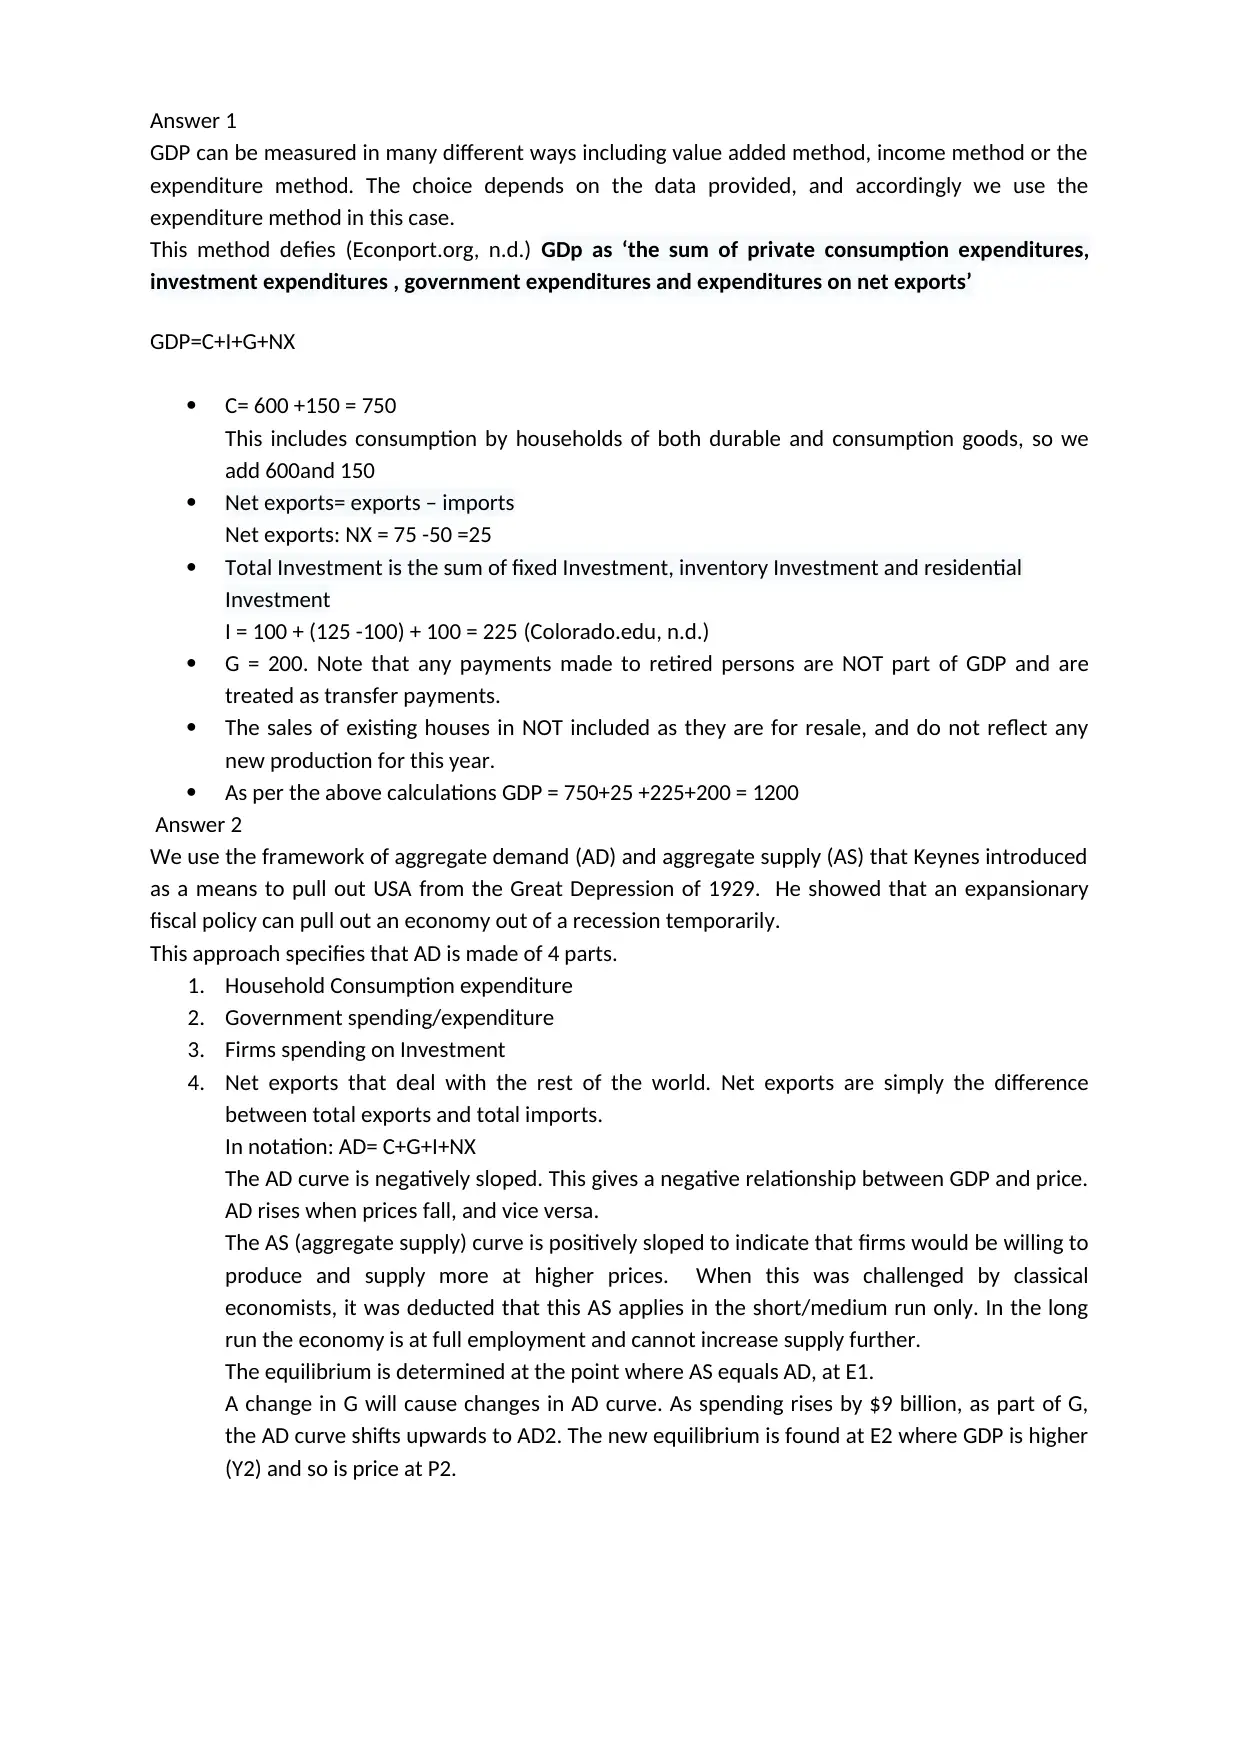
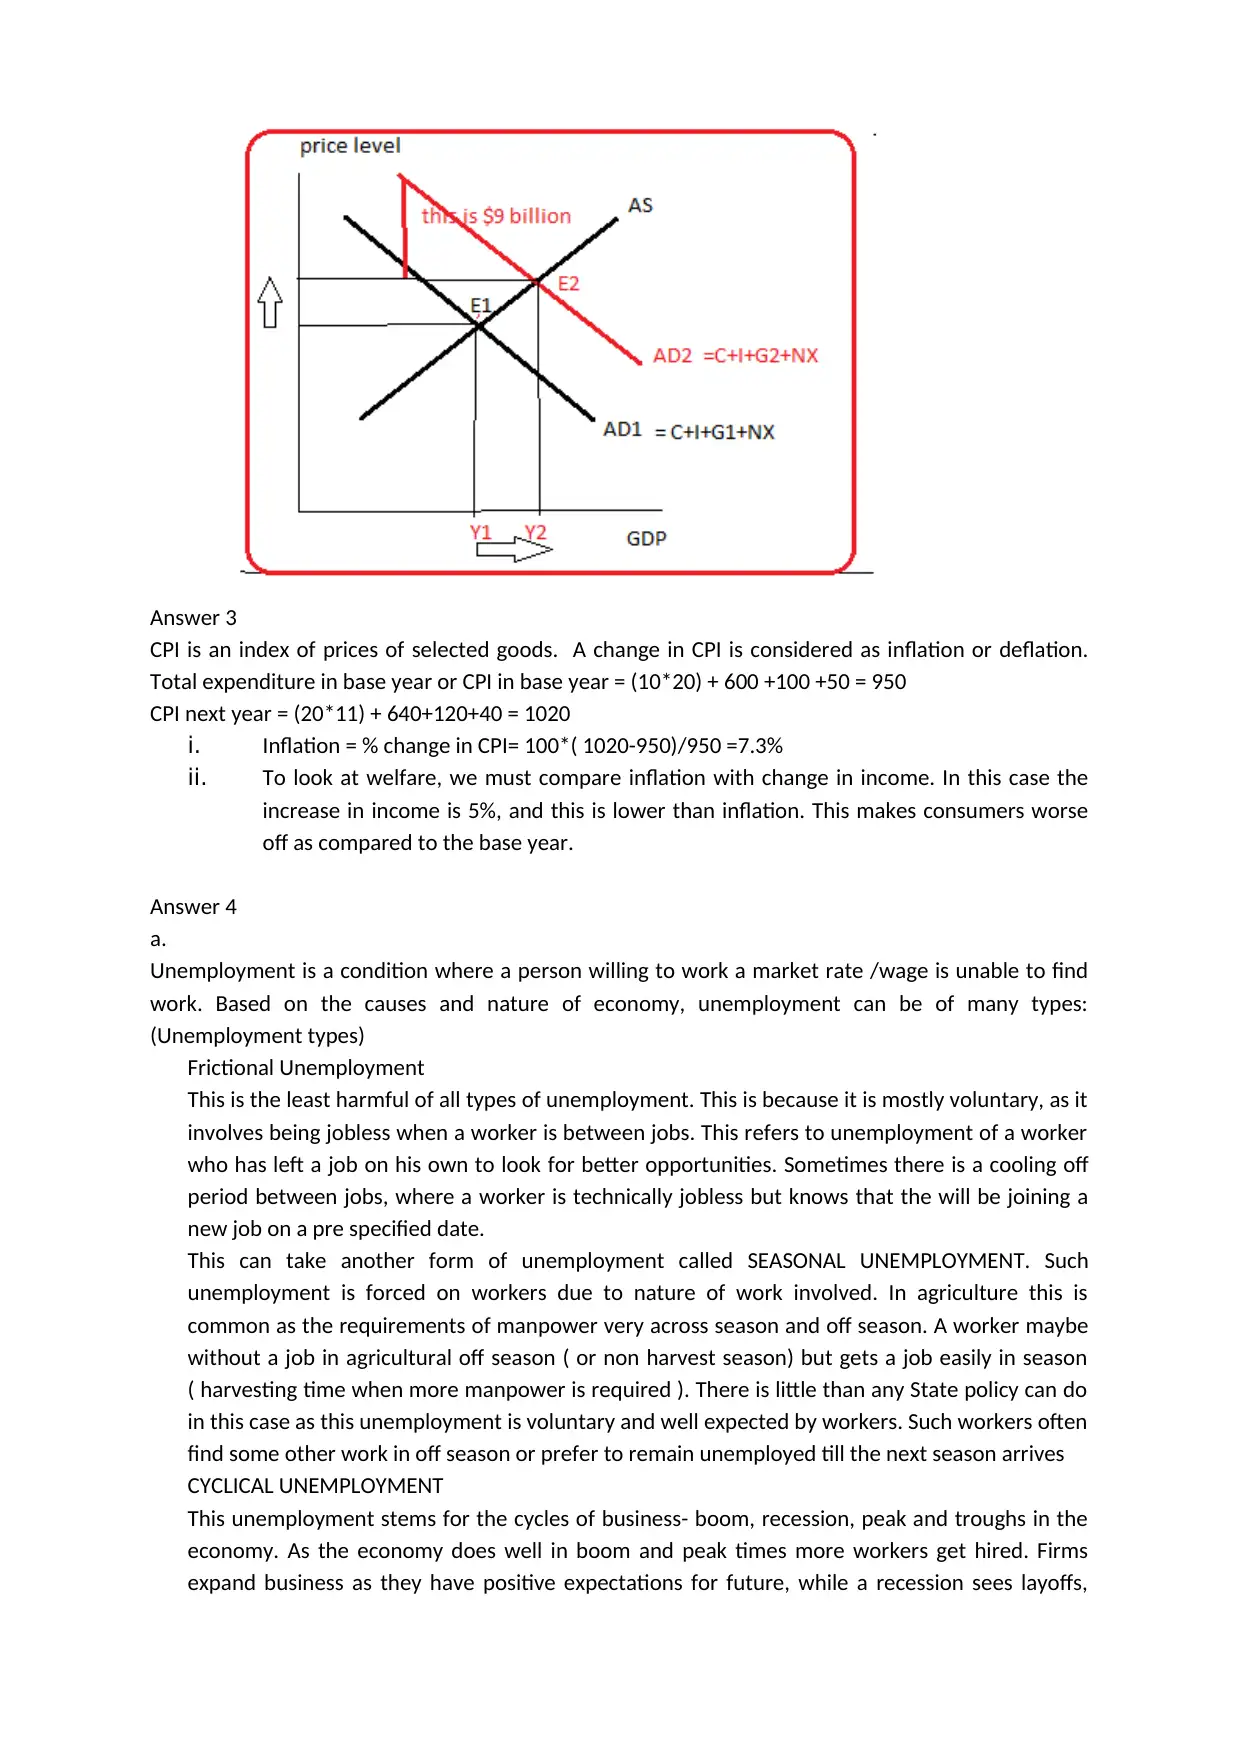
This economics assignment provides a detailed analysis of key macroeconomic concepts. It begins with the calculation of Gross Domestic Product (GDP) using the expenditure method, followed by an explanation of the aggregate demand (AD) and aggregate supply (AS) model, including the impact of fiscal policy changes. The assignment also includes a calculation of the Consumer Price Index (CPI) and inflation rate, alongside an assessment of consumer welfare. Furthermore, it delves into the different types of unemployment, such as frictional, cyclical, and structural, and concludes with a discussion on business cycles and their fluctuations. The assignment uses relevant economic models and data to illustrate these concepts.

STUDENT NAME
WORD COUNT: 1141
WORD COUNT: 1141
Paraphrase This Document
Need a fresh take? Get an instant paraphrase of this document with our AI Paraphraser

Answer 1
GDP can be measured in many different ways including value added method, income method or the
expenditure method. The choice depends on the data provided, and accordingly we use the
expenditure method in this case.
This method defies (Econport.org, n.d.) GDp as ‘the sum of private consumption expenditures,
investment expenditures , government expenditures and expenditures on net exports’
GDP=C+I+G+NX
C= 600 +150 = 750
This includes consumption by households of both durable and consumption goods, so we
add 600and 150
Net exports= exports – imports
Net exports: NX = 75 -50 =25
Total Investment is the sum of fixed Investment, inventory Investment and residential
Investment
I = 100 + (125 -100) + 100 = 225 (Colorado.edu, n.d.)
G = 200. Note that any payments made to retired persons are NOT part of GDP and are
treated as transfer payments.
The sales of existing houses in NOT included as they are for resale, and do not reflect any
new production for this year.
As per the above calculations GDP = 750+25 +225+200 = 1200
Answer 2
We use the framework of aggregate demand (AD) and aggregate supply (AS) that Keynes introduced
as a means to pull out USA from the Great Depression of 1929. He showed that an expansionary
fiscal policy can pull out an economy out of a recession temporarily.
This approach specifies that AD is made of 4 parts.
1. Household Consumption expenditure
2. Government spending/expenditure
3. Firms spending on Investment
4. Net exports that deal with the rest of the world. Net exports are simply the difference
between total exports and total imports.
In notation: AD= C+G+I+NX
The AD curve is negatively sloped. This gives a negative relationship between GDP and price.
AD rises when prices fall, and vice versa.
The AS (aggregate supply) curve is positively sloped to indicate that firms would be willing to
produce and supply more at higher prices. When this was challenged by classical
economists, it was deducted that this AS applies in the short/medium run only. In the long
run the economy is at full employment and cannot increase supply further.
The equilibrium is determined at the point where AS equals AD, at E1.
A change in G will cause changes in AD curve. As spending rises by $9 billion, as part of G,
the AD curve shifts upwards to AD2. The new equilibrium is found at E2 where GDP is higher
(Y2) and so is price at P2.

Answer 3
CPI is an index of prices of selected goods. A change in CPI is considered as inflation or deflation.
Total expenditure in base year or CPI in base year = (10*20) + 600 +100 +50 = 950
CPI next year = (20*11) + 640+120+40 = 1020
i. Inflation = % change in CPI= 100*( 1020-950)/950 =7.3%
ii. To look at welfare, we must compare inflation with change in income. In this case the
increase in income is 5%, and this is lower than inflation. This makes consumers worse
off as compared to the base year.
Answer 4
a.
Unemployment is a condition where a person willing to work a market rate /wage is unable to find
work. Based on the causes and nature of economy, unemployment can be of many types:
(Unemployment types)
Frictional Unemployment
This is the least harmful of all types of unemployment. This is because it is mostly voluntary, as it
involves being jobless when a worker is between jobs. This refers to unemployment of a worker
who has left a job on his own to look for better opportunities. Sometimes there is a cooling off
period between jobs, where a worker is technically jobless but knows that the will be joining a
new job on a pre specified date.
This can take another form of unemployment called SEASONAL UNEMPLOYMENT. Such
unemployment is forced on workers due to nature of work involved. In agriculture this is
common as the requirements of manpower very across season and off season. A worker maybe
without a job in agricultural off season ( or non harvest season) but gets a job easily in season
( harvesting time when more manpower is required ). There is little than any State policy can do
in this case as this unemployment is voluntary and well expected by workers. Such workers often
find some other work in off season or prefer to remain unemployed till the next season arrives
CYCLICAL UNEMPLOYMENT
This unemployment stems for the cycles of business- boom, recession, peak and troughs in the
economy. As the economy does well in boom and peak times more workers get hired. Firms
expand business as they have positive expectations for future, while a recession sees layoffs,
⊘ This is a preview!⊘
Do you want full access?
Subscribe today to unlock all pages.

Trusted by 1+ million students worldwide

increasing unemployment. This unemployment is also very common and easy to measure,
which makes it a good indicator of economic conditions. It is used as an economic indicator as it
is measured on a regular basis, making it the most visible form of unemployment.
STRUCTURAL UNEMPLOYMENT
As per OECD, ‘structural unemployment is the rate of unemployment consistent with constant
wage inflation (non-accelerating wage rate of unemployment)’. In simple words it means the
unemployment which occurs without any rise in wage rates. It is easier to understand it as
unemployment that is caused by changes in the structure of the economy. For example, a shift
to service sector will make some workers in agriculture redundant as they are not trained to be
in service sector. Till these workers attain the skill sets for service they remain unemployed as
agriculture can no longer absorb them( due to decline in agriculture sector). Such
unemployment is structural unemployment. (Structural unmeployment, 2014)
It takes a lot of time and long term efforts to reduce this type of unemployment. This is because
we need training and building of human capital to absorb such workers after they are rendered
jobless.
b.
The world ‘cycle’ suggests some form of regular motion like the movement of the tires of a cycle.
In the same way a business ‘cycles’ refers to some pattern that business/economy follows. This
pattern takes the form of a boom, peak, recession, slump (or trough) and a recovery in the end.
After the recovery the economy starts to rise again and falls into a boom period. But in real life
there is no regularity about these phases of a cycle. There is no finality to the duration of a any
phase or how to measure the exact start and end dates of any phase.
Due to real life economic data being different from the theory of the business cycle outlined
above, this word is termed misnomer. It was replaced by Milton Friedman, who replaced it with
cyclical fluctuations, as the changes in economic variables like GDP and employment fluctuate
around historical values rather than following a regular pattern.
(Learn.saylor.org, n.d.)
Paraphrase This Document
Need a fresh take? Get an instant paraphrase of this document with our AI Paraphraser

AD-AS approach. (n.d.). Retrieved Sep 11, 2017, from people.uleth.ca:
http://people.uleth.ca/~richard.mueller/MacroChap09.pdf
Aggregate Expenditures Model. (n.d.). Retrieved Sep 11, 2017, from Courses.byui.edu:
https://courses.byui.edu/econ_151/presentations/lesson_07.htm
Angeltos, G. M., & Lian, C. (2016). A theory of Aggregate demand channel. Retrieved Sep 9, 2017,
from Economics.mit.edu: https://economics.mit.edu/files/12527
Bus 101: Introduction to Business. (n.d.). Retrieved Sep 21, 2017, from Learn.saylor.org:
https://learn.saylor.org/mod/page/view.php?id=8871
Dighe, R. (2000). Principles of Macroeconomics. Retrieved Sep 11, 2017, from Oswego.edu:
http://www.oswego.edu/~dighe/lstums12.htm
Kaplan, J. (19999). Components of GDP. Retrieved Sep 22, 2017, from Colorado.edu:
http://www.colorado.edu/economics/courses/econ2020/section6/GDP-components.html
Structural unmeployment. (2014, March 28). Retrieved Sep 22, 2017, from Stats.oecd.org:
https://stats.oecd.org/glossary/detail.asp?ID=2580
THe AS-AD model. (n.d.). Retrieved Sep 10, 2017, from pages.hmc.edu:
http://pages.hmc.edu/evans/chap2.pdf
the keynesian multiplier. (n.d.). Retrieved Sep 8, 2017, from Textbook. stpauls.br:
http://textbook.stpauls.br/Macroeconomics/page_60.htm
Tucker, I. (2008). Survey of Economics. Cengage books.
Unemplpoyment types. (n.d.). Retrieved Sep 21, 2017, from Economicsonline.co.uk:
http://www.economicsonline.co.uk/Managing_the_economy/Unemployment_types_and_c
auses.html
W, C. (2014, Aug 18). 3 types of unemployment. Retrieved Sep 20, 2017, from Economist.com:
https://www.economist.com/blogs/economist-explains/2014/08/economist-explains-8
1 out of 5
Related Documents

Your All-in-One AI-Powered Toolkit for Academic Success.
+13062052269
info@desklib.com
Available 24*7 on WhatsApp / Email
Unlock your academic potential
Copyright © 2020–2025 A2Z Services. All Rights Reserved. Developed and managed by ZUCOL.