Comprehensive Analysis of Unemployment in Australia: 2012-2017
VerifiedAdded on 2020/03/16
|18
|3865
|41
Report
AI Summary
This report provides a comprehensive analysis of unemployment in Australia from 2012 to 2017. It begins with an introduction to unemployment as a key economic indicator, followed by an overview of Australia's economic performance during the period. The report then examines the unemployment rates, broken down by year, from 2012 to 2017, including the impact on male and female labor forces. It explores the trends, fluctuations, and contributing factors to unemployment. The report also discusses the policies undertaken by the Australian government to combat unemployment and their effectiveness. The conclusion summarizes the key findings and implications of the unemployment trends observed over the five-year period, highlighting the challenges and future prospects for the Australian labor market. The report uses data from the Australian Bureau of Statistics to support its findings and includes figures illustrating unemployment rates and trends.
Running head: UNEMPLOYMENT IN AUSTRALIA 2012-2017
UNEMPLOYMENT IN AUSTRALIA 2012-2017
Name of Student:
Name of University:
Author Note:
UNEMPLOYMENT IN AUSTRALIA 2012-2017
Name of Student:
Name of University:
Author Note:
Paraphrase This Document
Need a fresh take? Get an instant paraphrase of this document with our AI Paraphraser
UNEMPLOYMENT IN AUSTRALIA 2012-2017
TABLE OF CONTENT
Introduction...................................................................................................................... 2
Current Economic Overview of Australia:.........................................................................3
Unemployment as Economic Issue:.................................................................................4
Unemployment in 2012-13........................................................................................... 8
Unemployment in 2013-14........................................................................................... 9
Unemployment in 2014-15......................................................................................... 10
Unemployment in 2015-16......................................................................................... 10
Unemployment in 2016-17......................................................................................... 11
Policies undertaken to combat unemployment...............................................................11
Conclusion..................................................................................................................... 13
Reference
UNEMPLOYMENT IN AUSTRALIA 2012-2017
Introduction
In the modern economy Gross Domestic product of nations are one of the important
economic indicators to get a snapshot about the economic performance and ranking of them
globally. GDP in turn reflects how much employment is contributing behind that What it fails to
capture is the how many people still remaining idle and unproductive in the participation of
national activities and such is identified as unemployment .In simple term unemployment, means
the state of being without any job and be unable to earn livelihood through working (Argy &
Nevile, 2016). The unemployment faced by a nation reflect the underemployed human resources
which if applied could bring forth more growth to the nation It is one of the macroeconomic
factor that indicates and determine as well the overall economic operation (Shimer, 2012). More
unemployment leads to less income of the nation and less consumption that influences the GDP
of the nation. Excessive and increasing unemployment has detrimental impact on the health of
economy and that is why it is considered as one of the economic issues that almost every nation
face though the rate intensity and degree differ remarkably.
Economy of Australia though small but enriched with plenty of potential to grow and
expand. The biggest mixed market, which the country is consist of at least indicates that
strongly. Even though the nation ranks 14th as per nominal GDP, Ii is diagnosed too with the
common ailment of unemployment that is recorded to be at the rate of 5.6% of total labor force
recently in recent year(2017).
⊘ This is a preview!⊘
Do you want full access?
Subscribe today to unlock all pages.
Trusted by 1+ million students worldwide
UNEMPLOYMENT IN AUSTRALIA 2012-2017
The paper aims to report the unemployment issues faced by Australia over the last five
year period that is 2012-2017. It sheds light on the facts and challenges posed by unemployment
with further discussion of national policies and attempt to deal with the chronic problem.
Current Economic Overview of Australia:
Australia is 14th largest global economy as per the nominal GDP estimation and ranks
20th in terms of Purchasing Power Parity. As per the estimated data of International Monetary
Fund, the nominal GDP of the nation is recorded to be $1.258 trillion in 2016. The national GDP
grows at 1.8% annually. The country reflects pretty higher per capita income, which is recorded
to be $51,850. The nation is top in world economies as per the wealth per adult and the annual
growth rate of wealth is 4.4% due to constancy of exchange rate. The Human Development
Index of the country is second highest in world.
Looking at the sectors wise performance of GDP, the service sector seems to dominate the total
production of the country accounting for almost 61% of the GDP. The major components of
service sectors are education, tourism, consultancies and financial services They consist the
maximum of the export basket mostly forwarding the good into China, Japan, South Korea, US
and India. The country has been revolving around 5-6% recently after facing rise in post
financial crisis reaching a peak of 6.25%. Construction is the next bigger component
contributing to 8% of GDP. Mining is also crucial in the economy as it accounts for almost 7%
of GDP. 6% of the total national production comes from the manufacturing sector. Only 2% of
Paraphrase This Document
Need a fresh take? Get an instant paraphrase of this document with our AI Paraphraser
UNEMPLOYMENT IN AUSTRALIA 2012-2017
the total production is achieved through operations and productions in agricultural sector. .
Natural resource along with agricultural production holds 2-5% of the total GDP.
The country captures inflation rate recorded at 1.9%. Australia is one of the larger
exporting countries to the world facing higher export demands from China, Japan, South Korea,
European Union and United States of America. This makes the country produce more of
exportable good and services as compared to manufacturing production. As a result, the country
has been blessed with increasing terms of trade over time since 2000. The existing labor force of
the nation is 12.6 million, of which 79.2% is employed in service sector, 8.8% in construction
sector, 2.7% in agriculture sector, 7.4% contributing in the manufacturing sector and 1.9%
employed in mining sector. Keeping parity with the employment the wages in the country has
not raised rather has been falling over time. As per the estimation in 2017, the recent
unemployment rate is recorded at 5.6%. The general price level in the national economy is
moderate as it has been managing the inflation rate to prevail within 2-3% of the GDP.
Unemployment as Economic Issue:
Over the years there has been larger structural changes in Australia in terms of its quantum and
process of production. The changes owe its credit to the technological advancements, compact
integration with the huge world market and the competition stemming from manufacturing
production and growing services produced by low wage developing countries. Changes in the
tastes and preferences of consumers due to rise in real income is also one of the driving factor
behind Australian changes in outlook (Pissarides, 2013). The adoption of technology and
UNEMPLOYMENT IN AUSTRALIA 2012-2017
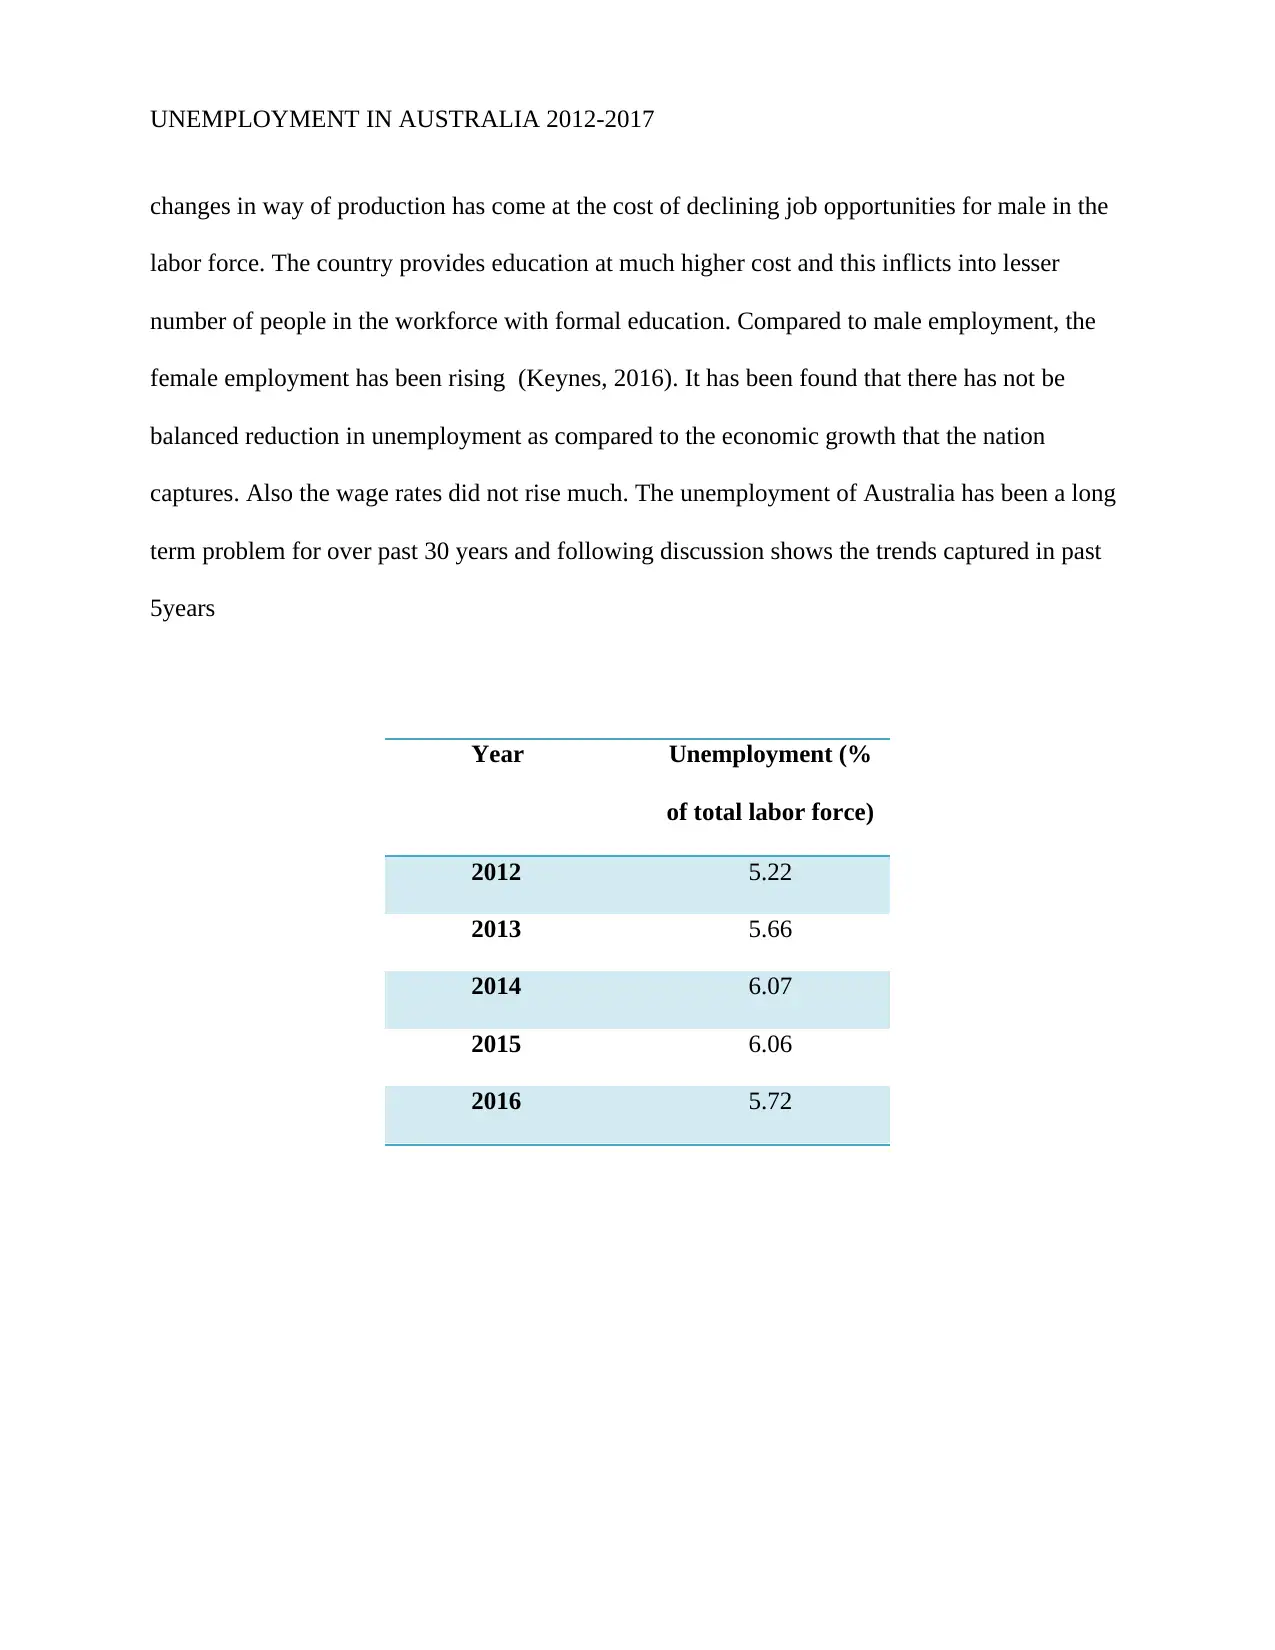
changes in way of production has come at the cost of declining job opportunities for male in the
labor force. The country provides education at much higher cost and this inflicts into lesser
number of people in the workforce with formal education. Compared to male employment, the
female employment has been rising (Keynes, 2016). It has been found that there has not be
balanced reduction in unemployment as compared to the economic growth that the nation
captures. Also the wage rates did not rise much. The unemployment of Australia has been a long
term problem for over past 30 years and following discussion shows the trends captured in past
5years
Year Unemployment (%
of total labor force)
2012 5.22
2013 5.66
2014 6.07
2015 6.06
2016 5.72
⊘ This is a preview!⊘
Do you want full access?
Subscribe today to unlock all pages.
Trusted by 1+ million students worldwide
UNEMPLOYMENT IN AUSTRALIA 2012-2017
2012 2013 2014 2015 2016
4.6
4.8
5
5.2
5.4
5.6
5.8
6
6.2
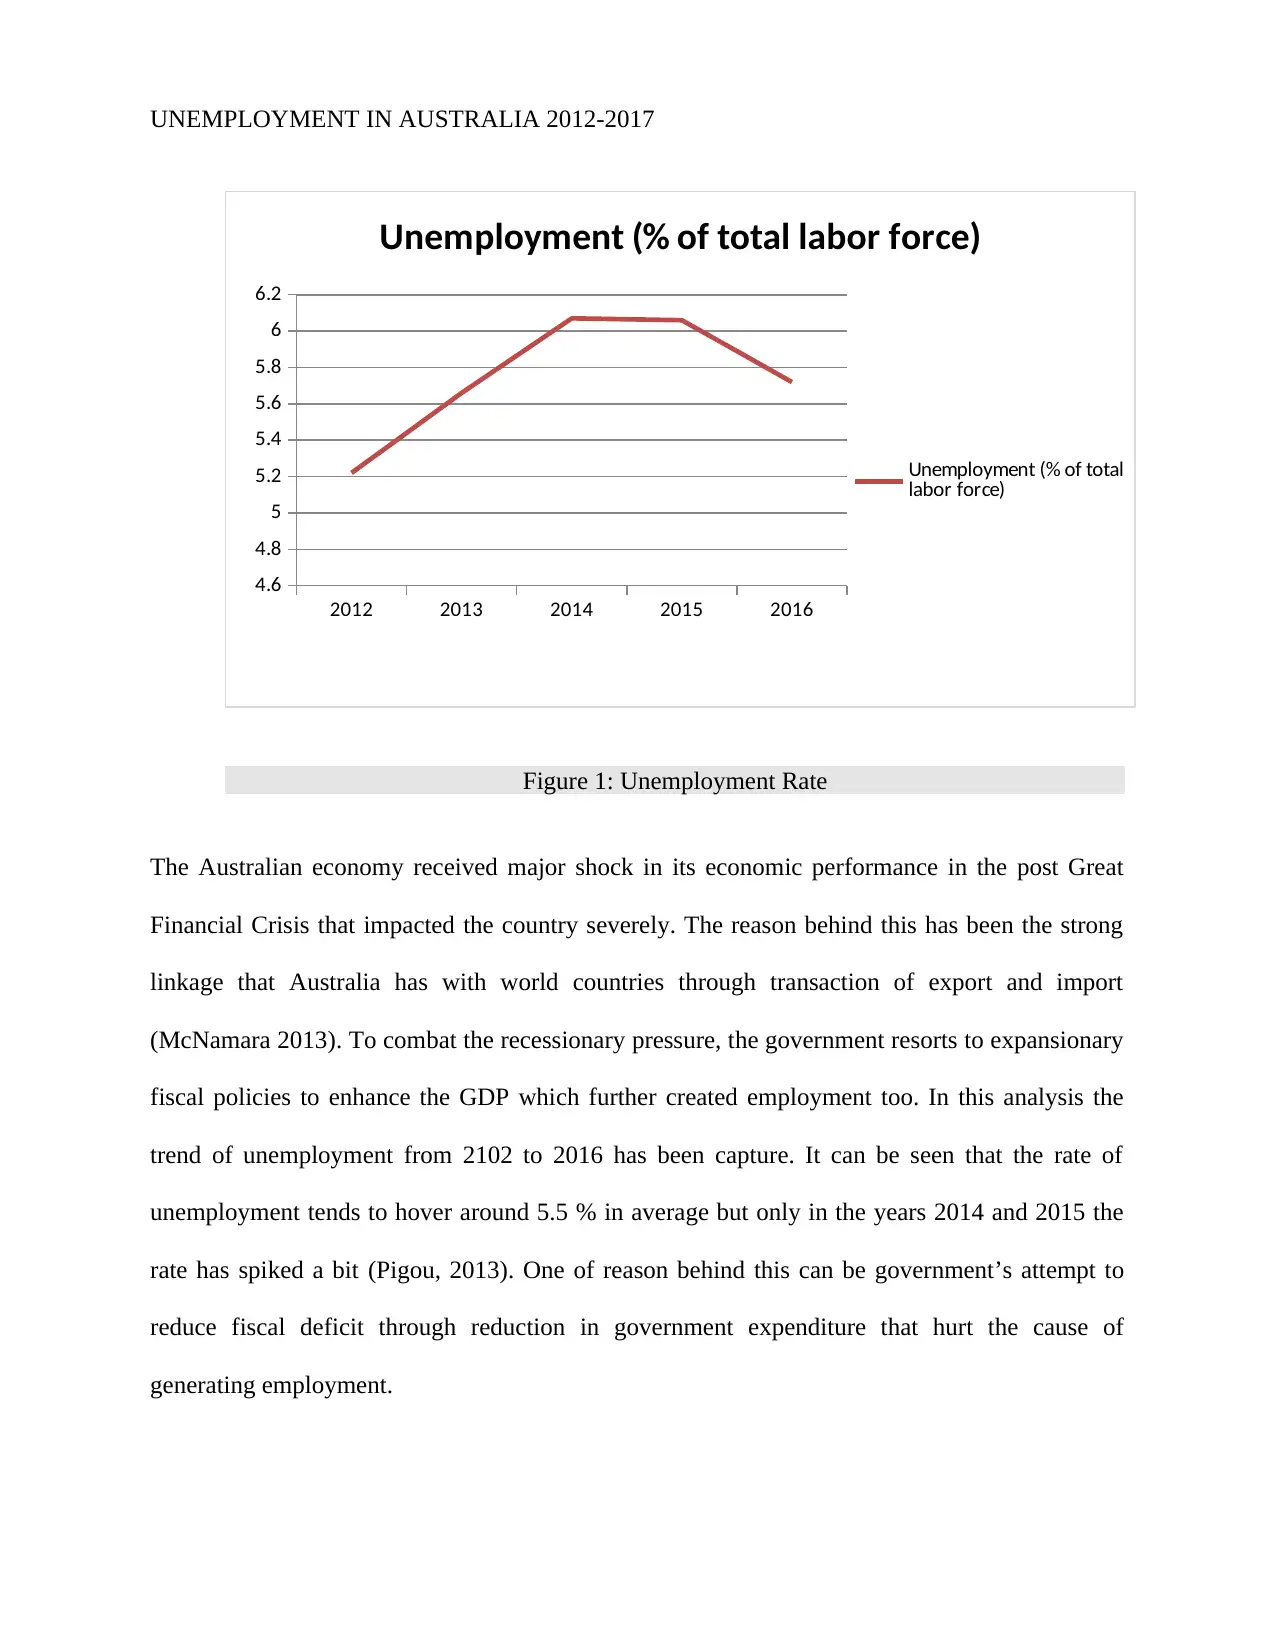
Unemployment (% of total labor force)
Unemployment (% of total
labor force)
Figure 1: Unemployment Rate
The Australian economy received major shock in its economic performance in the post Great
Financial Crisis that impacted the country severely. The reason behind this has been the strong
linkage that Australia has with world countries through transaction of export and import
(McNamara 2013). To combat the recessionary pressure, the government resorts to expansionary
fiscal policies to enhance the GDP which further created employment too. In this analysis the
trend of unemployment from 2102 to 2016 has been capture. It can be seen that the rate of
unemployment tends to hover around 5.5 % in average but only in the years 2014 and 2015 the
rate has spiked a bit (Pigou, 2013). One of reason behind this can be government’s attempt to
reduce fiscal deficit through reduction in government expenditure that hurt the cause of
generating employment.
2012 2013 2014 2015 2016
4.6
4.8
5
5.2
5.4
5.6
5.8
6
6.2
Unemployment (% of total labor force)
Unemployment (% of total
labor force)
Figure 1: Unemployment Rate
The Australian economy received major shock in its economic performance in the post Great
Financial Crisis that impacted the country severely. The reason behind this has been the strong
linkage that Australia has with world countries through transaction of export and import
(McNamara 2013). To combat the recessionary pressure, the government resorts to expansionary
fiscal policies to enhance the GDP which further created employment too. In this analysis the
trend of unemployment from 2102 to 2016 has been capture. It can be seen that the rate of
unemployment tends to hover around 5.5 % in average but only in the years 2014 and 2015 the
rate has spiked a bit (Pigou, 2013). One of reason behind this can be government’s attempt to
reduce fiscal deficit through reduction in government expenditure that hurt the cause of
generating employment.
Paraphrase This Document
Need a fresh take? Get an instant paraphrase of this document with our AI Paraphraser
UNEMPLOYMENT IN AUSTRALIA 2012-2017
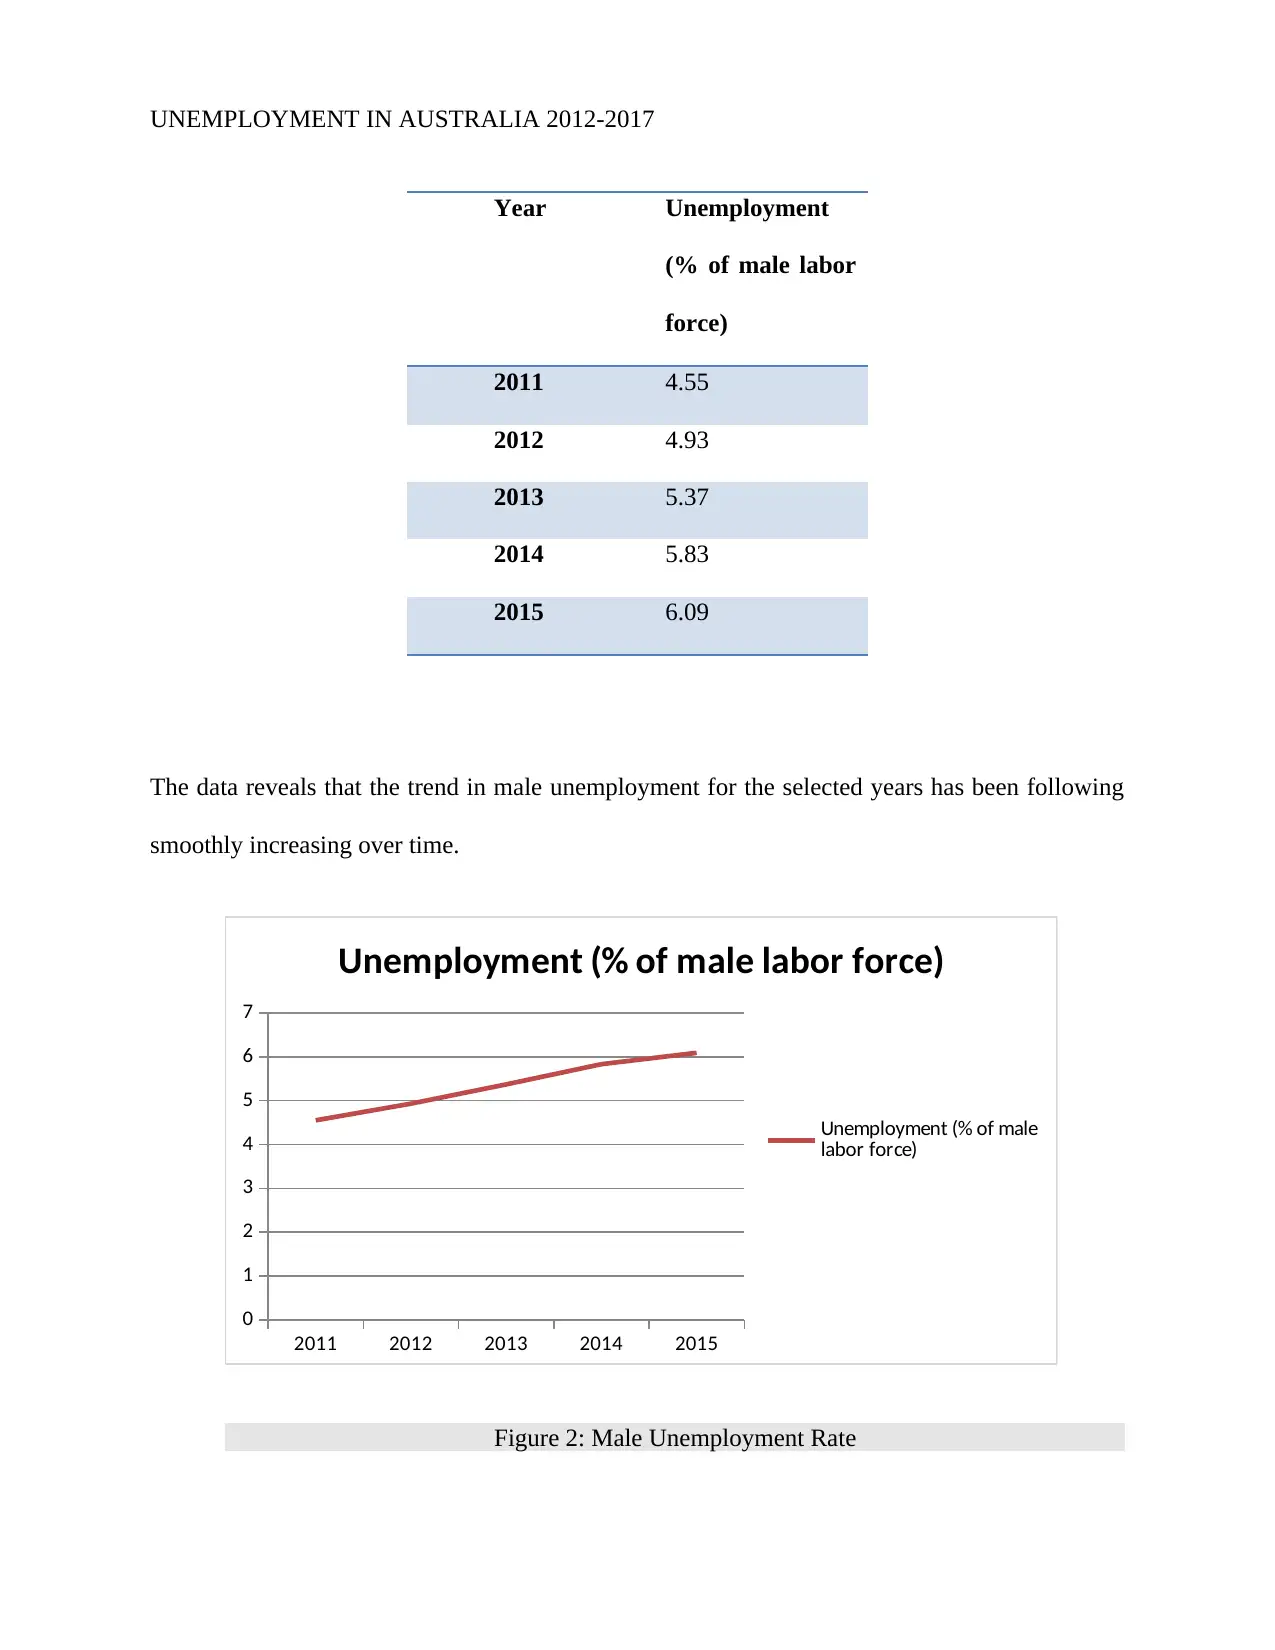
Year Unemployment
(% of male labor
force)
2011 4.55
2012 4.93
2013 5.37
2014 5.83
2015 6.09
The data reveals that the trend in male unemployment for the selected years has been following
smoothly increasing over time.
2011 2012 2013 2014 2015
0
1
2
3
4
5
6
7
Unemployment (% of male labor force)
Unemployment (% of male
labor force)
Figure 2: Male Unemployment Rate
UNEMPLOYMENT IN AUSTRALIA 2012-2017
Year Unemployment
(% of female
labor force)
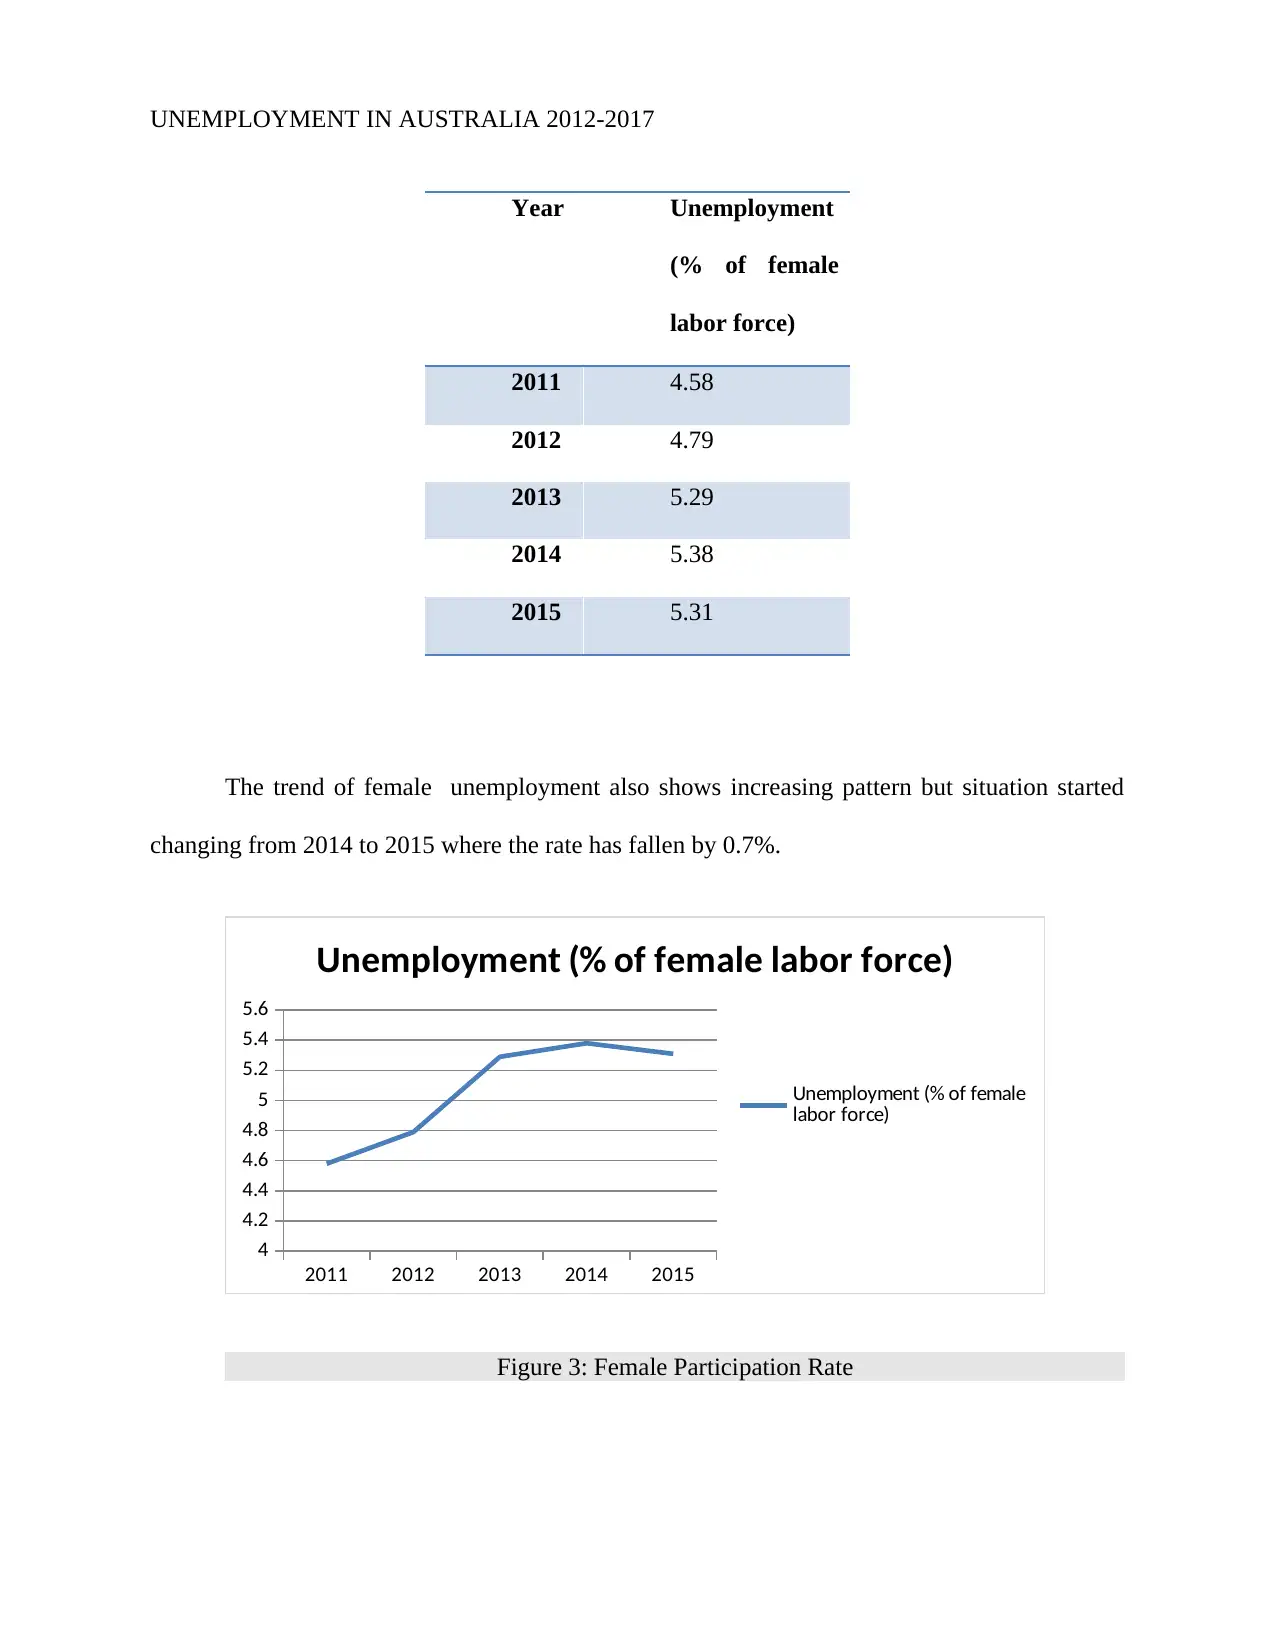
2011 4.58
2012 4.79
2013 5.29
2014 5.38
2015 5.31
The trend of female unemployment also shows increasing pattern but situation started
changing from 2014 to 2015 where the rate has fallen by 0.7%.
2011 2012 2013 2014 2015
4
4.2
4.4
4.6
4.8
5
5.2
5.4
5.6
Unemployment (% of female labor force)
Unemployment (% of female
labor force)
Figure 3: Female Participation Rate
Year Unemployment
(% of female
labor force)
2011 4.58
2012 4.79
2013 5.29
2014 5.38
2015 5.31
The trend of female unemployment also shows increasing pattern but situation started
changing from 2014 to 2015 where the rate has fallen by 0.7%.
2011 2012 2013 2014 2015
4
4.2
4.4
4.6
4.8
5
5.2
5.4
5.6
Unemployment (% of female labor force)
Unemployment (% of female
labor force)
Figure 3: Female Participation Rate
⊘ This is a preview!⊘
Do you want full access?
Subscribe today to unlock all pages.
Trusted by 1+ million students worldwide
UNEMPLOYMENT IN AUSTRALIA 2012-2017
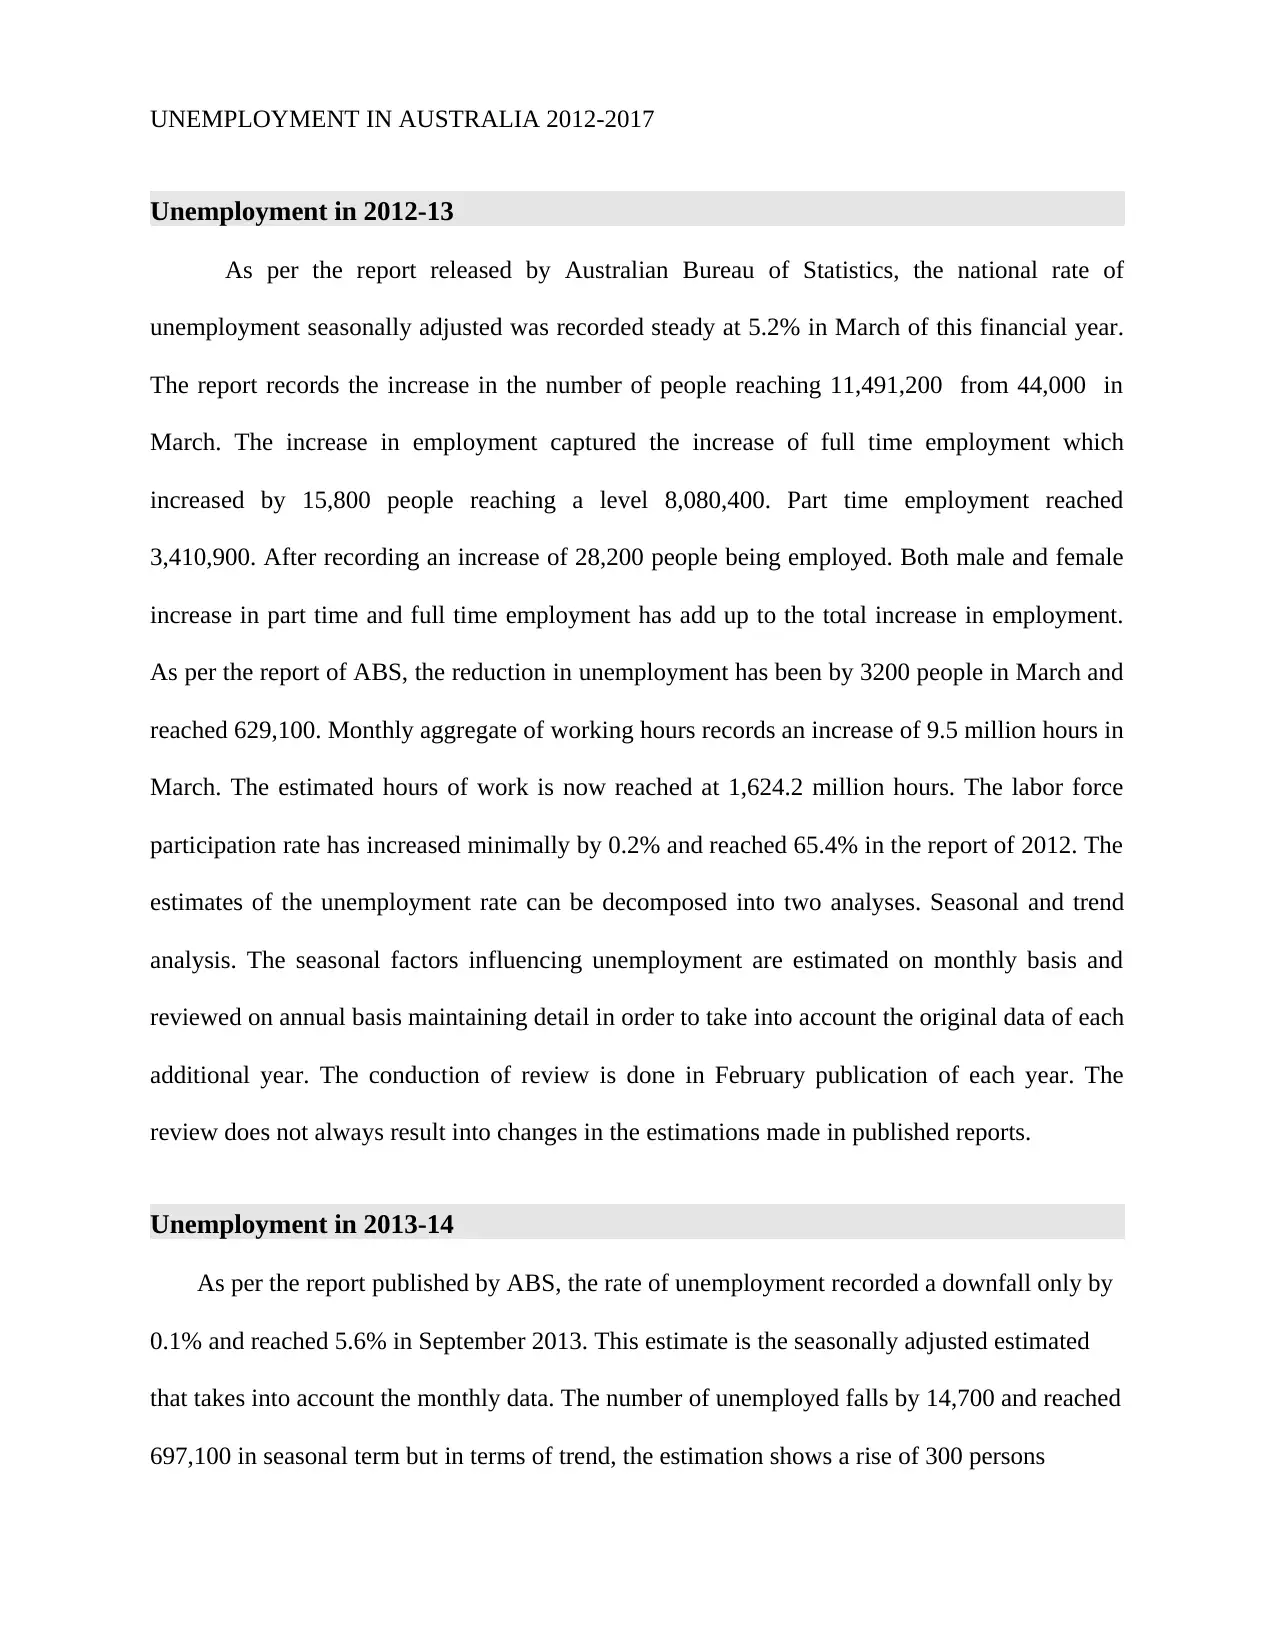
Unemployment in 2012-13
As per the report released by Australian Bureau of Statistics, the national rate of
unemployment seasonally adjusted was recorded steady at 5.2% in March of this financial year.
The report records the increase in the number of people reaching 11,491,200 from 44,000 in
March. The increase in employment captured the increase of full time employment which
increased by 15,800 people reaching a level 8,080,400. Part time employment reached
3,410,900. After recording an increase of 28,200 people being employed. Both male and female
increase in part time and full time employment has add up to the total increase in employment.
As per the report of ABS, the reduction in unemployment has been by 3200 people in March and
reached 629,100. Monthly aggregate of working hours records an increase of 9.5 million hours in
March. The estimated hours of work is now reached at 1,624.2 million hours. The labor force
participation rate has increased minimally by 0.2% and reached 65.4% in the report of 2012. The
estimates of the unemployment rate can be decomposed into two analyses. Seasonal and trend
analysis. The seasonal factors influencing unemployment are estimated on monthly basis and
reviewed on annual basis maintaining detail in order to take into account the original data of each
additional year. The conduction of review is done in February publication of each year. The
review does not always result into changes in the estimations made in published reports.
Unemployment in 2013-14
As per the report published by ABS, the rate of unemployment recorded a downfall only by
0.1% and reached 5.6% in September 2013. This estimate is the seasonally adjusted estimated
that takes into account the monthly data. The number of unemployed falls by 14,700 and reached
697,100 in seasonal term but in terms of trend, the estimation shows a rise of 300 persons
Paraphrase This Document
Need a fresh take? Get an instant paraphrase of this document with our AI Paraphraser
UNEMPLOYMENT IN AUSTRALIA 2012-2017
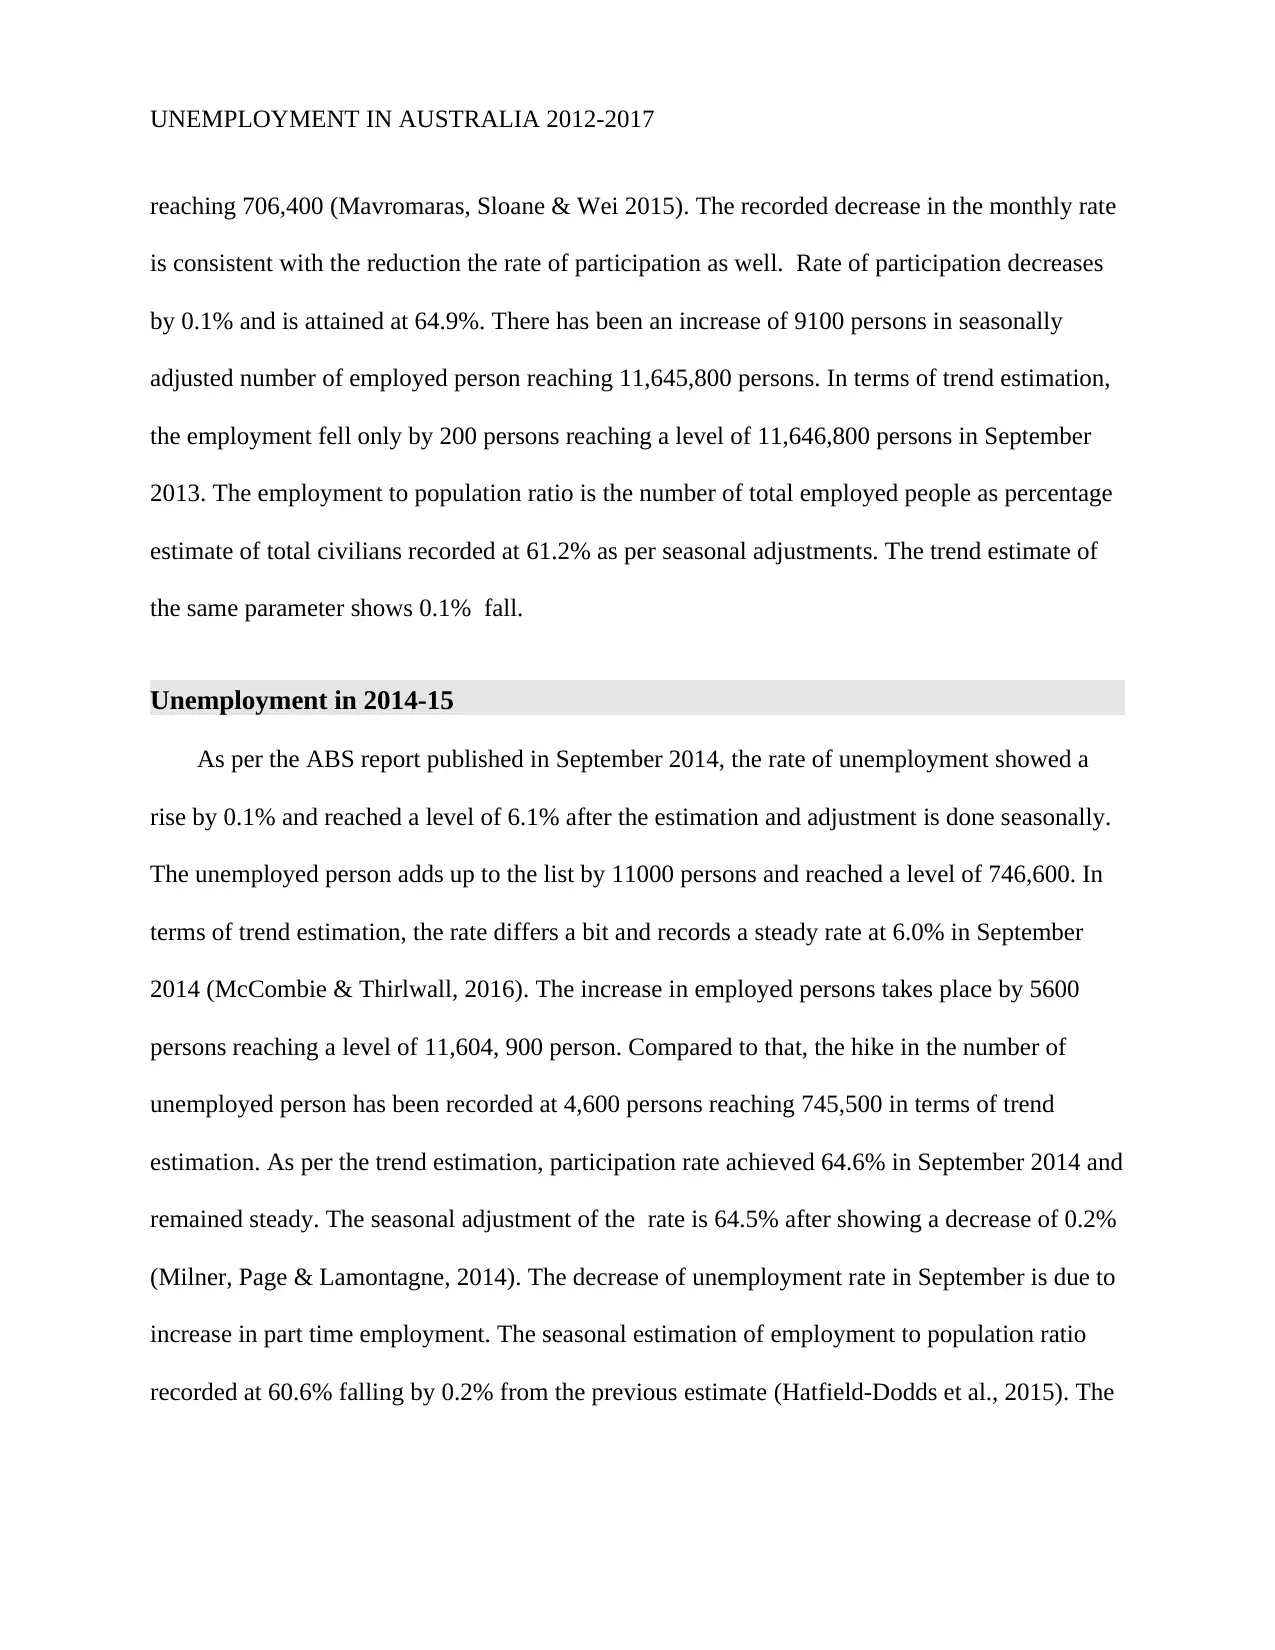
reaching 706,400 (Mavromaras, Sloane & Wei 2015). The recorded decrease in the monthly rate
is consistent with the reduction the rate of participation as well. Rate of participation decreases
by 0.1% and is attained at 64.9%. There has been an increase of 9100 persons in seasonally
adjusted number of employed person reaching 11,645,800 persons. In terms of trend estimation,
the employment fell only by 200 persons reaching a level of 11,646,800 persons in September
2013. The employment to population ratio is the number of total employed people as percentage
estimate of total civilians recorded at 61.2% as per seasonal adjustments. The trend estimate of
the same parameter shows 0.1% fall.
Unemployment in 2014-15
As per the ABS report published in September 2014, the rate of unemployment showed a
rise by 0.1% and reached a level of 6.1% after the estimation and adjustment is done seasonally.
The unemployed person adds up to the list by 11000 persons and reached a level of 746,600. In
terms of trend estimation, the rate differs a bit and records a steady rate at 6.0% in September
2014 (McCombie & Thirlwall, 2016). The increase in employed persons takes place by 5600
persons reaching a level of 11,604, 900 person. Compared to that, the hike in the number of
unemployed person has been recorded at 4,600 persons reaching 745,500 in terms of trend
estimation. As per the trend estimation, participation rate achieved 64.6% in September 2014 and
remained steady. The seasonal adjustment of the rate is 64.5% after showing a decrease of 0.2%
(Milner, Page & Lamontagne, 2014). The decrease of unemployment rate in September is due to
increase in part time employment. The seasonal estimation of employment to population ratio
recorded at 60.6% falling by 0.2% from the previous estimate (Hatfield-Dodds et al., 2015). The
UNEMPLOYMENT IN AUSTRALIA 2012-2017
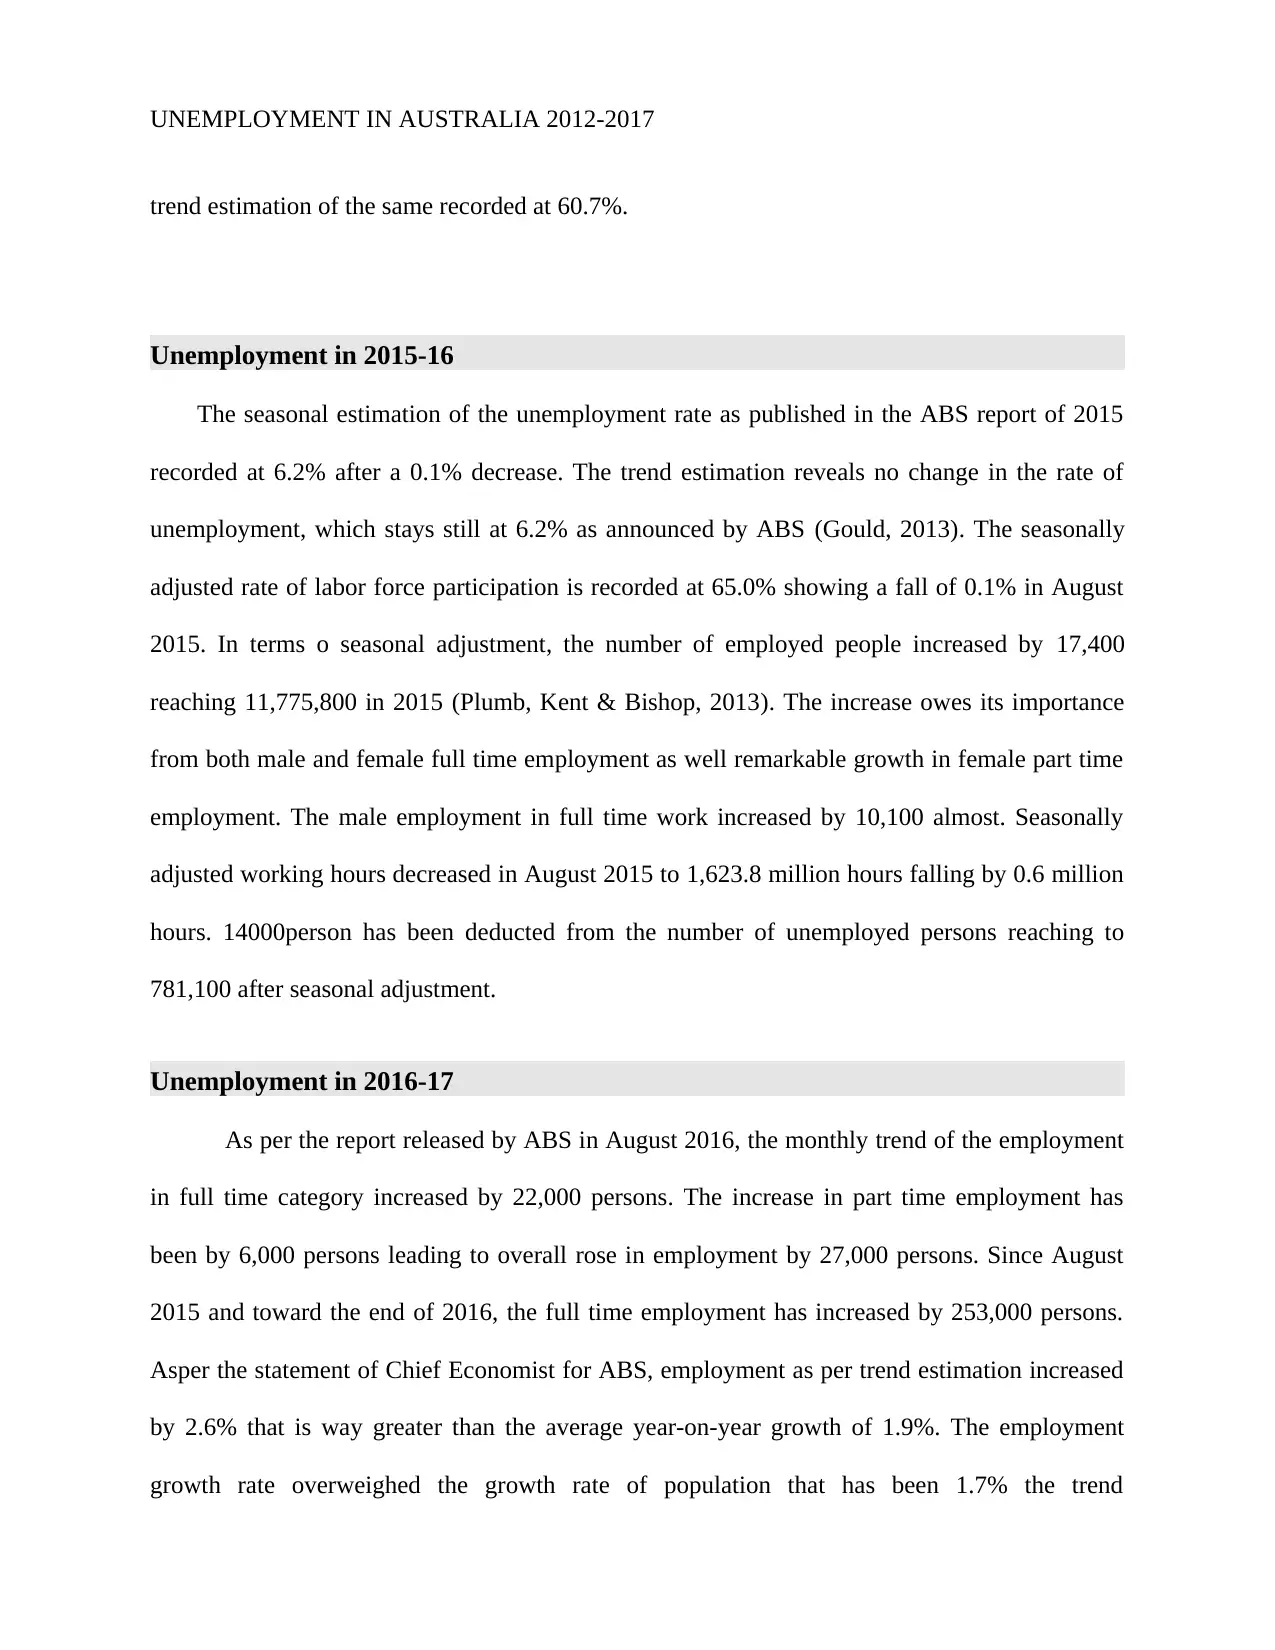
trend estimation of the same recorded at 60.7%.
Unemployment in 2015-16
The seasonal estimation of the unemployment rate as published in the ABS report of 2015
recorded at 6.2% after a 0.1% decrease. The trend estimation reveals no change in the rate of
unemployment, which stays still at 6.2% as announced by ABS (Gould, 2013). The seasonally
adjusted rate of labor force participation is recorded at 65.0% showing a fall of 0.1% in August
2015. In terms o seasonal adjustment, the number of employed people increased by 17,400
reaching 11,775,800 in 2015 (Plumb, Kent & Bishop, 2013). The increase owes its importance
from both male and female full time employment as well remarkable growth in female part time
employment. The male employment in full time work increased by 10,100 almost. Seasonally
adjusted working hours decreased in August 2015 to 1,623.8 million hours falling by 0.6 million
hours. 14000person has been deducted from the number of unemployed persons reaching to
781,100 after seasonal adjustment.
Unemployment in 2016-17
As per the report released by ABS in August 2016, the monthly trend of the employment
in full time category increased by 22,000 persons. The increase in part time employment has
been by 6,000 persons leading to overall rose in employment by 27,000 persons. Since August
2015 and toward the end of 2016, the full time employment has increased by 253,000 persons.
Asper the statement of Chief Economist for ABS, employment as per trend estimation increased
by 2.6% that is way greater than the average year-on-year growth of 1.9%. The employment
growth rate overweighed the growth rate of population that has been 1.7% the trend
⊘ This is a preview!⊘
Do you want full access?
Subscribe today to unlock all pages.
Trusted by 1+ million students worldwide
1 out of 18
Related Documents


Your All-in-One AI-Powered Toolkit for Academic Success.
+13062052269
info@desklib.com
Available 24*7 on WhatsApp / Email
![[object Object]](/_next/static/media/star-bottom.7253800d.svg)
Unlock your academic potential
Copyright © 2020–2026 A2Z Services. All Rights Reserved. Developed and managed by ZUCOL.