Unilever's Business Activities: A Five-Year Performance Evaluation
VerifiedAdded on 2023/06/16
|13
|3523
|453
Report
AI Summary
This report provides a comprehensive analysis of Unilever's business strategies and performance from 2016 to 2020. It begins with an overview of Unilever as a leading international consumer goods company, highlighting its diverse product portfolio and significant market share. The report then examines the strategic and operational changes implemented by Unilever during this period, focusing on areas such as financial planning, human resources, production, marketing, and research and development. A detailed five-year macroeconomic data comparison across the United Kingdom, India, and the United States is presented, considering factors like growth, inflation, currency fluctuations, interest rates, and unemployment. Finally, the report evaluates Unilever's business performance and activities over the five years, providing insights into revenue growth and overall financial health. Desklib offers this report along with a wealth of other solved assignments and past papers to support students in their studies.
The biggest
transnational company
in the UK
transnational company
in the UK
Paraphrase This Document
Need a fresh take? Get an instant paraphrase of this document with our AI Paraphraser
Overview of the business.................................................................................................................1
Changes in strategies and operations from 2016 to 2020................................................................1
Five year macroeconomic data comparison....................................................................................4
Evaluation of business performance and activities over the five years...........................................7
REFERENCES..............................................................................................................................10
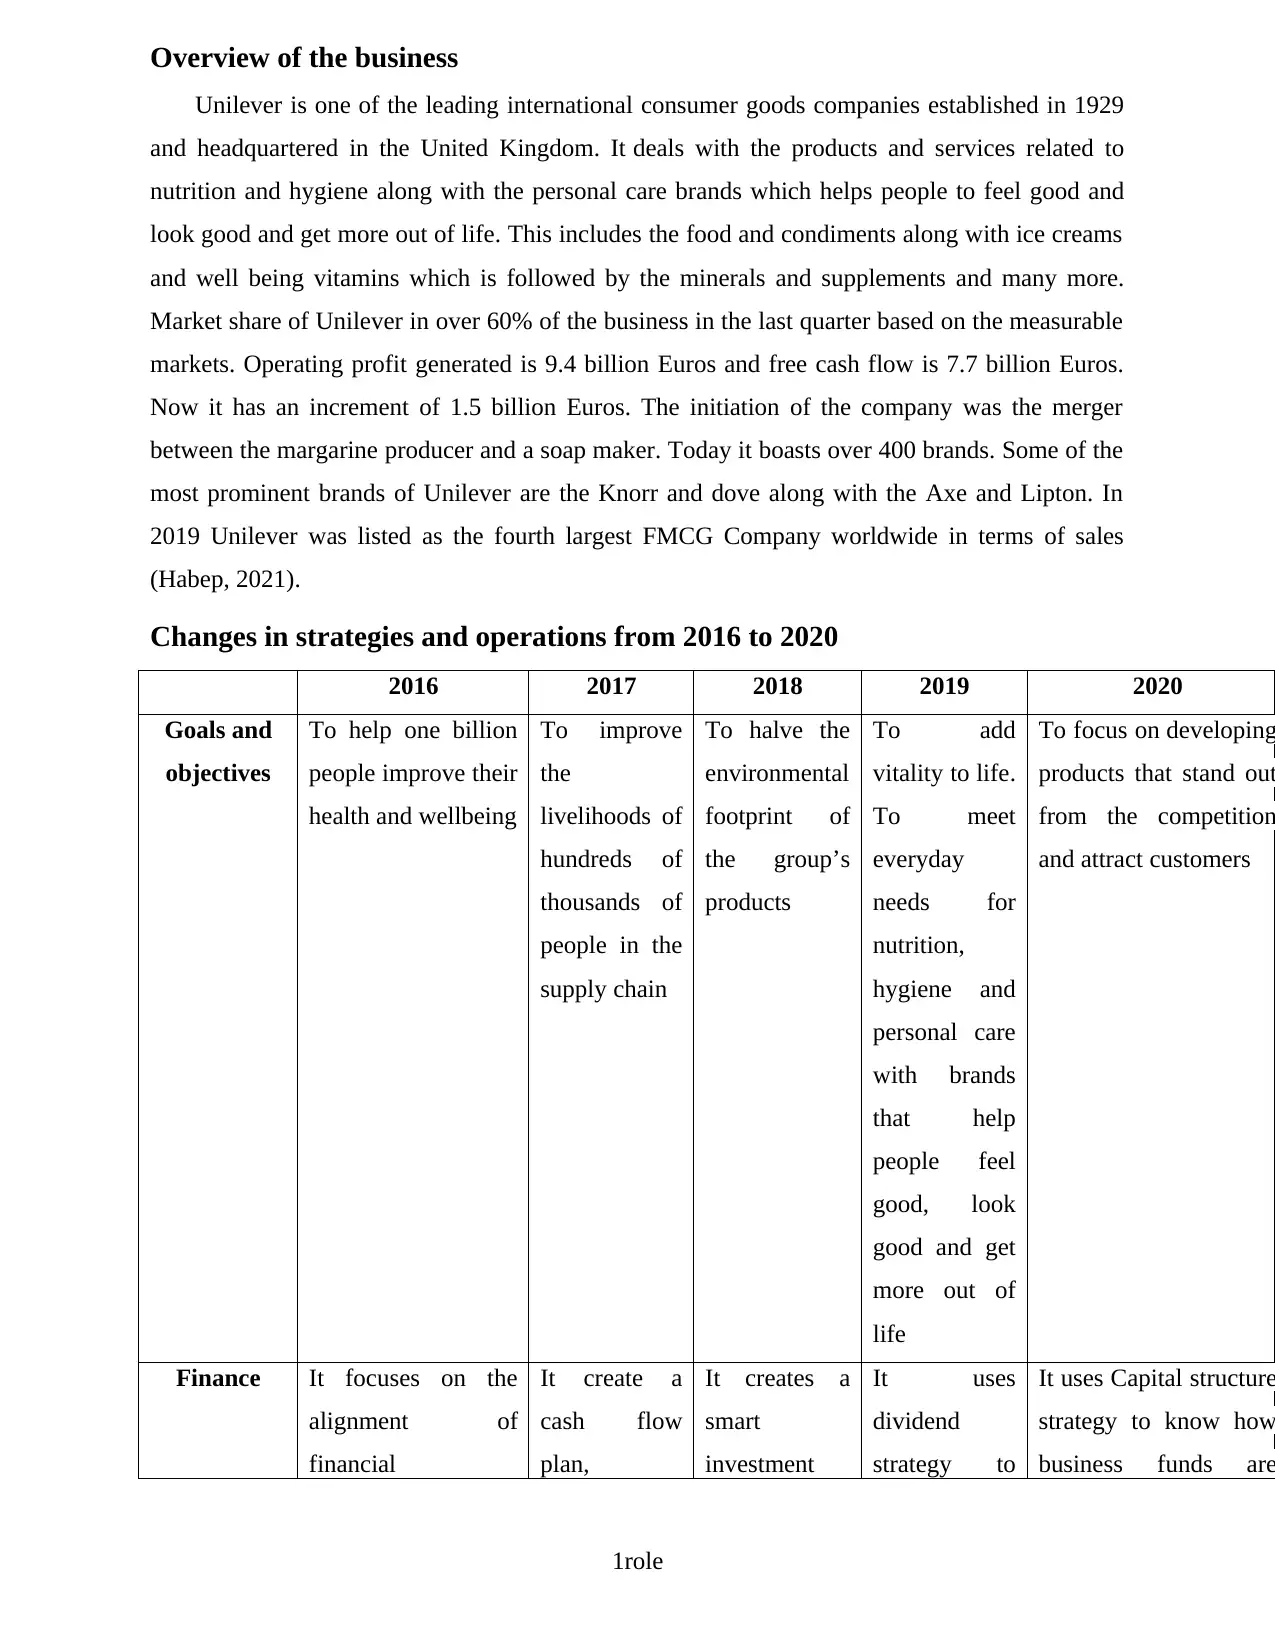
Overview of the business
Unilever is one of the leading international consumer goods companies established in 1929
and headquartered in the United Kingdom. It deals with the products and services related to
nutrition and hygiene along with the personal care brands which helps people to feel good and
look good and get more out of life. This includes the food and condiments along with ice creams
and well being vitamins which is followed by the minerals and supplements and many more.
Market share of Unilever in over 60% of the business in the last quarter based on the measurable
markets. Operating profit generated is 9.4 billion Euros and free cash flow is 7.7 billion Euros.
Now it has an increment of 1.5 billion Euros. The initiation of the company was the merger
between the margarine producer and a soap maker. Today it boasts over 400 brands. Some of the
most prominent brands of Unilever are the Knorr and dove along with the Axe and Lipton. In
2019 Unilever was listed as the fourth largest FMCG Company worldwide in terms of sales
(Habep, 2021).
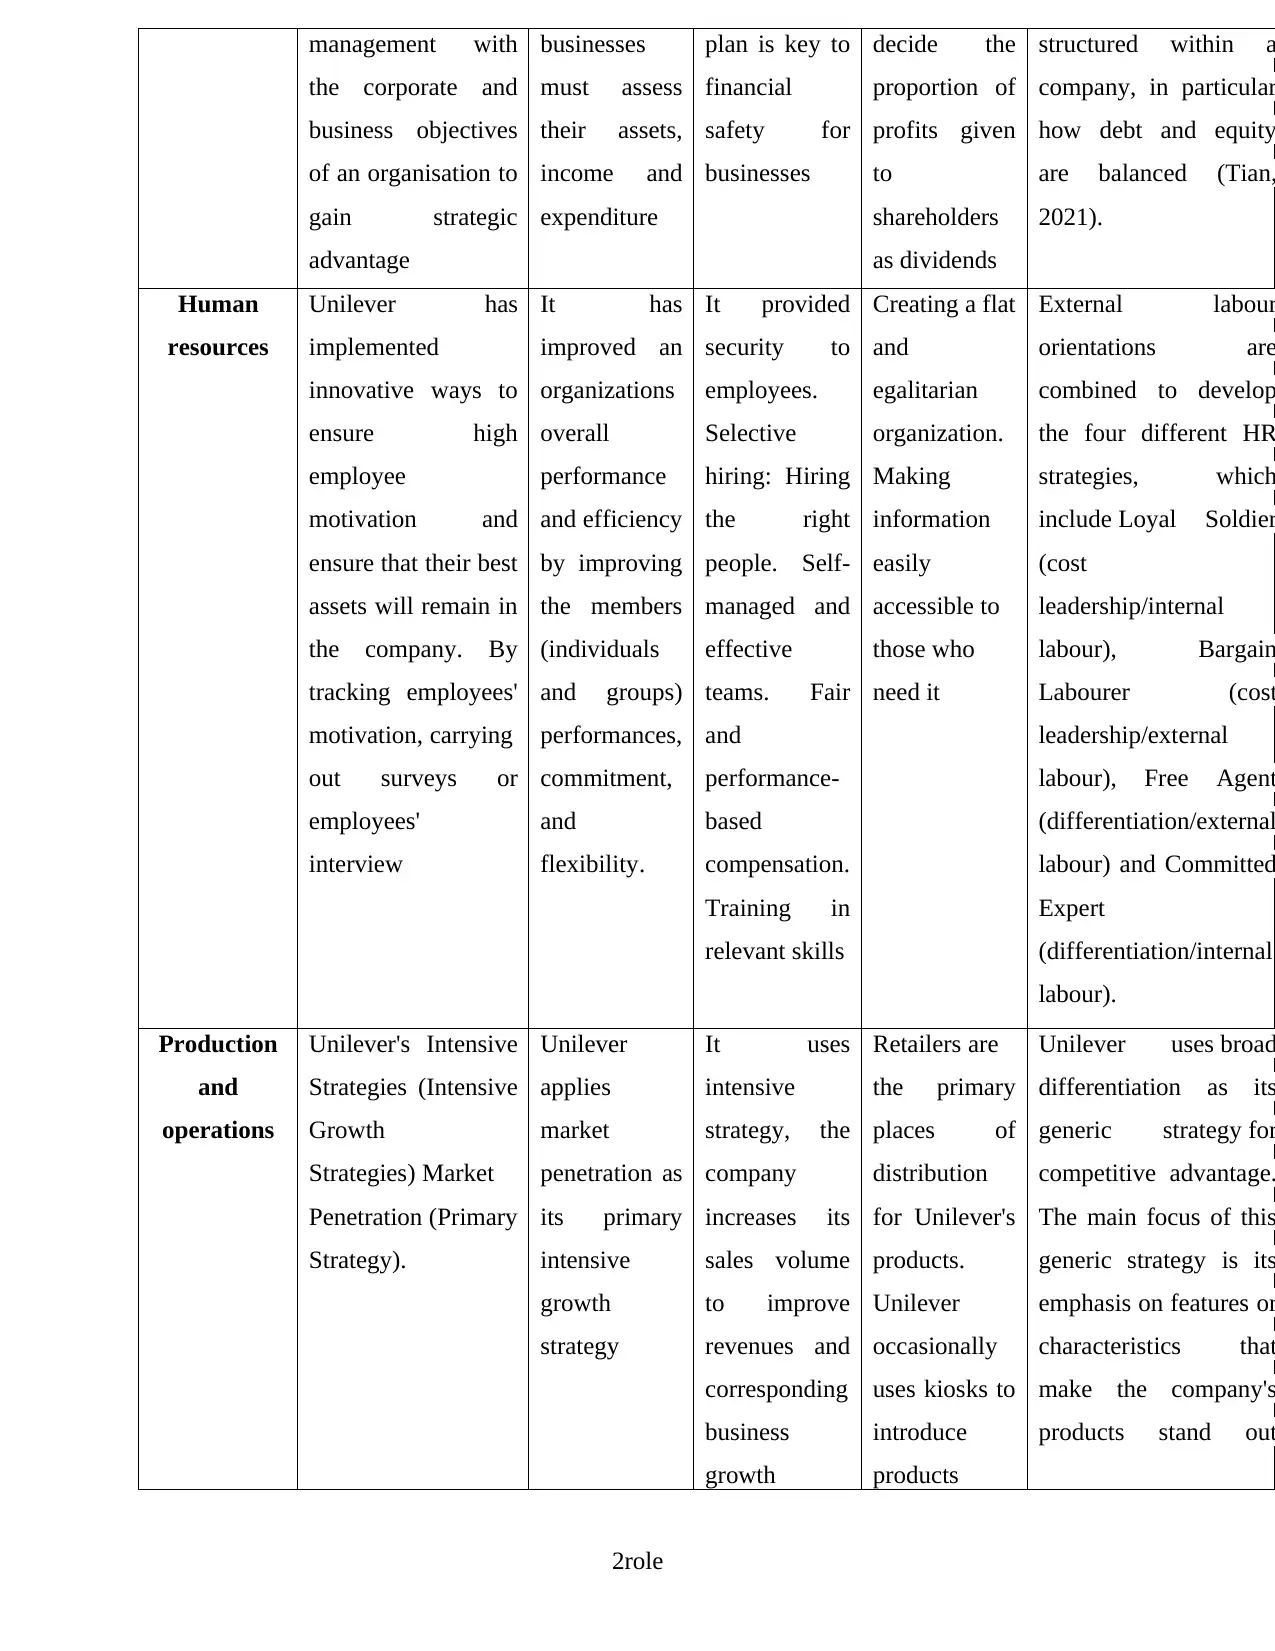
Changes in strategies and operations from 2016 to 2020
2016 2017 2018 2019 2020
Goals and
objectives
To help one billion
people improve their
health and wellbeing
To improve
the
livelihoods of
hundreds of
thousands of
people in the
supply chain
To halve the
environmental
footprint of
the group’s
products
To add
vitality to life.
To meet
everyday
needs for
nutrition,
hygiene and
personal care
with brands
that help
people feel
good, look
good and get
more out of
life
To focus on developing
products that stand out
from the competition
and attract customers
Finance It focuses on the
alignment of
financial
It create a
cash flow
plan,
It creates a
smart
investment
It uses
dividend
strategy to
It uses Capital structure
strategy to know how
business funds are
1role
Unilever is one of the leading international consumer goods companies established in 1929
and headquartered in the United Kingdom. It deals with the products and services related to
nutrition and hygiene along with the personal care brands which helps people to feel good and
look good and get more out of life. This includes the food and condiments along with ice creams
and well being vitamins which is followed by the minerals and supplements and many more.
Market share of Unilever in over 60% of the business in the last quarter based on the measurable
markets. Operating profit generated is 9.4 billion Euros and free cash flow is 7.7 billion Euros.
Now it has an increment of 1.5 billion Euros. The initiation of the company was the merger
between the margarine producer and a soap maker. Today it boasts over 400 brands. Some of the
most prominent brands of Unilever are the Knorr and dove along with the Axe and Lipton. In
2019 Unilever was listed as the fourth largest FMCG Company worldwide in terms of sales
(Habep, 2021).
Changes in strategies and operations from 2016 to 2020
2016 2017 2018 2019 2020
Goals and
objectives
To help one billion
people improve their
health and wellbeing
To improve
the
livelihoods of
hundreds of
thousands of
people in the
supply chain
To halve the
environmental
footprint of
the group’s
products
To add
vitality to life.
To meet
everyday
needs for
nutrition,
hygiene and
personal care
with brands
that help
people feel
good, look
good and get
more out of
life
To focus on developing
products that stand out
from the competition
and attract customers
Finance It focuses on the
alignment of
financial
It create a
cash flow
plan,
It creates a
smart
investment
It uses
dividend
strategy to
It uses Capital structure
strategy to know how
business funds are
1role
⊘ This is a preview!⊘
Do you want full access?
Subscribe today to unlock all pages.
Trusted by 1+ million students worldwide
management with
the corporate and
business objectives
of an organisation to
gain strategic
advantage
businesses
must assess
their assets,
income and
expenditure
plan is key to
financial
safety for
businesses
decide the
proportion of
profits given
to
shareholders
as dividends
structured within a
company, in particular
how debt and equity
are balanced (Tian,
2021).
Human
resources
Unilever has
implemented
innovative ways to
ensure high
employee
motivation and
ensure that their best
assets will remain in
the company. By
tracking employees'
motivation, carrying
out surveys or
employees'
interview
It has
improved an
organizations
overall
performance
and efficiency
by improving
the members
(individuals
and groups)
performances,
commitment,
and
flexibility.
It provided
security to
employees.
Selective
hiring: Hiring
the right
people. Self-
managed and
effective
teams. Fair
and
performance-
based
compensation.
Training in
relevant skills
Creating a flat
and
egalitarian
organization.
Making
information
easily
accessible to
those who
need it
External labour
orientations are
combined to develop
the four different HR
strategies, which
include Loyal Soldier
(cost
leadership/internal
labour), Bargain
Labourer (cost
leadership/external
labour), Free Agent
(differentiation/external
labour) and Committed
Expert
(differentiation/internal
labour).
Production
and
operations
Unilever's Intensive
Strategies (Intensive
Growth
Strategies) Market
Penetration (Primary
Strategy).
Unilever
applies
market
penetration as
its primary
intensive
growth
strategy
It uses
intensive
strategy, the
company
increases its
sales volume
to improve
revenues and
corresponding
business
growth
Retailers are
the primary
places of
distribution
for Unilever's
products.
Unilever
occasionally
uses kiosks to
introduce
products
Unilever uses broad
differentiation as its
generic strategy for
competitive advantage.
The main focus of this
generic strategy is its
emphasis on features or
characteristics that
make the company's
products stand out
2role
Paraphrase This Document
Need a fresh take? Get an instant paraphrase of this document with our AI Paraphraser
directly to
customers,
while
utilizing
personal
selling
against competitors
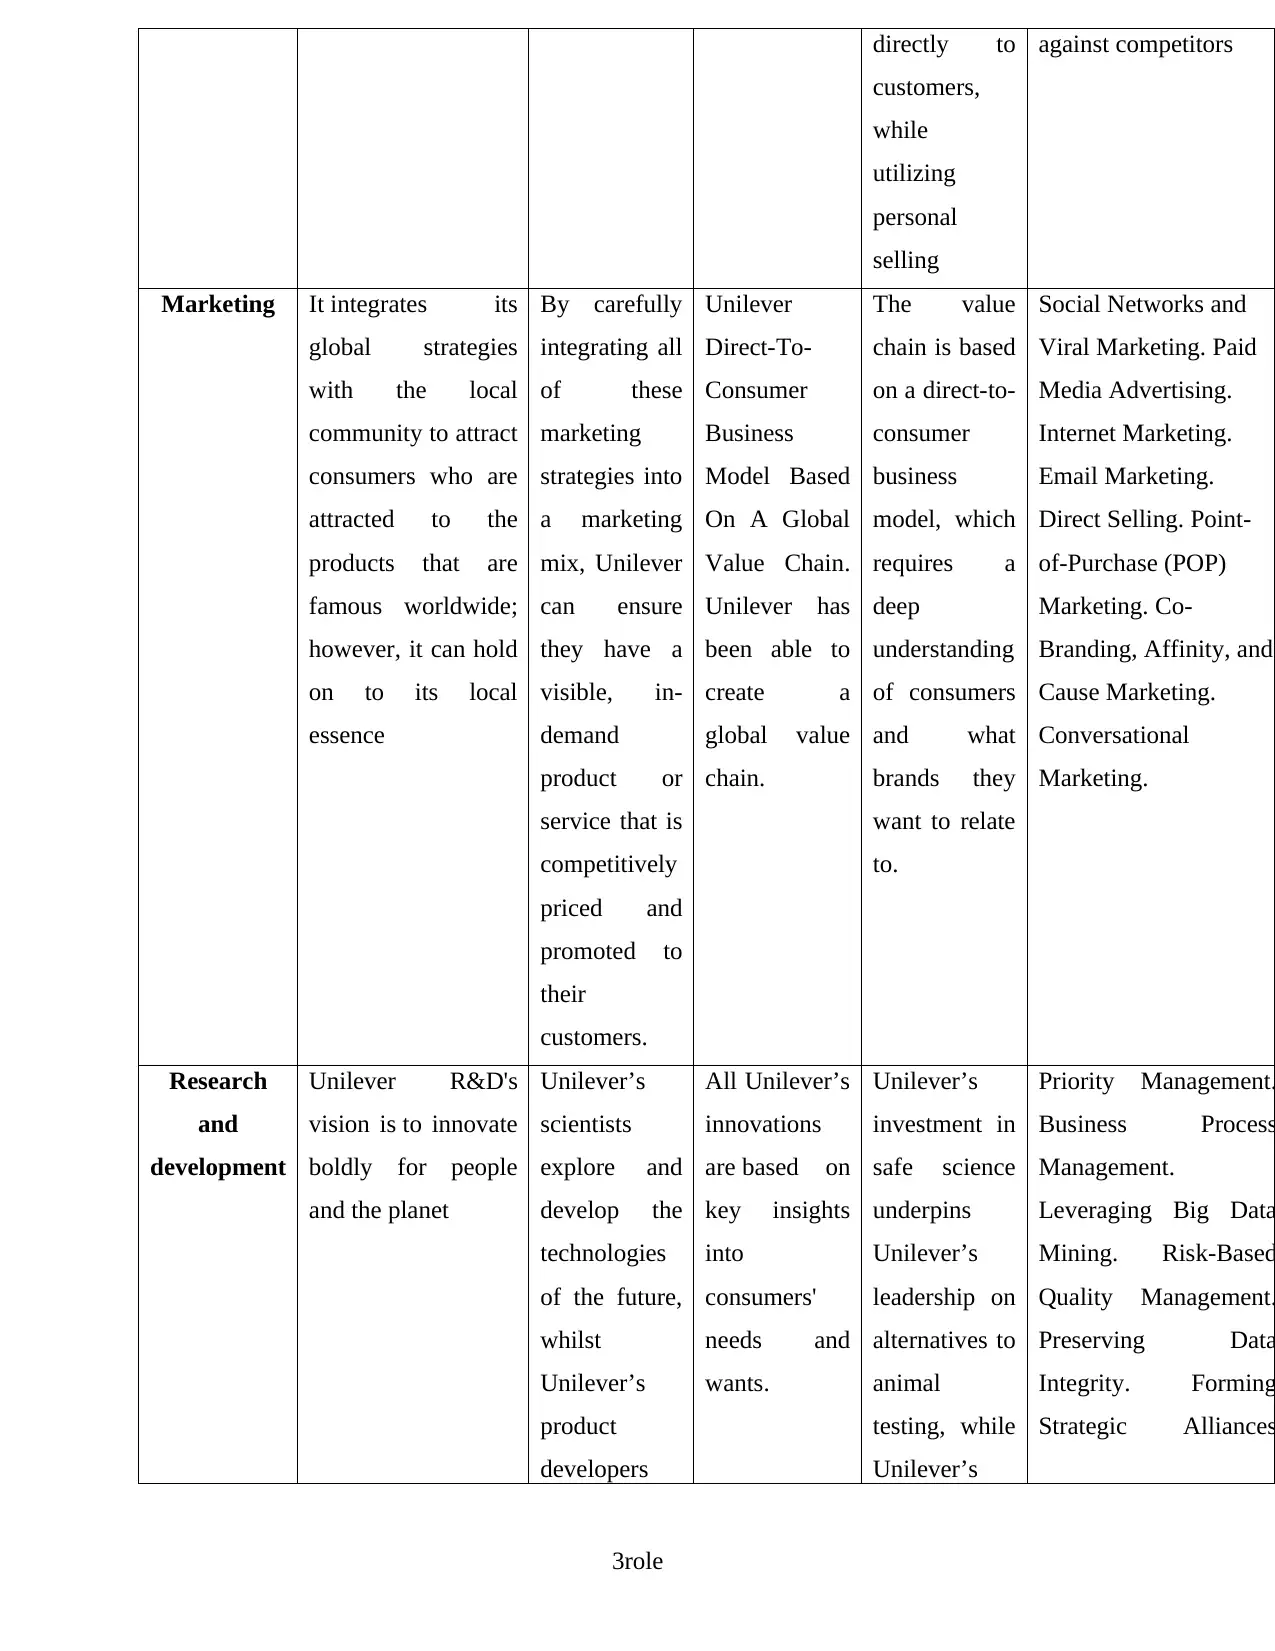
Marketing It integrates its
global strategies
with the local
community to attract
consumers who are
attracted to the
products that are
famous worldwide;
however, it can hold
on to its local
essence
By carefully
integrating all
of these
marketing
strategies into
a marketing
mix, Unilever
can ensure
they have a
visible, in-
demand
product or
service that is
competitively
priced and
promoted to
their
customers.
Unilever
Direct-To-
Consumer
Business
Model Based
On A Global
Value Chain.
Unilever has
been able to
create a
global value
chain.
The value
chain is based
on a direct-to-
consumer
business
model, which
requires a
deep
understanding
of consumers
and what
brands they
want to relate
to.
Social Networks and
Viral Marketing. Paid
Media Advertising.
Internet Marketing.
Email Marketing.
Direct Selling. Point-
of-Purchase (POP)
Marketing. Co-
Branding, Affinity, and
Cause Marketing.
Conversational
Marketing.
Research
and
development
Unilever R&D's
vision is to innovate
boldly for people
and the planet
Unilever’s
scientists
explore and
develop the
technologies
of the future,
whilst
Unilever’s
product
developers
All Unilever’s
innovations
are based on
key insights
into
consumers'
needs and
wants.
Unilever’s
investment in
safe science
underpins
Unilever’s
leadership on
alternatives to
animal
testing, while
Unilever’s
Priority Management.
Business Process
Management.
Leveraging Big Data
Mining. Risk-Based
Quality Management.
Preserving Data
Integrity. Forming
Strategic Alliances
3role
customers,
while
utilizing
personal
selling
against competitors
Marketing It integrates its
global strategies
with the local
community to attract
consumers who are
attracted to the
products that are
famous worldwide;
however, it can hold
on to its local
essence
By carefully
integrating all
of these
marketing
strategies into
a marketing
mix, Unilever
can ensure
they have a
visible, in-
demand
product or
service that is
competitively
priced and
promoted to
their
customers.
Unilever
Direct-To-
Consumer
Business
Model Based
On A Global
Value Chain.
Unilever has
been able to
create a
global value
chain.
The value
chain is based
on a direct-to-
consumer
business
model, which
requires a
deep
understanding
of consumers
and what
brands they
want to relate
to.
Social Networks and
Viral Marketing. Paid
Media Advertising.
Internet Marketing.
Email Marketing.
Direct Selling. Point-
of-Purchase (POP)
Marketing. Co-
Branding, Affinity, and
Cause Marketing.
Conversational
Marketing.
Research
and
development
Unilever R&D's
vision is to innovate
boldly for people
and the planet
Unilever’s
scientists
explore and
develop the
technologies
of the future,
whilst
Unilever’s
product
developers
All Unilever’s
innovations
are based on
key insights
into
consumers'
needs and
wants.
Unilever’s
investment in
safe science
underpins
Unilever’s
leadership on
alternatives to
animal
testing, while
Unilever’s
Priority Management.
Business Process
Management.
Leveraging Big Data
Mining. Risk-Based
Quality Management.
Preserving Data
Integrity. Forming
Strategic Alliances
3role
use this
science and
technology to
develop and
bring to
market
Unilever's
next
generation
innovations.
understanding
of latest
bioscience is
leading to
breakthroughs
for consumer
hygiene and
micro biome
care.
(Cheng, 2021).
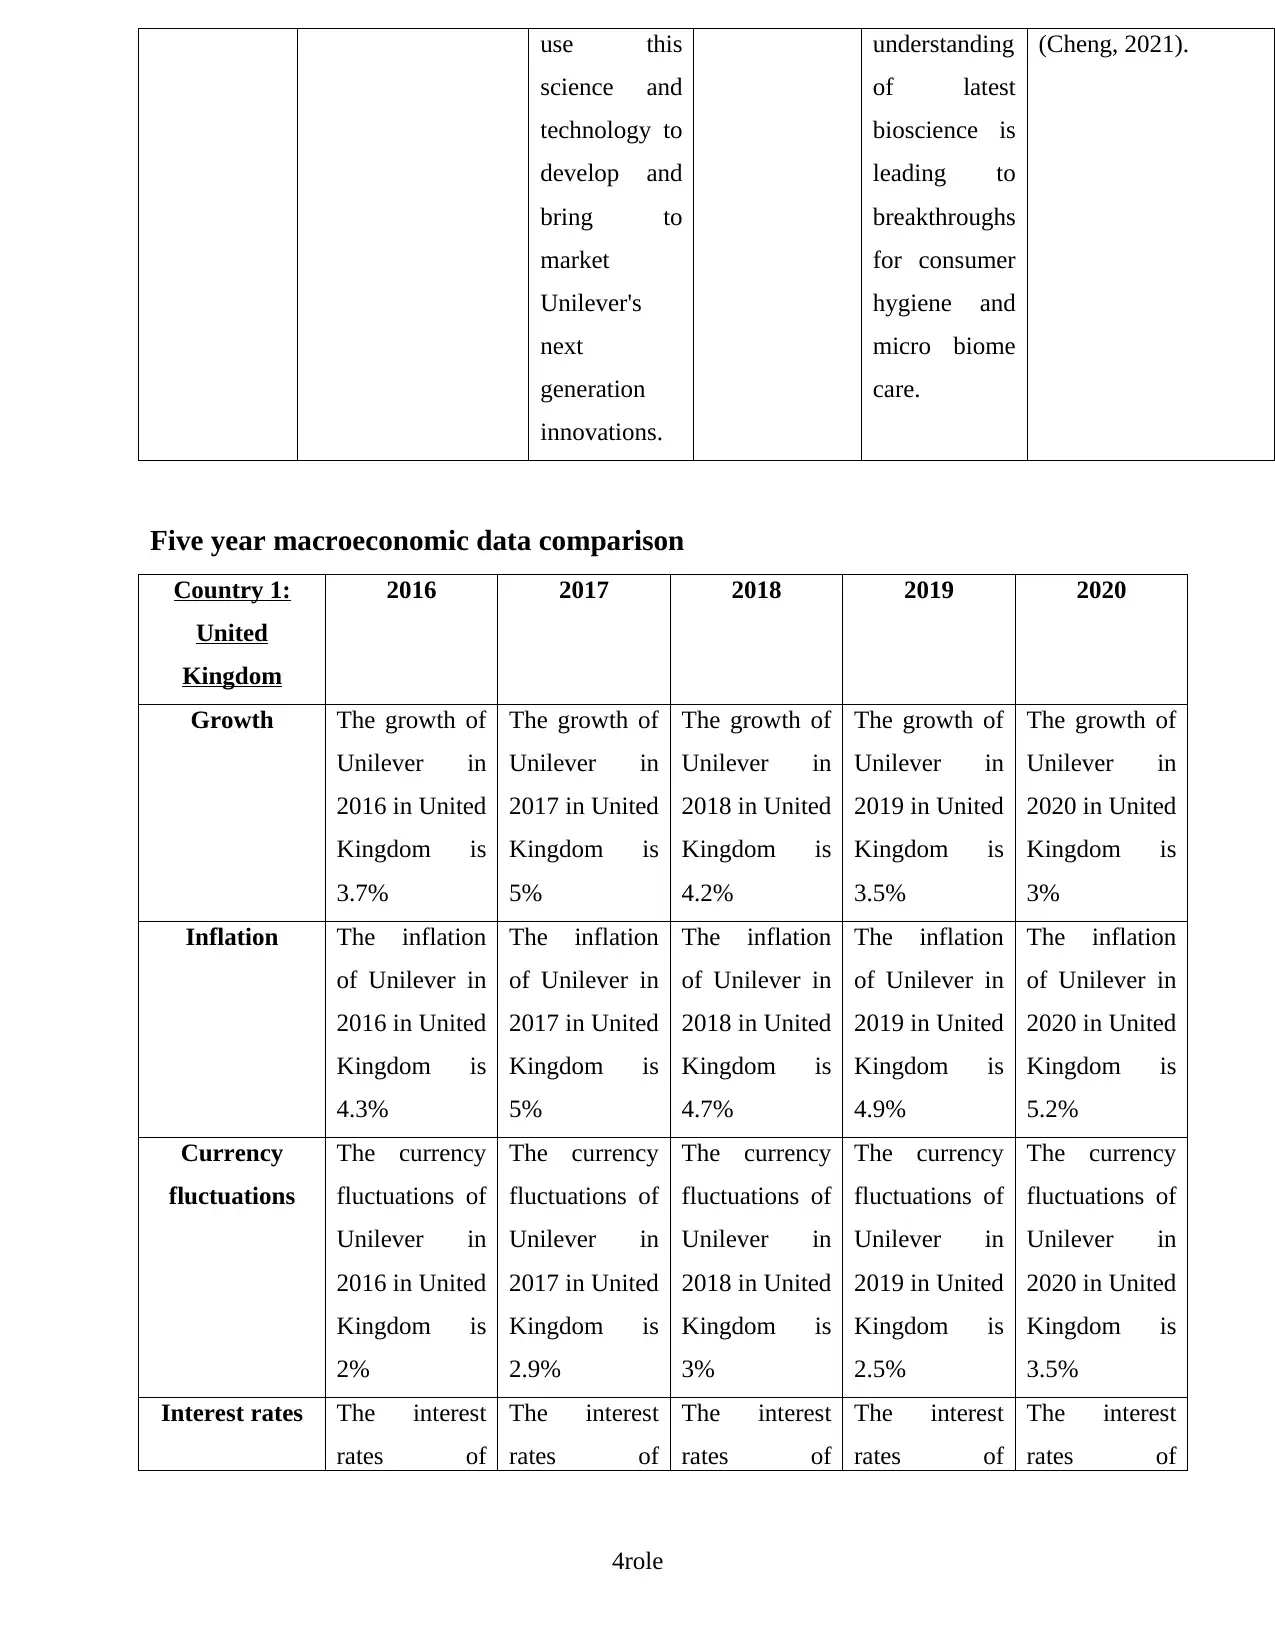
Five year macroeconomic data comparison
Country 1:
United
Kingdom
2016 2017 2018 2019 2020
Growth The growth of
Unilever in
2016 in United
Kingdom is
3.7%
The growth of
Unilever in
2017 in United
Kingdom is
5%
The growth of
Unilever in
2018 in United
Kingdom is
4.2%
The growth of
Unilever in
2019 in United
Kingdom is
3.5%
The growth of
Unilever in
2020 in United
Kingdom is
3%
Inflation The inflation
of Unilever in
2016 in United
Kingdom is
4.3%
The inflation
of Unilever in
2017 in United
Kingdom is
5%
The inflation
of Unilever in
2018 in United
Kingdom is
4.7%
The inflation
of Unilever in
2019 in United
Kingdom is
4.9%
The inflation
of Unilever in
2020 in United
Kingdom is
5.2%
Currency
fluctuations
The currency
fluctuations of
Unilever in
2016 in United
Kingdom is
2%
The currency
fluctuations of
Unilever in
2017 in United
Kingdom is
2.9%
The currency
fluctuations of
Unilever in
2018 in United
Kingdom is
3%
The currency
fluctuations of
Unilever in
2019 in United
Kingdom is
2.5%
The currency
fluctuations of
Unilever in
2020 in United
Kingdom is
3.5%
Interest rates The interest
rates of
The interest
rates of
The interest
rates of
The interest
rates of
The interest
rates of
4role
science and
technology to
develop and
bring to
market
Unilever's
next
generation
innovations.
understanding
of latest
bioscience is
leading to
breakthroughs
for consumer
hygiene and
micro biome
care.
(Cheng, 2021).
Five year macroeconomic data comparison
Country 1:
United
Kingdom
2016 2017 2018 2019 2020
Growth The growth of
Unilever in
2016 in United
Kingdom is
3.7%
The growth of
Unilever in
2017 in United
Kingdom is
5%
The growth of
Unilever in
2018 in United
Kingdom is
4.2%
The growth of
Unilever in
2019 in United
Kingdom is
3.5%
The growth of
Unilever in
2020 in United
Kingdom is
3%
Inflation The inflation
of Unilever in
2016 in United
Kingdom is
4.3%
The inflation
of Unilever in
2017 in United
Kingdom is
5%
The inflation
of Unilever in
2018 in United
Kingdom is
4.7%
The inflation
of Unilever in
2019 in United
Kingdom is
4.9%
The inflation
of Unilever in
2020 in United
Kingdom is
5.2%
Currency
fluctuations
The currency
fluctuations of
Unilever in
2016 in United
Kingdom is
2%
The currency
fluctuations of
Unilever in
2017 in United
Kingdom is
2.9%
The currency
fluctuations of
Unilever in
2018 in United
Kingdom is
3%
The currency
fluctuations of
Unilever in
2019 in United
Kingdom is
2.5%
The currency
fluctuations of
Unilever in
2020 in United
Kingdom is
3.5%
Interest rates The interest
rates of
The interest
rates of
The interest
rates of
The interest
rates of
The interest
rates of
4role
⊘ This is a preview!⊘
Do you want full access?
Subscribe today to unlock all pages.
Trusted by 1+ million students worldwide
Unilever in
2016 in United
Kingdom is
3.5%
Unilever in
2017 in United
Kingdom is
4%
Unilever in
2018 in United
Kingdom is
3%
Unilever in
2019 in United
Kingdom is
4.5%
Unilever in
2020 in United
Kingdom is
4.9%
Unemployment The
unemployment
of Unilever in
2016 in United
Kingdom is
3.5%
The
unemployment
of Unilever in
2017 in United
Kingdom is
3.9%
The
unemployment
of Unilever in
2018 in United
Kingdom is
4.2%
The
unemployment
of Unilever in
2019 in United
Kingdom is
4%
The
unemployment
of Unilever in
2020 in United
Kingdom is
4.5%
(Мусах and
Туль, 2021).
Current
account
balance
The current
account
balance of
Unilever in
2016 in United
Kingdom is
3900 GBp
The current
account
balance of
Unilever in
2017 in United
Kingdom is
3850 GBp
The current
account
balance of
Unilever in
2018 in United
Kingdom is
3879 GBp
The current
account
balance of
Unilever in
2019 in United
Kingdom is
3850 GBp
The current
account
balance of
Unilever in
2020 in United
Kingdom is
3800 GBp
Country 2:
India
2016 2017 2018 2019 2020
Growth The growth of
Unilever in
2016 in India
is 4%
The growth of
Unilever in
2017 in India
is 4.2%
The growth of
Unilever in
2018 in India
is 4.5%
The growth of
Unilever in
2019 in India
is 3.9%
The growth of
Unilever in
2020 in India
is 3.5%
Inflation The inflation
of Unilever in
2016 in India
is 5%
The inflation
of Unilever in
2017 in India
is 4.8%
The inflation
of Unilever in
2018 in India
is 4.5%
The inflation
of Unilever in
2019 in India
is 4.9%
The inflation
of Unilever in
2020 in India
is 5%
Currency
fluctuations
The currency
fluctuations of
Unilever in
The currency
fluctuations of
Unilever in
The currency
fluctuations of
Unilever in
The currency
fluctuations of
Unilever in
The currency
fluctuations of
Unilever in
5role
2016 in United
Kingdom is
3.5%
Unilever in
2017 in United
Kingdom is
4%
Unilever in
2018 in United
Kingdom is
3%
Unilever in
2019 in United
Kingdom is
4.5%
Unilever in
2020 in United
Kingdom is
4.9%
Unemployment The
unemployment
of Unilever in
2016 in United
Kingdom is
3.5%
The
unemployment
of Unilever in
2017 in United
Kingdom is
3.9%
The
unemployment
of Unilever in
2018 in United
Kingdom is
4.2%
The
unemployment
of Unilever in
2019 in United
Kingdom is
4%
The
unemployment
of Unilever in
2020 in United
Kingdom is
4.5%
(Мусах and
Туль, 2021).
Current
account
balance
The current
account
balance of
Unilever in
2016 in United
Kingdom is
3900 GBp
The current
account
balance of
Unilever in
2017 in United
Kingdom is
3850 GBp
The current
account
balance of
Unilever in
2018 in United
Kingdom is
3879 GBp
The current
account
balance of
Unilever in
2019 in United
Kingdom is
3850 GBp
The current
account
balance of
Unilever in
2020 in United
Kingdom is
3800 GBp
Country 2:
India
2016 2017 2018 2019 2020
Growth The growth of
Unilever in
2016 in India
is 4%
The growth of
Unilever in
2017 in India
is 4.2%
The growth of
Unilever in
2018 in India
is 4.5%
The growth of
Unilever in
2019 in India
is 3.9%
The growth of
Unilever in
2020 in India
is 3.5%
Inflation The inflation
of Unilever in
2016 in India
is 5%
The inflation
of Unilever in
2017 in India
is 4.8%
The inflation
of Unilever in
2018 in India
is 4.5%
The inflation
of Unilever in
2019 in India
is 4.9%
The inflation
of Unilever in
2020 in India
is 5%
Currency
fluctuations
The currency
fluctuations of
Unilever in
The currency
fluctuations of
Unilever in
The currency
fluctuations of
Unilever in
The currency
fluctuations of
Unilever in
The currency
fluctuations of
Unilever in
5role
Paraphrase This Document
Need a fresh take? Get an instant paraphrase of this document with our AI Paraphraser
2016 in India
is 2%
2017 in India
is 2.3%
2018 in India
is 2%
2019 in India
is 2.5%
2020 in India
is 2.9%
(Hinton, 2021)
Interest rates The interest
rates of
Unilever in
2016 in India
is 3%
The interest
rates of
Unilever in
2017 in India
is 3.2%
The interest
rates of
Unilever in
2018 in India
is 3.1%
The interest
rates of
Unilever in
2019 in India
is 3.5%
The interest
rates of
Unilever in
2020 in India
is 3.9%
Unemployment The
unemployment
of Unilever in
2016 in India
is 5%
The
unemployment
of Unilever in
2017 in India
is 5.5%
The
unemployment
of Unilever in
2018 in India
is 4.9%
The
unemployment
of Unilever in
2019 in India
is 5.9%
The
unemployment
of Unilever in
2020 in India
is 6.1%
Current
account
balance
The current
account
balance of
Unilever in
2016 in India
is 4000 GBp
The current
account
balance of
Unilever in
2017 in India
is 4500 GBp
The current
account
balance of
Unilever in
2018 in India
is 3900 GBp
The current
account
balance of
Unilever in
2019 in India
is 3500 GBp
The current
account
balance of
Unilever in
2020 in India
is 3000 GBp
(Kpoku, 2021)
Country 3:
Unites States
2016 2017 2018 2019 2020
Growth The growth of
Unilever in
2016 in United
States is
The growth of
Unilever in
2017 in United
States is
The growth of
Unilever in
2018 in United
States is
The growth of
Unilever in
2019 in United
States is
The growth of
Unilever in
2020 in United
States is
Inflation The inflation
of Unilever in
2016 in United
States is
The inflation
of Unilever in
2017 in United
states is
The inflation
of Unilever in
2018 in United
states is
The inflation
of Unilever in
2019 in United
States is
The inflation
of Unilever in
2020 in United
states is
Currency
fluctuations
The currency
fluctuations of
The currency
fluctuations of
The currency
fluctuations of
The currency
fluctuations of
The currency
fluctuations of
6role
is 2%
2017 in India
is 2.3%
2018 in India
is 2%
2019 in India
is 2.5%
2020 in India
is 2.9%
(Hinton, 2021)
Interest rates The interest
rates of
Unilever in
2016 in India
is 3%
The interest
rates of
Unilever in
2017 in India
is 3.2%
The interest
rates of
Unilever in
2018 in India
is 3.1%
The interest
rates of
Unilever in
2019 in India
is 3.5%
The interest
rates of
Unilever in
2020 in India
is 3.9%
Unemployment The
unemployment
of Unilever in
2016 in India
is 5%
The
unemployment
of Unilever in
2017 in India
is 5.5%
The
unemployment
of Unilever in
2018 in India
is 4.9%
The
unemployment
of Unilever in
2019 in India
is 5.9%
The
unemployment
of Unilever in
2020 in India
is 6.1%
Current
account
balance
The current
account
balance of
Unilever in
2016 in India
is 4000 GBp
The current
account
balance of
Unilever in
2017 in India
is 4500 GBp
The current
account
balance of
Unilever in
2018 in India
is 3900 GBp
The current
account
balance of
Unilever in
2019 in India
is 3500 GBp
The current
account
balance of
Unilever in
2020 in India
is 3000 GBp
(Kpoku, 2021)
Country 3:
Unites States
2016 2017 2018 2019 2020
Growth The growth of
Unilever in
2016 in United
States is
The growth of
Unilever in
2017 in United
States is
The growth of
Unilever in
2018 in United
States is
The growth of
Unilever in
2019 in United
States is
The growth of
Unilever in
2020 in United
States is
Inflation The inflation
of Unilever in
2016 in United
States is
The inflation
of Unilever in
2017 in United
states is
The inflation
of Unilever in
2018 in United
states is
The inflation
of Unilever in
2019 in United
States is
The inflation
of Unilever in
2020 in United
states is
Currency
fluctuations
The currency
fluctuations of
The currency
fluctuations of
The currency
fluctuations of
The currency
fluctuations of
The currency
fluctuations of
6role
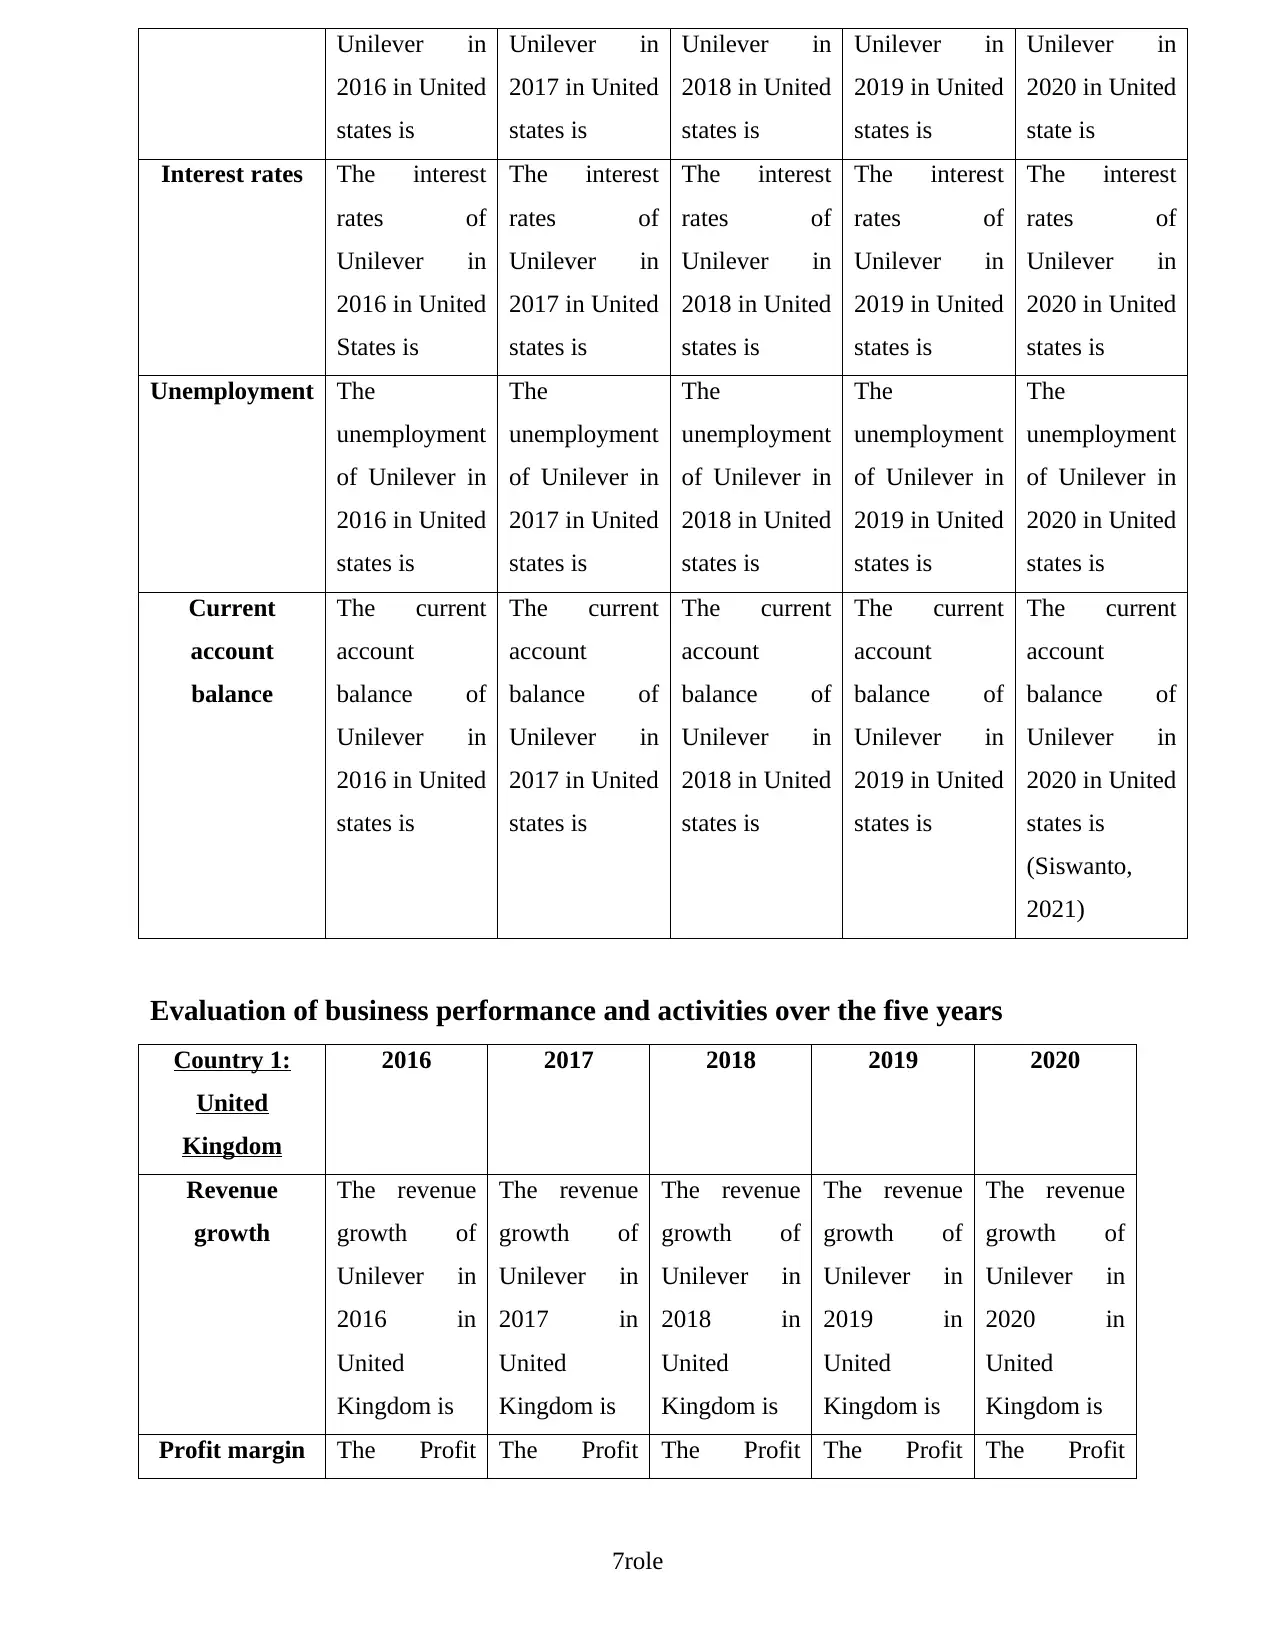
Unilever in
2016 in United
states is
Unilever in
2017 in United
states is
Unilever in
2018 in United
states is
Unilever in
2019 in United
states is
Unilever in
2020 in United
state is
Interest rates The interest
rates of
Unilever in
2016 in United
States is
The interest
rates of
Unilever in
2017 in United
states is
The interest
rates of
Unilever in
2018 in United
states is
The interest
rates of
Unilever in
2019 in United
states is
The interest
rates of
Unilever in
2020 in United
states is
Unemployment The
unemployment
of Unilever in
2016 in United
states is
The
unemployment
of Unilever in
2017 in United
states is
The
unemployment
of Unilever in
2018 in United
states is
The
unemployment
of Unilever in
2019 in United
states is
The
unemployment
of Unilever in
2020 in United
states is
Current
account
balance
The current
account
balance of
Unilever in
2016 in United
states is
The current
account
balance of
Unilever in
2017 in United
states is
The current
account
balance of
Unilever in
2018 in United
states is
The current
account
balance of
Unilever in
2019 in United
states is
The current
account
balance of
Unilever in
2020 in United
states is
(Siswanto,
2021)
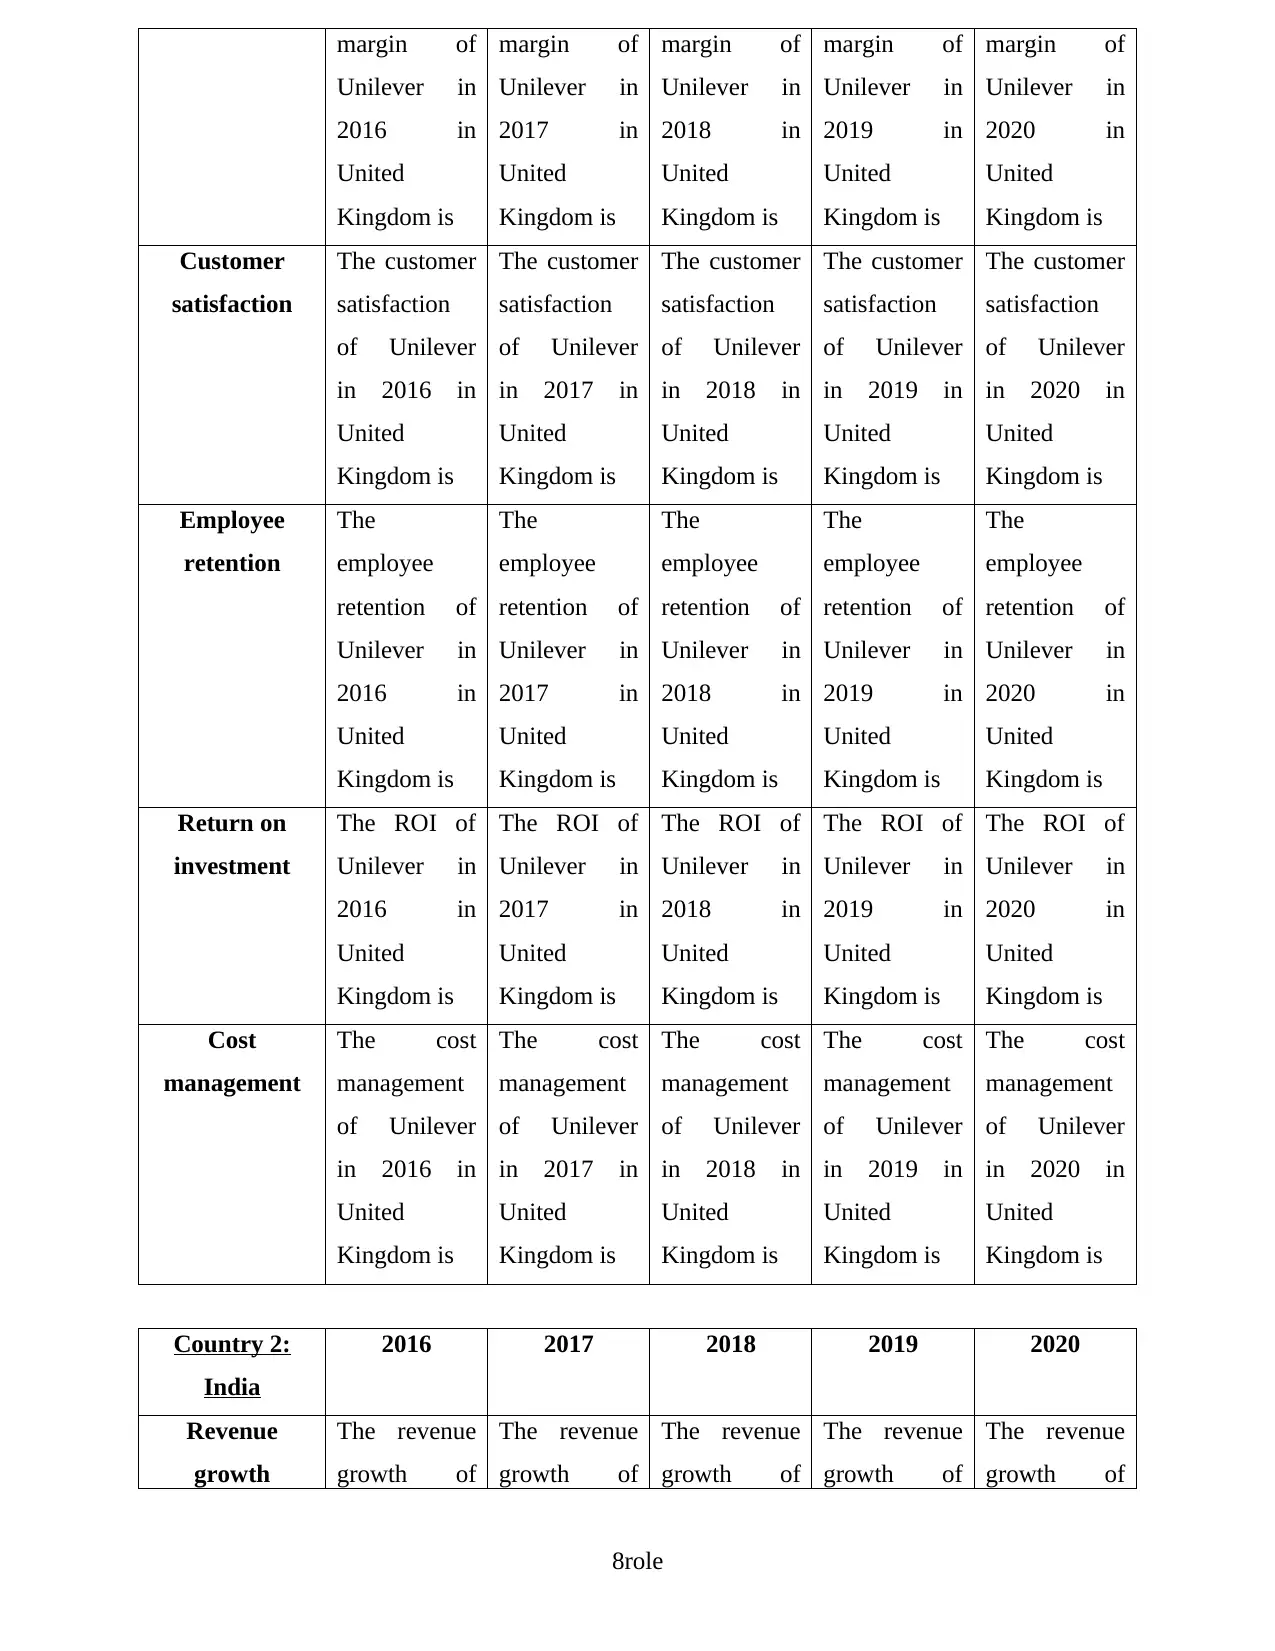
Evaluation of business performance and activities over the five years
Country 1:
United
Kingdom
2016 2017 2018 2019 2020
Revenue
growth
The revenue
growth of
Unilever in
2016 in
United
Kingdom is
The revenue
growth of
Unilever in
2017 in
United
Kingdom is
The revenue
growth of
Unilever in
2018 in
United
Kingdom is
The revenue
growth of
Unilever in
2019 in
United
Kingdom is
The revenue
growth of
Unilever in
2020 in
United
Kingdom is
Profit margin The Profit The Profit The Profit The Profit The Profit
7role
2016 in United
states is
Unilever in
2017 in United
states is
Unilever in
2018 in United
states is
Unilever in
2019 in United
states is
Unilever in
2020 in United
state is
Interest rates The interest
rates of
Unilever in
2016 in United
States is
The interest
rates of
Unilever in
2017 in United
states is
The interest
rates of
Unilever in
2018 in United
states is
The interest
rates of
Unilever in
2019 in United
states is
The interest
rates of
Unilever in
2020 in United
states is
Unemployment The
unemployment
of Unilever in
2016 in United
states is
The
unemployment
of Unilever in
2017 in United
states is
The
unemployment
of Unilever in
2018 in United
states is
The
unemployment
of Unilever in
2019 in United
states is
The
unemployment
of Unilever in
2020 in United
states is
Current
account
balance
The current
account
balance of
Unilever in
2016 in United
states is
The current
account
balance of
Unilever in
2017 in United
states is
The current
account
balance of
Unilever in
2018 in United
states is
The current
account
balance of
Unilever in
2019 in United
states is
The current
account
balance of
Unilever in
2020 in United
states is
(Siswanto,
2021)
Evaluation of business performance and activities over the five years
Country 1:
United
Kingdom
2016 2017 2018 2019 2020
Revenue
growth
The revenue
growth of
Unilever in
2016 in
United
Kingdom is
The revenue
growth of
Unilever in
2017 in
United
Kingdom is
The revenue
growth of
Unilever in
2018 in
United
Kingdom is
The revenue
growth of
Unilever in
2019 in
United
Kingdom is
The revenue
growth of
Unilever in
2020 in
United
Kingdom is
Profit margin The Profit The Profit The Profit The Profit The Profit
7role
⊘ This is a preview!⊘
Do you want full access?
Subscribe today to unlock all pages.
Trusted by 1+ million students worldwide
margin of
Unilever in
2016 in
United
Kingdom is
margin of
Unilever in
2017 in
United
Kingdom is
margin of
Unilever in
2018 in
United
Kingdom is
margin of
Unilever in
2019 in
United
Kingdom is
margin of
Unilever in
2020 in
United
Kingdom is
Customer
satisfaction
The customer
satisfaction
of Unilever
in 2016 in
United
Kingdom is
The customer
satisfaction
of Unilever
in 2017 in
United
Kingdom is
The customer
satisfaction
of Unilever
in 2018 in
United
Kingdom is
The customer
satisfaction
of Unilever
in 2019 in
United
Kingdom is
The customer
satisfaction
of Unilever
in 2020 in
United
Kingdom is
Employee
retention
The
employee
retention of
Unilever in
2016 in
United
Kingdom is
The
employee
retention of
Unilever in
2017 in
United
Kingdom is
The
employee
retention of
Unilever in
2018 in
United
Kingdom is
The
employee
retention of
Unilever in
2019 in
United
Kingdom is
The
employee
retention of
Unilever in
2020 in
United
Kingdom is
Return on
investment
The ROI of
Unilever in
2016 in
United
Kingdom is
The ROI of
Unilever in
2017 in
United
Kingdom is
The ROI of
Unilever in
2018 in
United
Kingdom is
The ROI of
Unilever in
2019 in
United
Kingdom is
The ROI of
Unilever in
2020 in
United
Kingdom is
Cost
management
The cost
management
of Unilever
in 2016 in
United
Kingdom is
The cost
management
of Unilever
in 2017 in
United
Kingdom is
The cost
management
of Unilever
in 2018 in
United
Kingdom is
The cost
management
of Unilever
in 2019 in
United
Kingdom is
The cost
management
of Unilever
in 2020 in
United
Kingdom is
Country 2:
India
2016 2017 2018 2019 2020
Revenue
growth
The revenue
growth of
The revenue
growth of
The revenue
growth of
The revenue
growth of
The revenue
growth of
8role
Unilever in
2016 in
United
Kingdom is
margin of
Unilever in
2017 in
United
Kingdom is
margin of
Unilever in
2018 in
United
Kingdom is
margin of
Unilever in
2019 in
United
Kingdom is
margin of
Unilever in
2020 in
United
Kingdom is
Customer
satisfaction
The customer
satisfaction
of Unilever
in 2016 in
United
Kingdom is
The customer
satisfaction
of Unilever
in 2017 in
United
Kingdom is
The customer
satisfaction
of Unilever
in 2018 in
United
Kingdom is
The customer
satisfaction
of Unilever
in 2019 in
United
Kingdom is
The customer
satisfaction
of Unilever
in 2020 in
United
Kingdom is
Employee
retention
The
employee
retention of
Unilever in
2016 in
United
Kingdom is
The
employee
retention of
Unilever in
2017 in
United
Kingdom is
The
employee
retention of
Unilever in
2018 in
United
Kingdom is
The
employee
retention of
Unilever in
2019 in
United
Kingdom is
The
employee
retention of
Unilever in
2020 in
United
Kingdom is
Return on
investment
The ROI of
Unilever in
2016 in
United
Kingdom is
The ROI of
Unilever in
2017 in
United
Kingdom is
The ROI of
Unilever in
2018 in
United
Kingdom is
The ROI of
Unilever in
2019 in
United
Kingdom is
The ROI of
Unilever in
2020 in
United
Kingdom is
Cost
management
The cost
management
of Unilever
in 2016 in
United
Kingdom is
The cost
management
of Unilever
in 2017 in
United
Kingdom is
The cost
management
of Unilever
in 2018 in
United
Kingdom is
The cost
management
of Unilever
in 2019 in
United
Kingdom is
The cost
management
of Unilever
in 2020 in
United
Kingdom is
Country 2:
India
2016 2017 2018 2019 2020
Revenue
growth
The revenue
growth of
The revenue
growth of
The revenue
growth of
The revenue
growth of
The revenue
growth of
8role
Paraphrase This Document
Need a fresh take? Get an instant paraphrase of this document with our AI Paraphraser
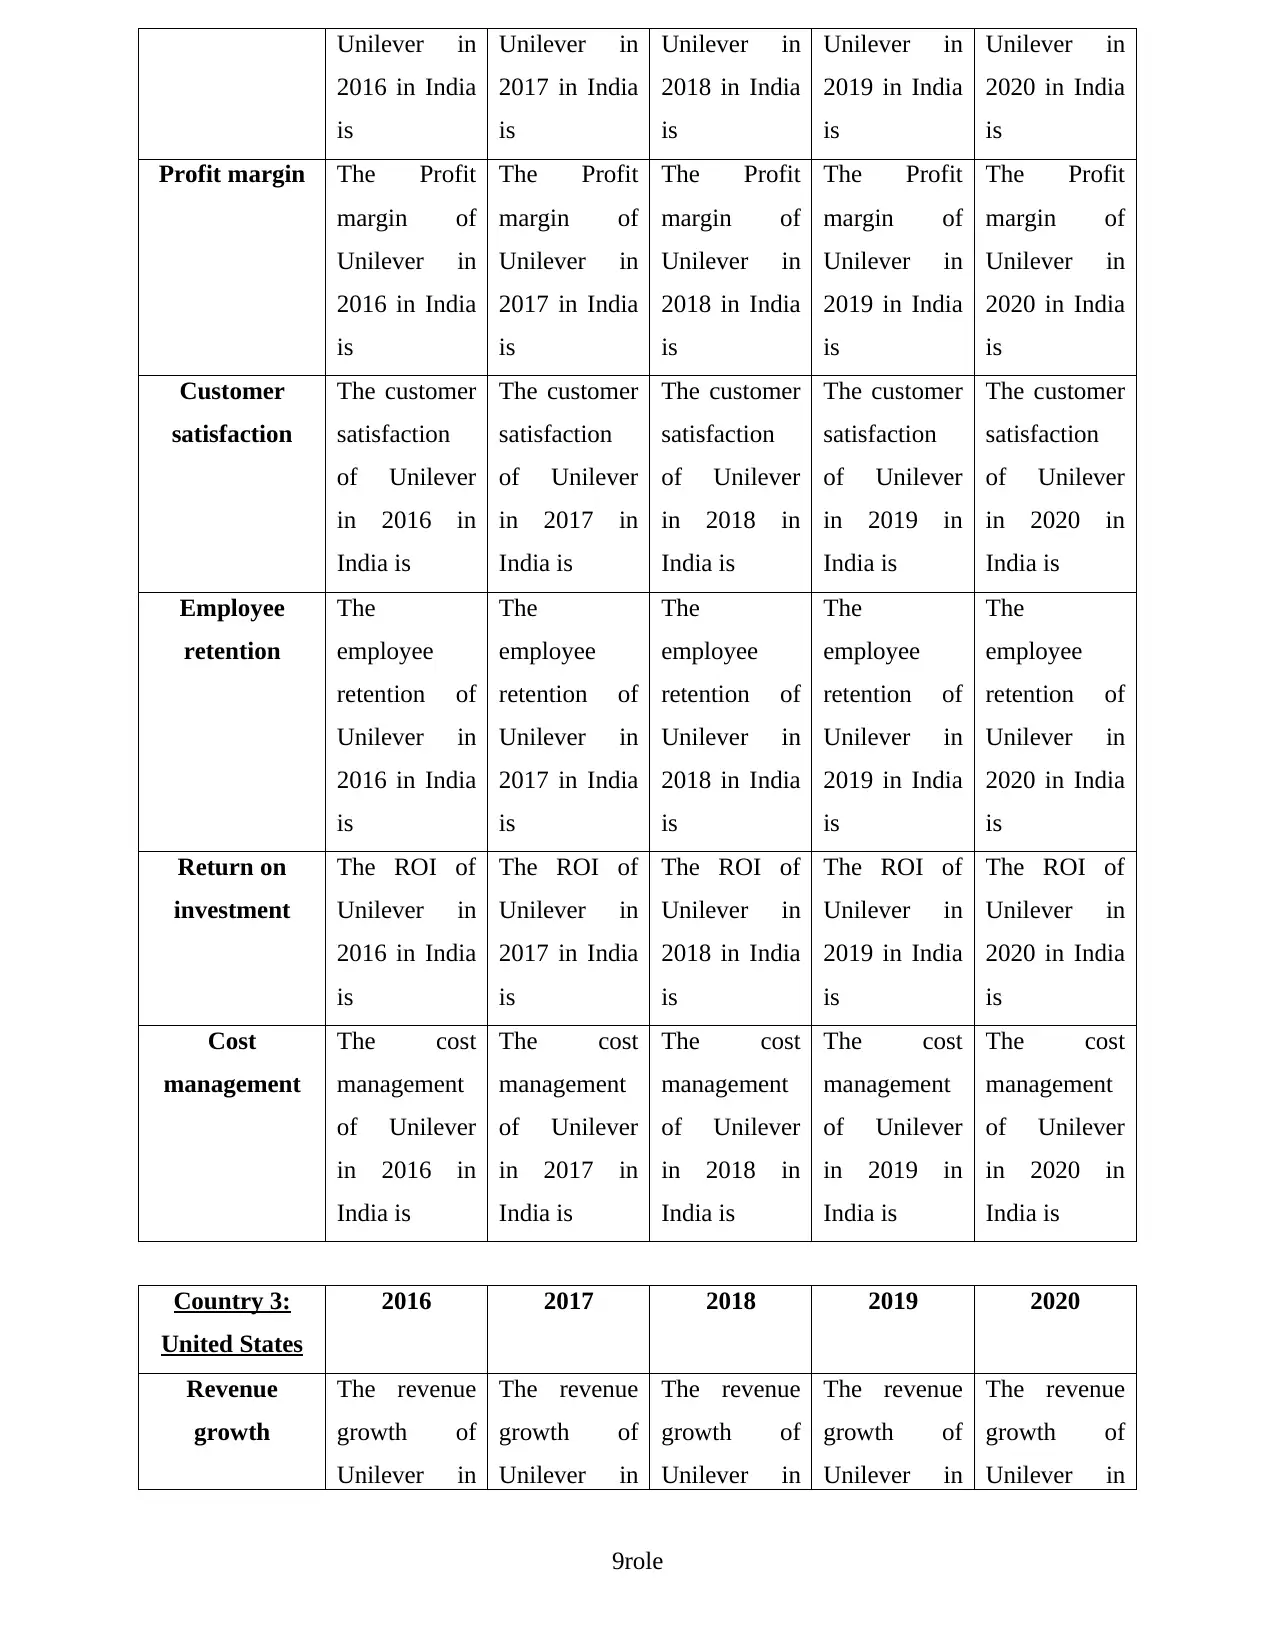
Unilever in
2016 in India
is
Unilever in
2017 in India
is
Unilever in
2018 in India
is
Unilever in
2019 in India
is
Unilever in
2020 in India
is
Profit margin The Profit
margin of
Unilever in
2016 in India
is
The Profit
margin of
Unilever in
2017 in India
is
The Profit
margin of
Unilever in
2018 in India
is
The Profit
margin of
Unilever in
2019 in India
is
The Profit
margin of
Unilever in
2020 in India
is
Customer
satisfaction
The customer
satisfaction
of Unilever
in 2016 in
India is
The customer
satisfaction
of Unilever
in 2017 in
India is
The customer
satisfaction
of Unilever
in 2018 in
India is
The customer
satisfaction
of Unilever
in 2019 in
India is
The customer
satisfaction
of Unilever
in 2020 in
India is
Employee
retention
The
employee
retention of
Unilever in
2016 in India
is
The
employee
retention of
Unilever in
2017 in India
is
The
employee
retention of
Unilever in
2018 in India
is
The
employee
retention of
Unilever in
2019 in India
is
The
employee
retention of
Unilever in
2020 in India
is
Return on
investment
The ROI of
Unilever in
2016 in India
is
The ROI of
Unilever in
2017 in India
is
The ROI of
Unilever in
2018 in India
is
The ROI of
Unilever in
2019 in India
is
The ROI of
Unilever in
2020 in India
is
Cost
management
The cost
management
of Unilever
in 2016 in
India is
The cost
management
of Unilever
in 2017 in
India is
The cost
management
of Unilever
in 2018 in
India is
The cost
management
of Unilever
in 2019 in
India is
The cost
management
of Unilever
in 2020 in
India is
Country 3:
United States
2016 2017 2018 2019 2020
Revenue
growth
The revenue
growth of
Unilever in
The revenue
growth of
Unilever in
The revenue
growth of
Unilever in
The revenue
growth of
Unilever in
The revenue
growth of
Unilever in
9role
2016 in India
is
Unilever in
2017 in India
is
Unilever in
2018 in India
is
Unilever in
2019 in India
is
Unilever in
2020 in India
is
Profit margin The Profit
margin of
Unilever in
2016 in India
is
The Profit
margin of
Unilever in
2017 in India
is
The Profit
margin of
Unilever in
2018 in India
is
The Profit
margin of
Unilever in
2019 in India
is
The Profit
margin of
Unilever in
2020 in India
is
Customer
satisfaction
The customer
satisfaction
of Unilever
in 2016 in
India is
The customer
satisfaction
of Unilever
in 2017 in
India is
The customer
satisfaction
of Unilever
in 2018 in
India is
The customer
satisfaction
of Unilever
in 2019 in
India is
The customer
satisfaction
of Unilever
in 2020 in
India is
Employee
retention
The
employee
retention of
Unilever in
2016 in India
is
The
employee
retention of
Unilever in
2017 in India
is
The
employee
retention of
Unilever in
2018 in India
is
The
employee
retention of
Unilever in
2019 in India
is
The
employee
retention of
Unilever in
2020 in India
is
Return on
investment
The ROI of
Unilever in
2016 in India
is
The ROI of
Unilever in
2017 in India
is
The ROI of
Unilever in
2018 in India
is
The ROI of
Unilever in
2019 in India
is
The ROI of
Unilever in
2020 in India
is
Cost
management
The cost
management
of Unilever
in 2016 in
India is
The cost
management
of Unilever
in 2017 in
India is
The cost
management
of Unilever
in 2018 in
India is
The cost
management
of Unilever
in 2019 in
India is
The cost
management
of Unilever
in 2020 in
India is
Country 3:
United States
2016 2017 2018 2019 2020
Revenue
growth
The revenue
growth of
Unilever in
The revenue
growth of
Unilever in
The revenue
growth of
Unilever in
The revenue
growth of
Unilever in
The revenue
growth of
Unilever in
9role
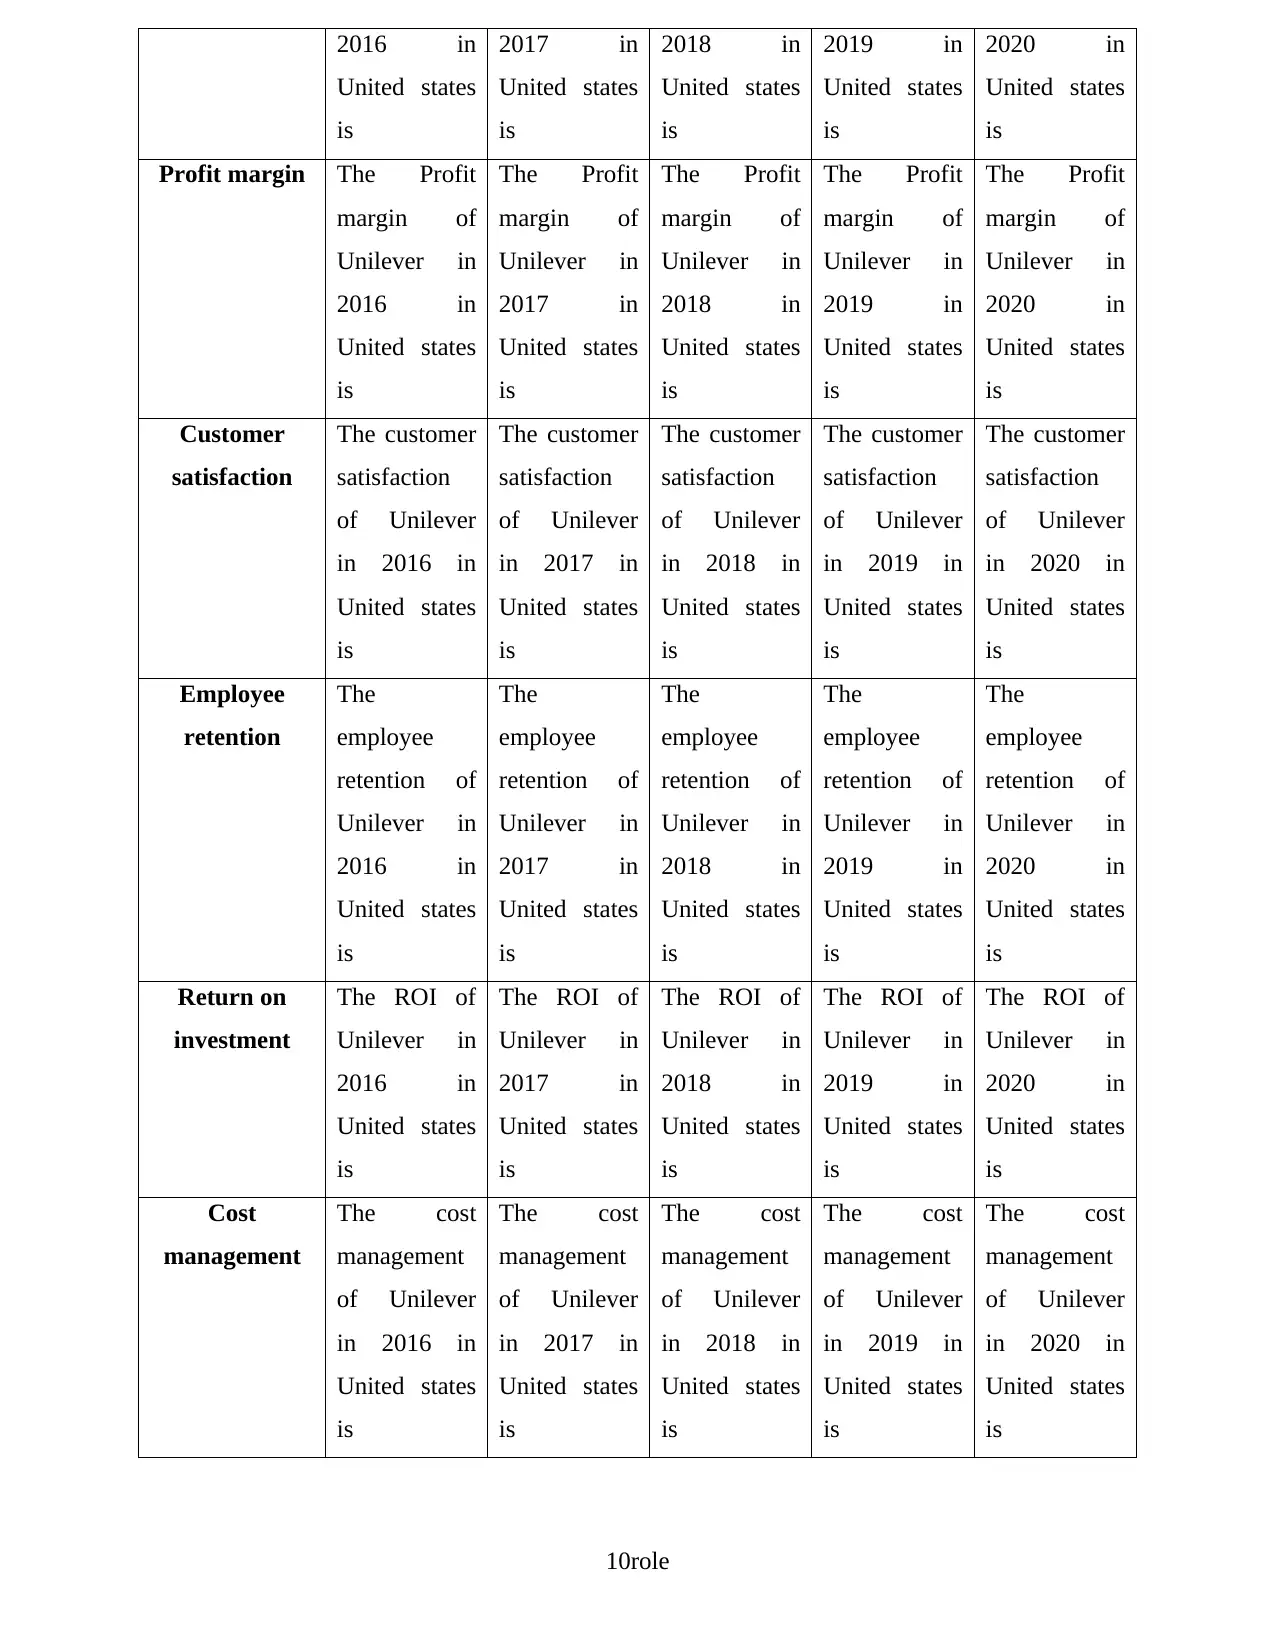
2016 in
United states
is
2017 in
United states
is
2018 in
United states
is
2019 in
United states
is
2020 in
United states
is
Profit margin The Profit
margin of
Unilever in
2016 in
United states
is
The Profit
margin of
Unilever in
2017 in
United states
is
The Profit
margin of
Unilever in
2018 in
United states
is
The Profit
margin of
Unilever in
2019 in
United states
is
The Profit
margin of
Unilever in
2020 in
United states
is
Customer
satisfaction
The customer
satisfaction
of Unilever
in 2016 in
United states
is
The customer
satisfaction
of Unilever
in 2017 in
United states
is
The customer
satisfaction
of Unilever
in 2018 in
United states
is
The customer
satisfaction
of Unilever
in 2019 in
United states
is
The customer
satisfaction
of Unilever
in 2020 in
United states
is
Employee
retention
The
employee
retention of
Unilever in
2016 in
United states
is
The
employee
retention of
Unilever in
2017 in
United states
is
The
employee
retention of
Unilever in
2018 in
United states
is
The
employee
retention of
Unilever in
2019 in
United states
is
The
employee
retention of
Unilever in
2020 in
United states
is
Return on
investment
The ROI of
Unilever in
2016 in
United states
is
The ROI of
Unilever in
2017 in
United states
is
The ROI of
Unilever in
2018 in
United states
is
The ROI of
Unilever in
2019 in
United states
is
The ROI of
Unilever in
2020 in
United states
is
Cost
management
The cost
management
of Unilever
in 2016 in
United states
is
The cost
management
of Unilever
in 2017 in
United states
is
The cost
management
of Unilever
in 2018 in
United states
is
The cost
management
of Unilever
in 2019 in
United states
is
The cost
management
of Unilever
in 2020 in
United states
is
10role
United states
is
2017 in
United states
is
2018 in
United states
is
2019 in
United states
is
2020 in
United states
is
Profit margin The Profit
margin of
Unilever in
2016 in
United states
is
The Profit
margin of
Unilever in
2017 in
United states
is
The Profit
margin of
Unilever in
2018 in
United states
is
The Profit
margin of
Unilever in
2019 in
United states
is
The Profit
margin of
Unilever in
2020 in
United states
is
Customer
satisfaction
The customer
satisfaction
of Unilever
in 2016 in
United states
is
The customer
satisfaction
of Unilever
in 2017 in
United states
is
The customer
satisfaction
of Unilever
in 2018 in
United states
is
The customer
satisfaction
of Unilever
in 2019 in
United states
is
The customer
satisfaction
of Unilever
in 2020 in
United states
is
Employee
retention
The
employee
retention of
Unilever in
2016 in
United states
is
The
employee
retention of
Unilever in
2017 in
United states
is
The
employee
retention of
Unilever in
2018 in
United states
is
The
employee
retention of
Unilever in
2019 in
United states
is
The
employee
retention of
Unilever in
2020 in
United states
is
Return on
investment
The ROI of
Unilever in
2016 in
United states
is
The ROI of
Unilever in
2017 in
United states
is
The ROI of
Unilever in
2018 in
United states
is
The ROI of
Unilever in
2019 in
United states
is
The ROI of
Unilever in
2020 in
United states
is
Cost
management
The cost
management
of Unilever
in 2016 in
United states
is
The cost
management
of Unilever
in 2017 in
United states
is
The cost
management
of Unilever
in 2018 in
United states
is
The cost
management
of Unilever
in 2019 in
United states
is
The cost
management
of Unilever
in 2020 in
United states
is
10role
⊘ This is a preview!⊘
Do you want full access?
Subscribe today to unlock all pages.
Trusted by 1+ million students worldwide
1 out of 13
Related Documents


Your All-in-One AI-Powered Toolkit for Academic Success.
+13062052269
info@desklib.com
Available 24*7 on WhatsApp / Email
![[object Object]](/_next/static/media/star-bottom.7253800d.svg)
Unlock your academic potential
Copyright © 2020–2026 A2Z Services. All Rights Reserved. Developed and managed by ZUCOL.