Business Research & Analysis: Unilever Financial Performance Report
VerifiedAdded on 2023/01/12
|17
|4088
|81
Report
AI Summary
This report provides a comprehensive financial analysis of Unilever, a leading FMCG company. It begins with an executive summary and an introduction to Unilever's business model and segment information. The core of the report focuses on financial statement analysis, utilizing the Gartner data analytics maturity model to evaluate Unilever's performance through ratio analysis. Various ratios, including profitability, liquidity, efficiency, capital structure, and investor KPIs, are calculated and assessed for two consecutive years. The report then explores the limitations of financial statement analysis and examines Unilever's integrated reporting practices. The conclusion summarizes the findings and offers recommendations. The analysis reveals insights into Unilever's financial health, identifying trends and areas of concern, such as declining profit margins and an increasing debt-to-equity ratio. Overall, the report provides a detailed examination of Unilever's financial performance, offering valuable insights for business analysis.
BUSINESS RESEARCH
&
ANALYSIS
&
ANALYSIS
Paraphrase This Document
Need a fresh take? Get an instant paraphrase of this document with our AI Paraphraser
Table of Contents
EXECUTIVE SUMMARY.............................................................................................................3
INTRODUCTION...........................................................................................................................4
Business model and segment information.......................................................................................4
Gartner data analytics maturity model stages through ratio analysis..............................................5
Descriptive Stage:........................................................................................................................6
1. Profitability and return ratios...............................................................................................6
2. Liquidity ratios.....................................................................................................................7
3. Efficiency ratio....................................................................................................................9
4. Capital structure ratios:......................................................................................................10
5. Investors KPI.....................................................................................................................11
Diagnostic stage.........................................................................................................................12
Predictive...................................................................................................................................13
Prescriptive................................................................................................................................13
Main limitation of financial statement analysis.............................................................................13
Company integrated reporting practices........................................................................................14
CONCLUSION..............................................................................................................................16
REFERENCES..............................................................................................................................17
EXECUTIVE SUMMARY
This project report consists of assessment of Unilever Company through evaluating segment
information of the firm. Financial statement analysis of Unilever consists of evaluation of
various ratios for two consecutive years such as profitability, liquidity, efficiency, capital
structure and investors KPI ratios. Four stages of data analytics maturity of garner will show
relationship between value and difficulty in performance. Integrated reporting practices with
context of Unilever have been discussed to analyze main capitals of company reports. All the
findings and solutions to the problem have been discussed in conclusion and recommendation
section of the report. Unilever is one of the leading FMCG (fast moving cosmetic goods)
company in UK; it has achieved 19.1% operating margin in 2019 and its turnover also get
increase by 2% to £52 billion.
⊘ This is a preview!⊘
Do you want full access?
Subscribe today to unlock all pages.
Trusted by 1+ million students worldwide
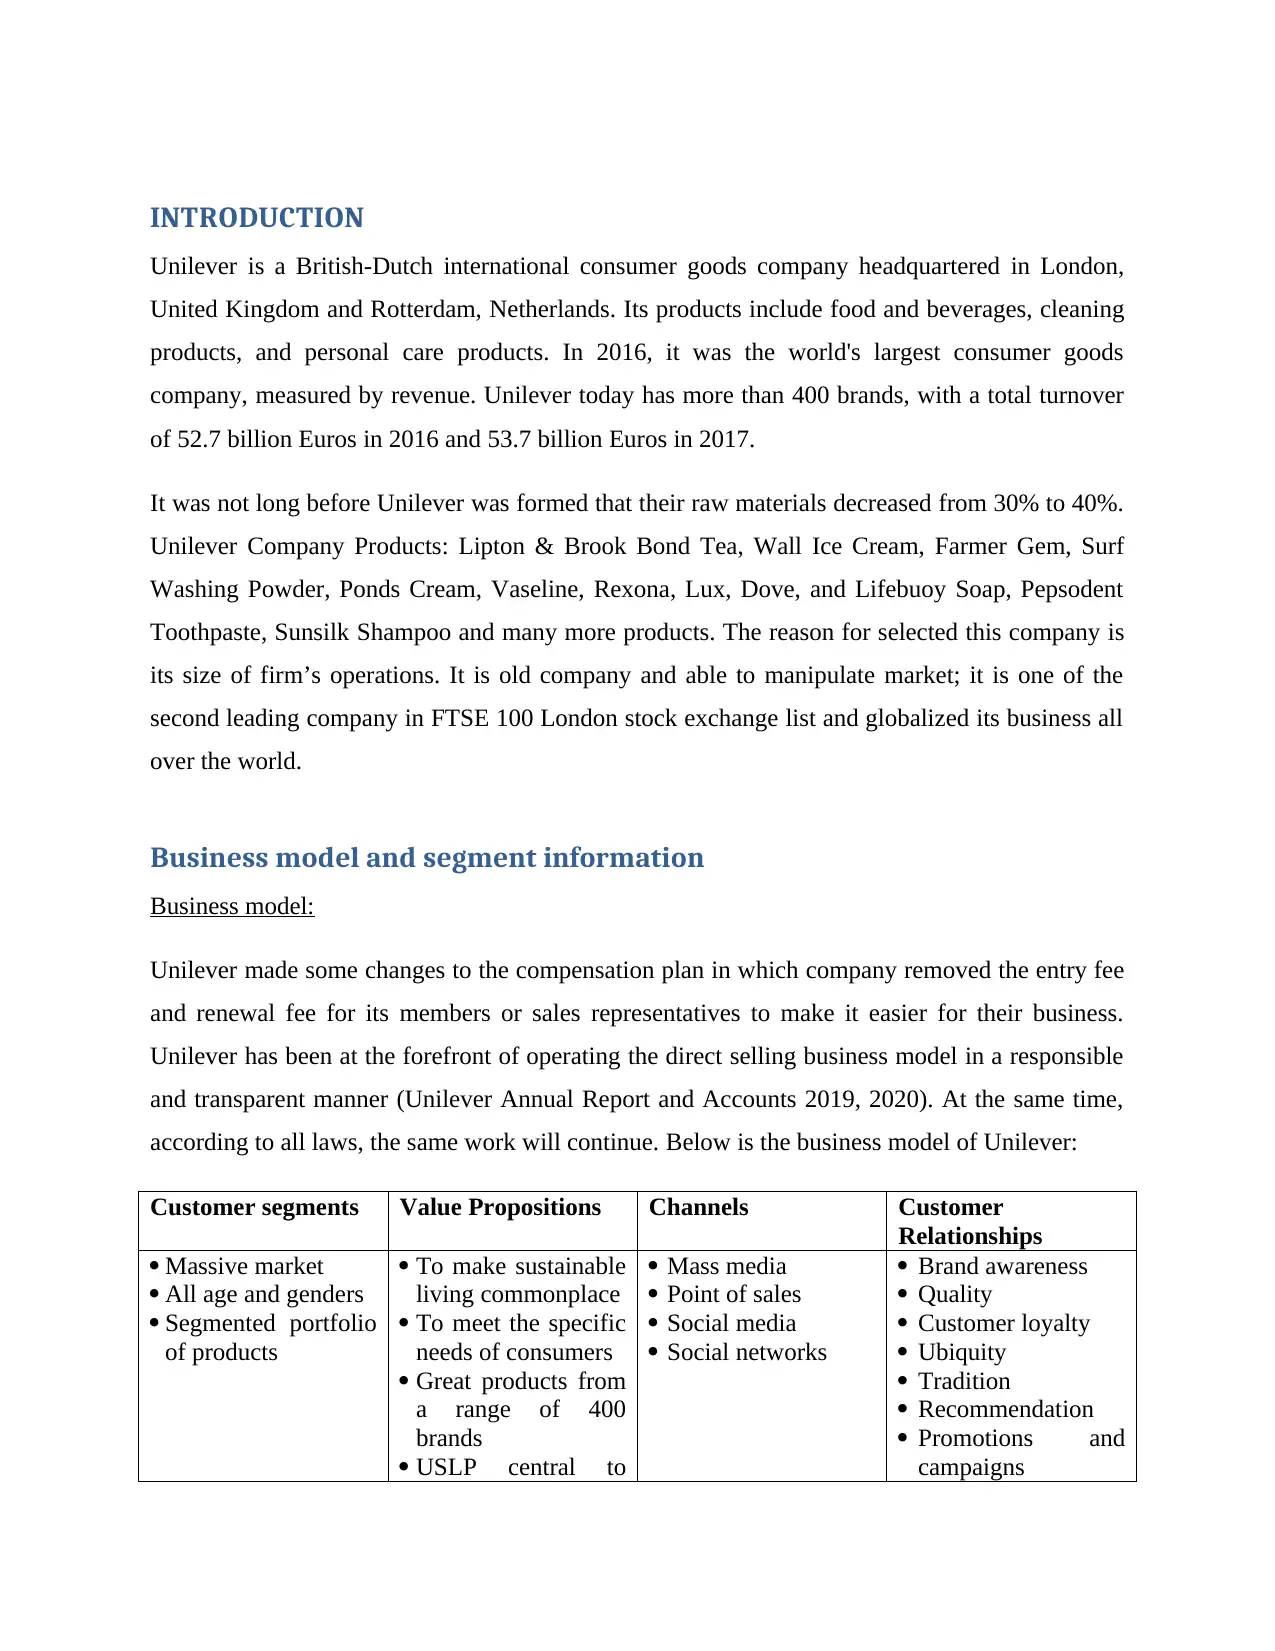
INTRODUCTION
Unilever is a British-Dutch international consumer goods company headquartered in London,
United Kingdom and Rotterdam, Netherlands. Its products include food and beverages, cleaning
products, and personal care products. In 2016, it was the world's largest consumer goods
company, measured by revenue. Unilever today has more than 400 brands, with a total turnover
of 52.7 billion Euros in 2016 and 53.7 billion Euros in 2017.
It was not long before Unilever was formed that their raw materials decreased from 30% to 40%.
Unilever Company Products: Lipton & Brook Bond Tea, Wall Ice Cream, Farmer Gem, Surf
Washing Powder, Ponds Cream, Vaseline, Rexona, Lux, Dove, and Lifebuoy Soap, Pepsodent
Toothpaste, Sunsilk Shampoo and many more products. The reason for selected this company is
its size of firm’s operations. It is old company and able to manipulate market; it is one of the
second leading company in FTSE 100 London stock exchange list and globalized its business all
over the world.
Business model and segment information
Business model:
Unilever made some changes to the compensation plan in which company removed the entry fee
and renewal fee for its members or sales representatives to make it easier for their business.
Unilever has been at the forefront of operating the direct selling business model in a responsible
and transparent manner (Unilever Annual Report and Accounts 2019, 2020). At the same time,
according to all laws, the same work will continue. Below is the business model of Unilever:
Customer segments Value Propositions Channels Customer
Relationships
Massive market
All age and genders
Segmented portfolio
of products
To make sustainable
living commonplace
To meet the specific
needs of consumers
Great products from
a range of 400
brands
USLP central to
Mass media
Point of sales
Social media
Social networks
Brand awareness
Quality
Customer loyalty
Ubiquity
Tradition
Recommendation
Promotions and
campaigns
Paraphrase This Document
Need a fresh take? Get an instant paraphrase of this document with our AI Paraphraser
business model to
provide sustainable
broad range of
projects.
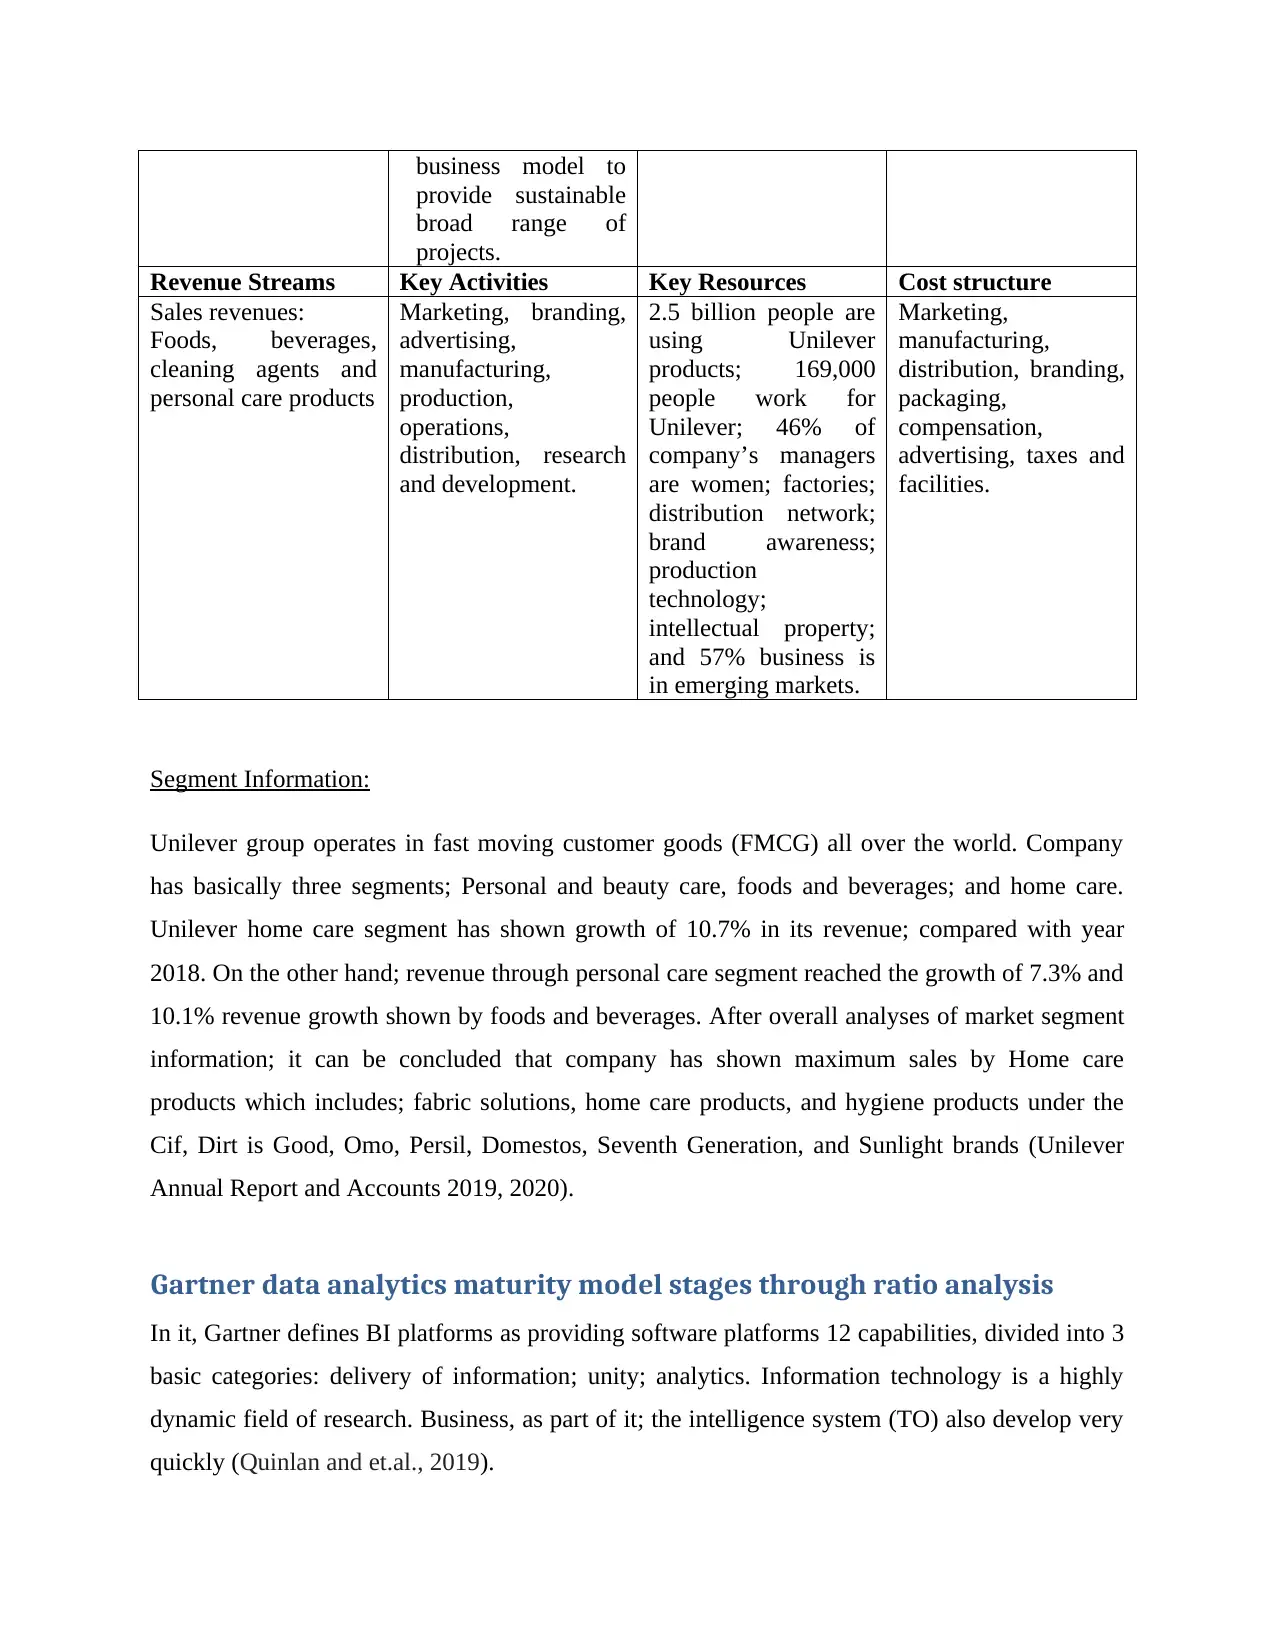
Revenue Streams Key Activities Key Resources Cost structure
Sales revenues:
Foods, beverages,
cleaning agents and
personal care products
Marketing, branding,
advertising,
manufacturing,
production,
operations,
distribution, research
and development.
2.5 billion people are
using Unilever
products; 169,000
people work for
Unilever; 46% of
company’s managers
are women; factories;
distribution network;
brand awareness;
production
technology;
intellectual property;
and 57% business is
in emerging markets.
Marketing,
manufacturing,
distribution, branding,
packaging,
compensation,
advertising, taxes and
facilities.
Segment Information:
Unilever group operates in fast moving customer goods (FMCG) all over the world. Company
has basically three segments; Personal and beauty care, foods and beverages; and home care.
Unilever home care segment has shown growth of 10.7% in its revenue; compared with year
2018. On the other hand; revenue through personal care segment reached the growth of 7.3% and
10.1% revenue growth shown by foods and beverages. After overall analyses of market segment
information; it can be concluded that company has shown maximum sales by Home care
products which includes; fabric solutions, home care products, and hygiene products under the
Cif, Dirt is Good, Omo, Persil, Domestos, Seventh Generation, and Sunlight brands (Unilever
Annual Report and Accounts 2019, 2020).
Gartner data analytics maturity model stages through ratio analysis
In it, Gartner defines BI platforms as providing software platforms 12 capabilities, divided into 3
basic categories: delivery of information; unity; analytics. Information technology is a highly
dynamic field of research. Business, as part of it; the intelligence system (TO) also develop very
quickly (Quinlan and et.al., 2019).
provide sustainable
broad range of
projects.
Revenue Streams Key Activities Key Resources Cost structure
Sales revenues:
Foods, beverages,
cleaning agents and
personal care products
Marketing, branding,
advertising,
manufacturing,
production,
operations,
distribution, research
and development.
2.5 billion people are
using Unilever
products; 169,000
people work for
Unilever; 46% of
company’s managers
are women; factories;
distribution network;
brand awareness;
production
technology;
intellectual property;
and 57% business is
in emerging markets.
Marketing,
manufacturing,
distribution, branding,
packaging,
compensation,
advertising, taxes and
facilities.
Segment Information:
Unilever group operates in fast moving customer goods (FMCG) all over the world. Company
has basically three segments; Personal and beauty care, foods and beverages; and home care.
Unilever home care segment has shown growth of 10.7% in its revenue; compared with year
2018. On the other hand; revenue through personal care segment reached the growth of 7.3% and
10.1% revenue growth shown by foods and beverages. After overall analyses of market segment
information; it can be concluded that company has shown maximum sales by Home care
products which includes; fabric solutions, home care products, and hygiene products under the
Cif, Dirt is Good, Omo, Persil, Domestos, Seventh Generation, and Sunlight brands (Unilever
Annual Report and Accounts 2019, 2020).
Gartner data analytics maturity model stages through ratio analysis
In it, Gartner defines BI platforms as providing software platforms 12 capabilities, divided into 3
basic categories: delivery of information; unity; analytics. Information technology is a highly
dynamic field of research. Business, as part of it; the intelligence system (TO) also develop very
quickly (Quinlan and et.al., 2019).
Descriptive Stage:
This analysis is done to know the financial performance of the company. In this method; two or
more than two years financial statement are compared on the basis of key performance indicators
that are ratio analysis:
1. Profitability and return ratios
Profitability ratios are a class of financial metrics used to assess a business's ability to generate
earnings compared to expenses incurred during a specific period and other relevant costs. For
most of these ratios, a high price to ratio of a competitor or relative to a similar ratio from the
previous period indicates that the company is doing well (Zikmund, Carr and Griffin, 2013).
Different profit margins are used to measure a company's profitability at different cost levels,
including gross margin, operating margin, pretax margin, and net profit margin. Margin
decreases as layers of additional costs are taken into account, such as cost of goods sold (COGS),
operations and expenses incurred and payment of taxes (Kothari and Ball, 1994).
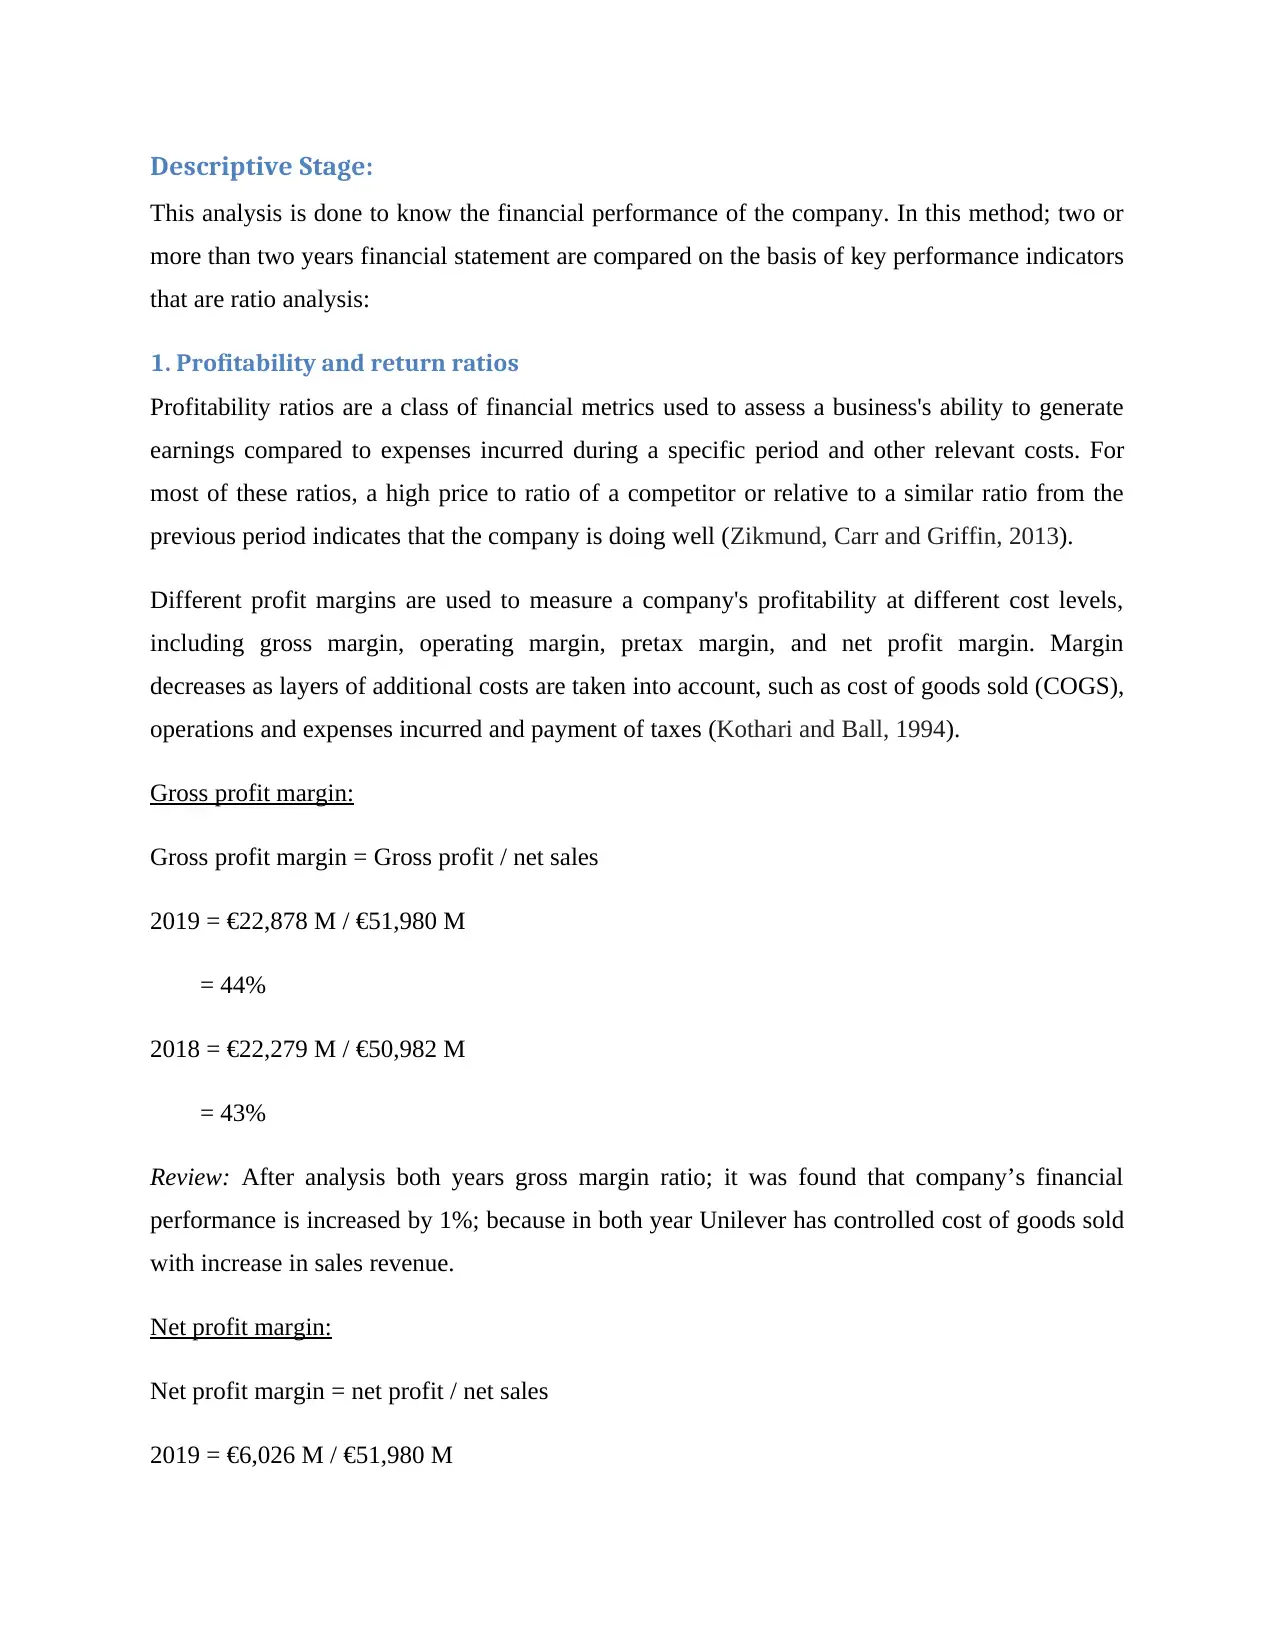
Gross profit margin:
Gross profit margin = Gross profit / net sales
2019 = €22,878 M / €51,980 M
= 44%
2018 = €22,279 M / €50,982 M
= 43%
Review: After analysis both years gross margin ratio; it was found that company’s financial
performance is increased by 1%; because in both year Unilever has controlled cost of goods sold
with increase in sales revenue.
Net profit margin:
Net profit margin = net profit / net sales
2019 = €6,026 M / €51,980 M
This analysis is done to know the financial performance of the company. In this method; two or
more than two years financial statement are compared on the basis of key performance indicators
that are ratio analysis:
1. Profitability and return ratios
Profitability ratios are a class of financial metrics used to assess a business's ability to generate
earnings compared to expenses incurred during a specific period and other relevant costs. For
most of these ratios, a high price to ratio of a competitor or relative to a similar ratio from the
previous period indicates that the company is doing well (Zikmund, Carr and Griffin, 2013).
Different profit margins are used to measure a company's profitability at different cost levels,
including gross margin, operating margin, pretax margin, and net profit margin. Margin
decreases as layers of additional costs are taken into account, such as cost of goods sold (COGS),
operations and expenses incurred and payment of taxes (Kothari and Ball, 1994).
Gross profit margin:
Gross profit margin = Gross profit / net sales
2019 = €22,878 M / €51,980 M
= 44%
2018 = €22,279 M / €50,982 M
= 43%
Review: After analysis both years gross margin ratio; it was found that company’s financial
performance is increased by 1%; because in both year Unilever has controlled cost of goods sold
with increase in sales revenue.
Net profit margin:
Net profit margin = net profit / net sales
2019 = €6,026 M / €51,980 M
⊘ This is a preview!⊘
Do you want full access?
Subscribe today to unlock all pages.
Trusted by 1+ million students worldwide
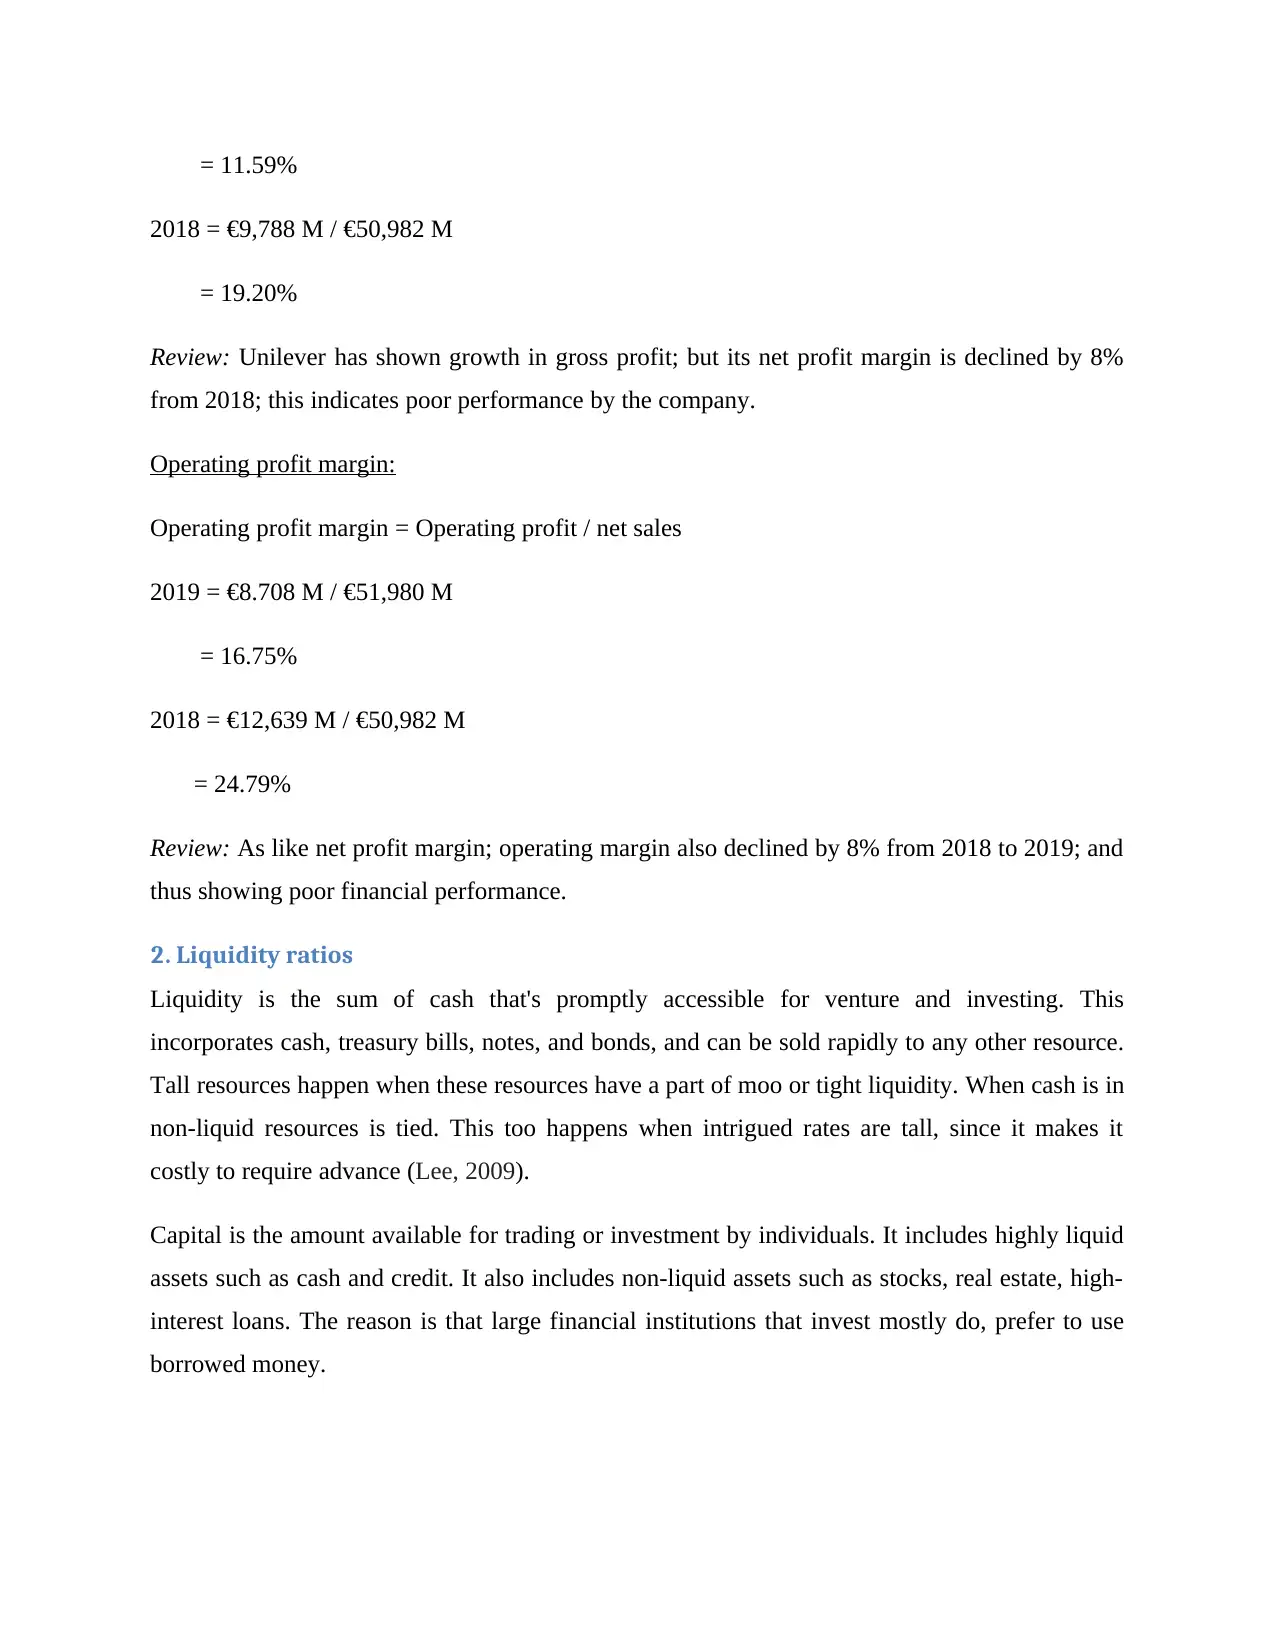
= 11.59%
2018 = €9,788 M / €50,982 M
= 19.20%
Review: Unilever has shown growth in gross profit; but its net profit margin is declined by 8%
from 2018; this indicates poor performance by the company.
Operating profit margin:
Operating profit margin = Operating profit / net sales
2019 = €8.708 M / €51,980 M
= 16.75%
2018 = €12,639 M / €50,982 M
= 24.79%
Review: As like net profit margin; operating margin also declined by 8% from 2018 to 2019; and
thus showing poor financial performance.
2. Liquidity ratios
Liquidity is the sum of cash that's promptly accessible for venture and investing. This
incorporates cash, treasury bills, notes, and bonds, and can be sold rapidly to any other resource.
Tall resources happen when these resources have a part of moo or tight liquidity. When cash is in
non-liquid resources is tied. This too happens when intrigued rates are tall, since it makes it
costly to require advance (Lee, 2009).
Capital is the amount available for trading or investment by individuals. It includes highly liquid
assets such as cash and credit. It also includes non-liquid assets such as stocks, real estate, high-
interest loans. The reason is that large financial institutions that invest mostly do, prefer to use
borrowed money.
Paraphrase This Document
Need a fresh take? Get an instant paraphrase of this document with our AI Paraphraser
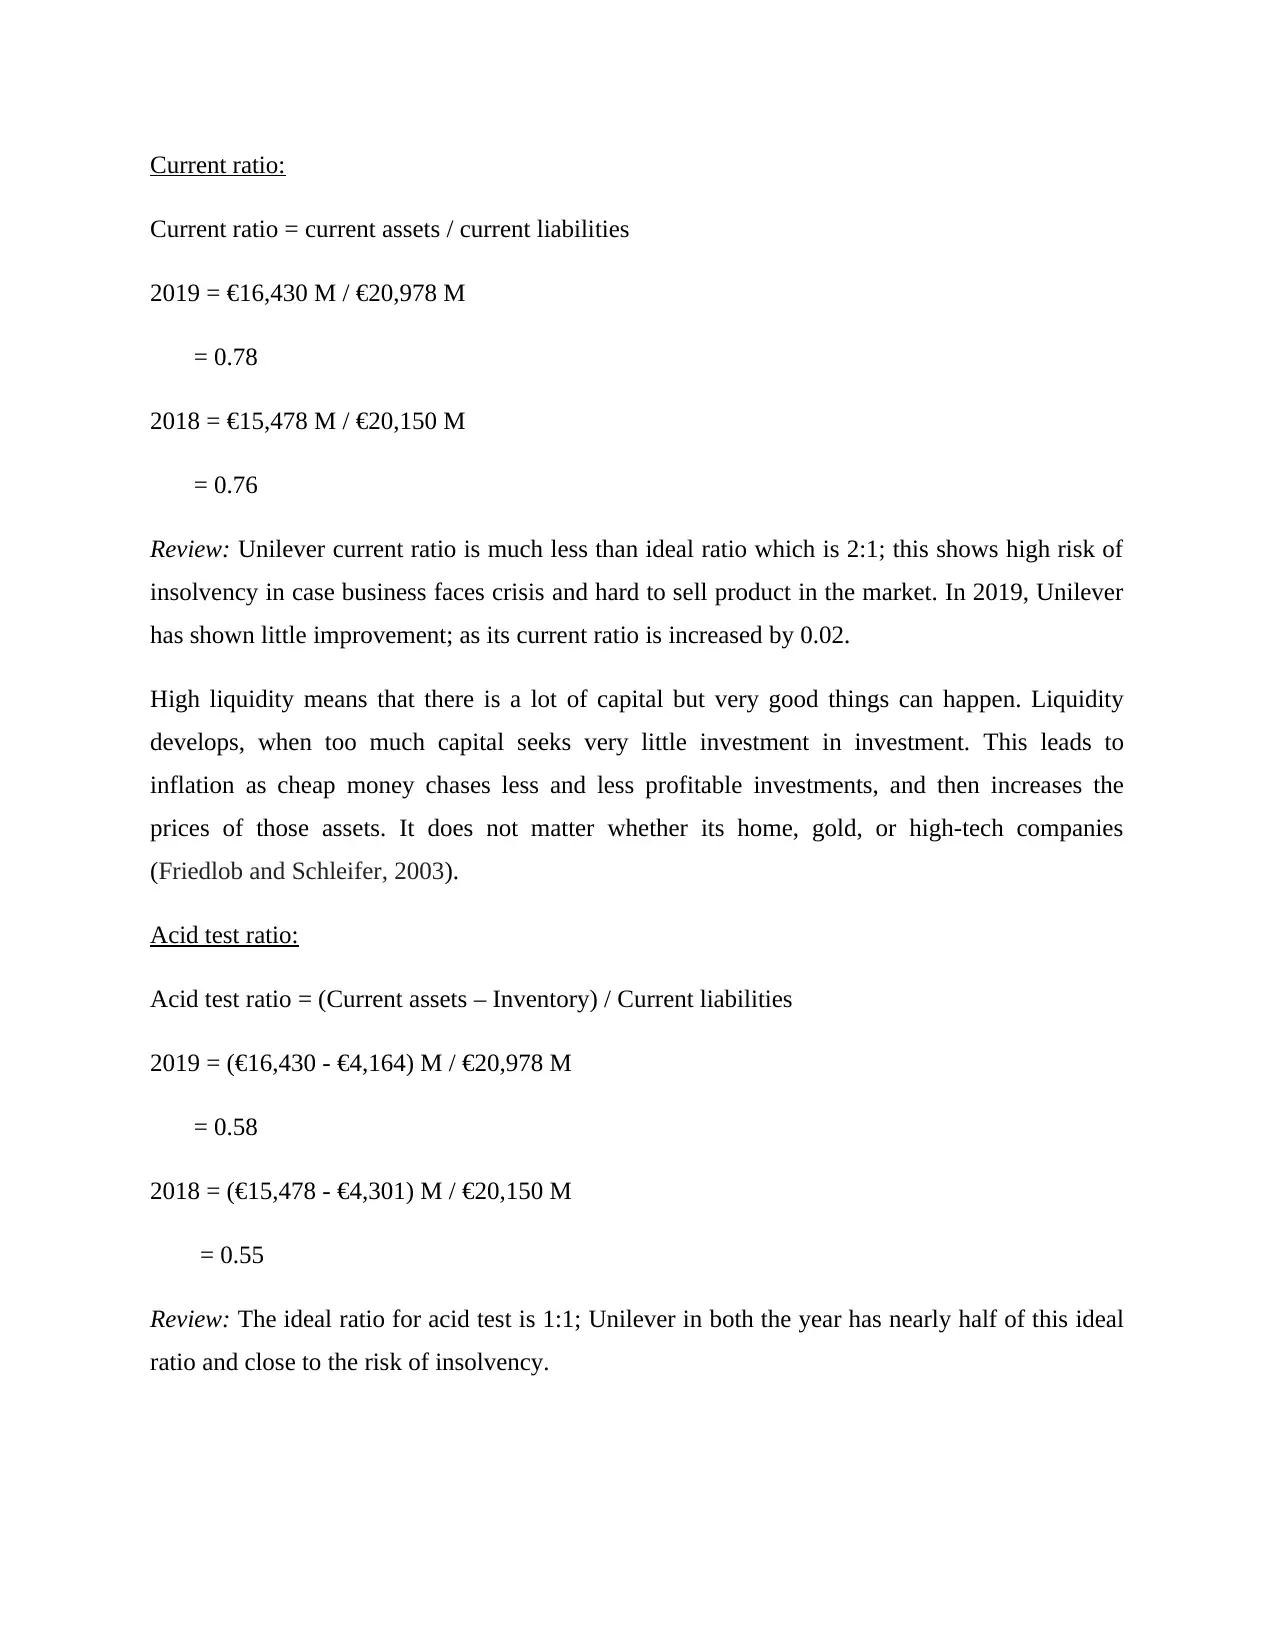
Current ratio:
Current ratio = current assets / current liabilities
2019 = €16,430 M / €20,978 M
= 0.78
2018 = €15,478 M / €20,150 M
= 0.76
Review: Unilever current ratio is much less than ideal ratio which is 2:1; this shows high risk of
insolvency in case business faces crisis and hard to sell product in the market. In 2019, Unilever
has shown little improvement; as its current ratio is increased by 0.02.
High liquidity means that there is a lot of capital but very good things can happen. Liquidity
develops, when too much capital seeks very little investment in investment. This leads to
inflation as cheap money chases less and less profitable investments, and then increases the
prices of those assets. It does not matter whether its home, gold, or high-tech companies
(Friedlob and Schleifer, 2003).
Acid test ratio:
Acid test ratio = (Current assets – Inventory) / Current liabilities
2019 = (€16,430 - €4,164) M / €20,978 M
= 0.58
2018 = (€15,478 - €4,301) M / €20,150 M
= 0.55
Review: The ideal ratio for acid test is 1:1; Unilever in both the year has nearly half of this ideal
ratio and close to the risk of insolvency.
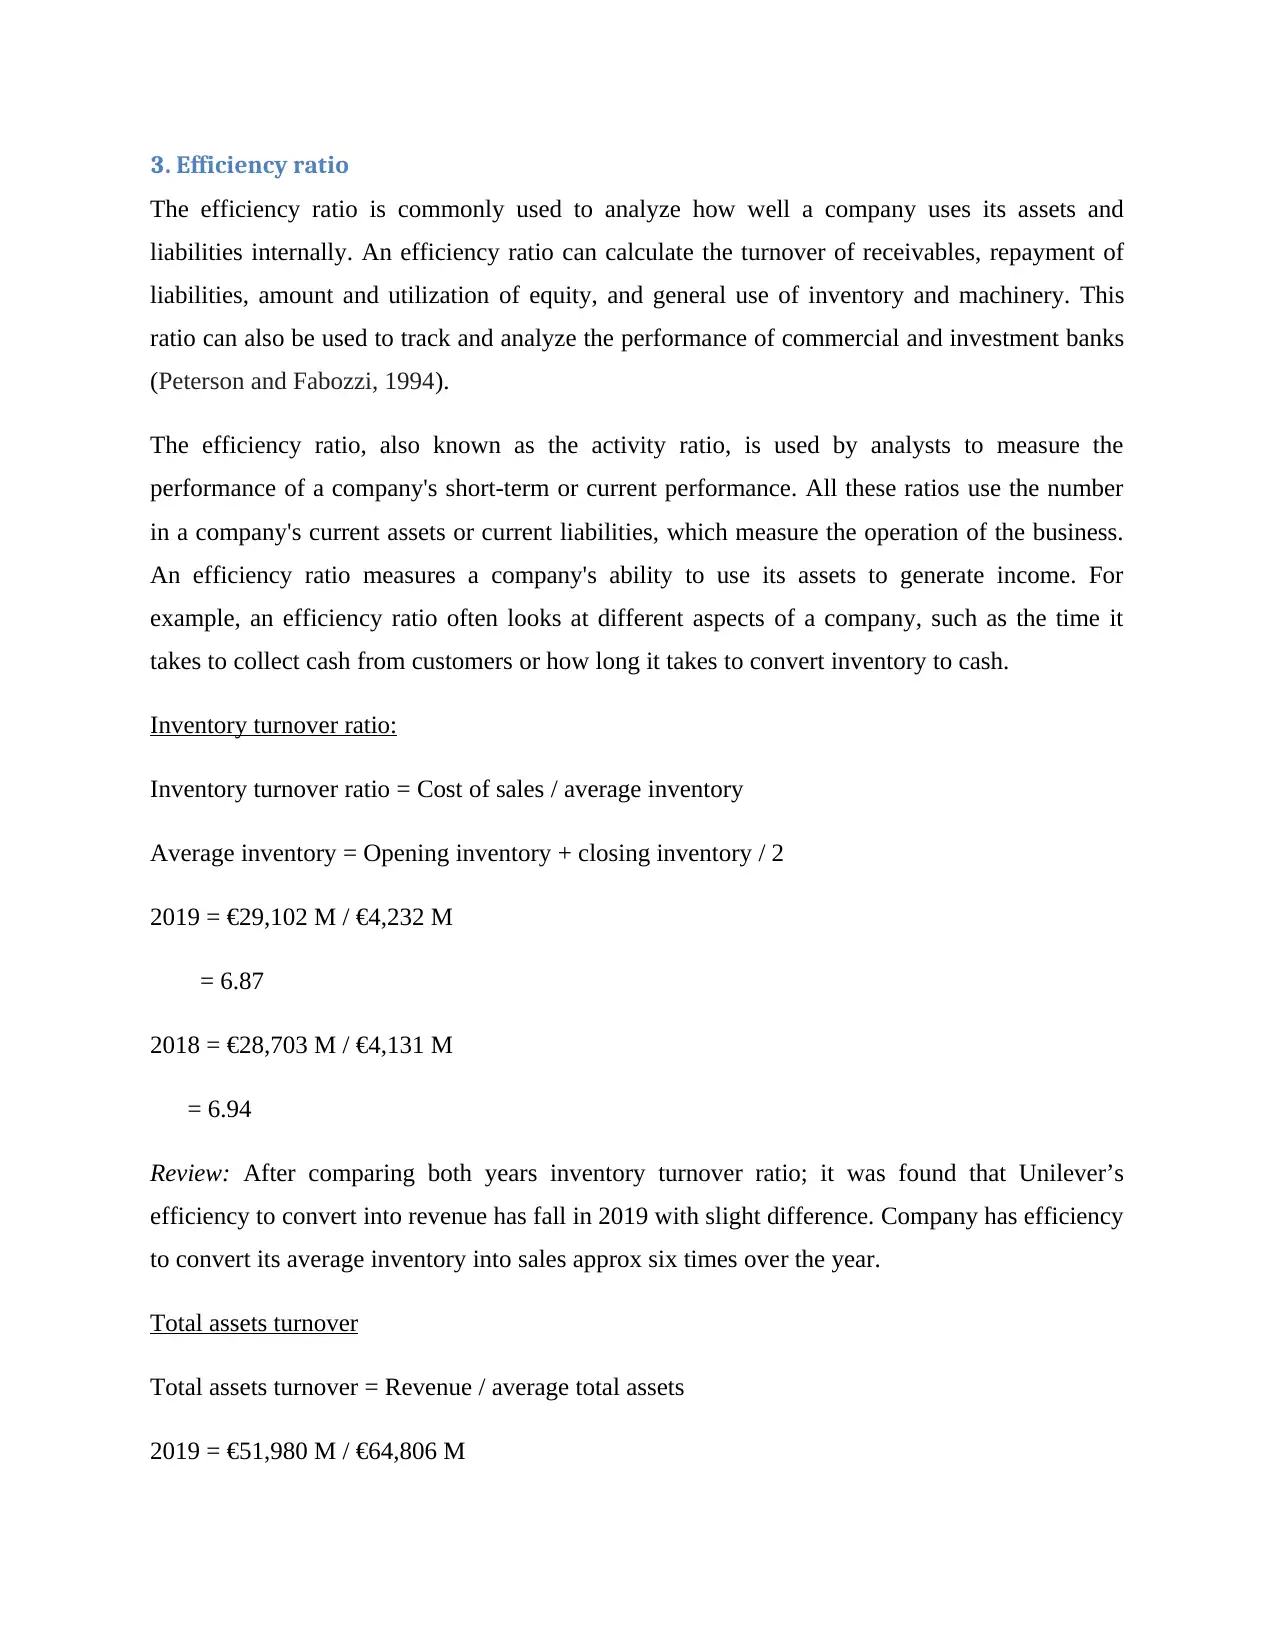
3. Efficiency ratio
The efficiency ratio is commonly used to analyze how well a company uses its assets and
liabilities internally. An efficiency ratio can calculate the turnover of receivables, repayment of
liabilities, amount and utilization of equity, and general use of inventory and machinery. This
ratio can also be used to track and analyze the performance of commercial and investment banks
(Peterson and Fabozzi, 1994).
The efficiency ratio, also known as the activity ratio, is used by analysts to measure the
performance of a company's short-term or current performance. All these ratios use the number
in a company's current assets or current liabilities, which measure the operation of the business.
An efficiency ratio measures a company's ability to use its assets to generate income. For
example, an efficiency ratio often looks at different aspects of a company, such as the time it
takes to collect cash from customers or how long it takes to convert inventory to cash.
Inventory turnover ratio:
Inventory turnover ratio = Cost of sales / average inventory
Average inventory = Opening inventory + closing inventory / 2
2019 = €29,102 M / €4,232 M
= 6.87
2018 = €28,703 M / €4,131 M
= 6.94
Review: After comparing both years inventory turnover ratio; it was found that Unilever’s
efficiency to convert into revenue has fall in 2019 with slight difference. Company has efficiency
to convert its average inventory into sales approx six times over the year.
Total assets turnover
Total assets turnover = Revenue / average total assets
2019 = €51,980 M / €64,806 M
⊘ This is a preview!⊘
Do you want full access?
Subscribe today to unlock all pages.
Trusted by 1+ million students worldwide
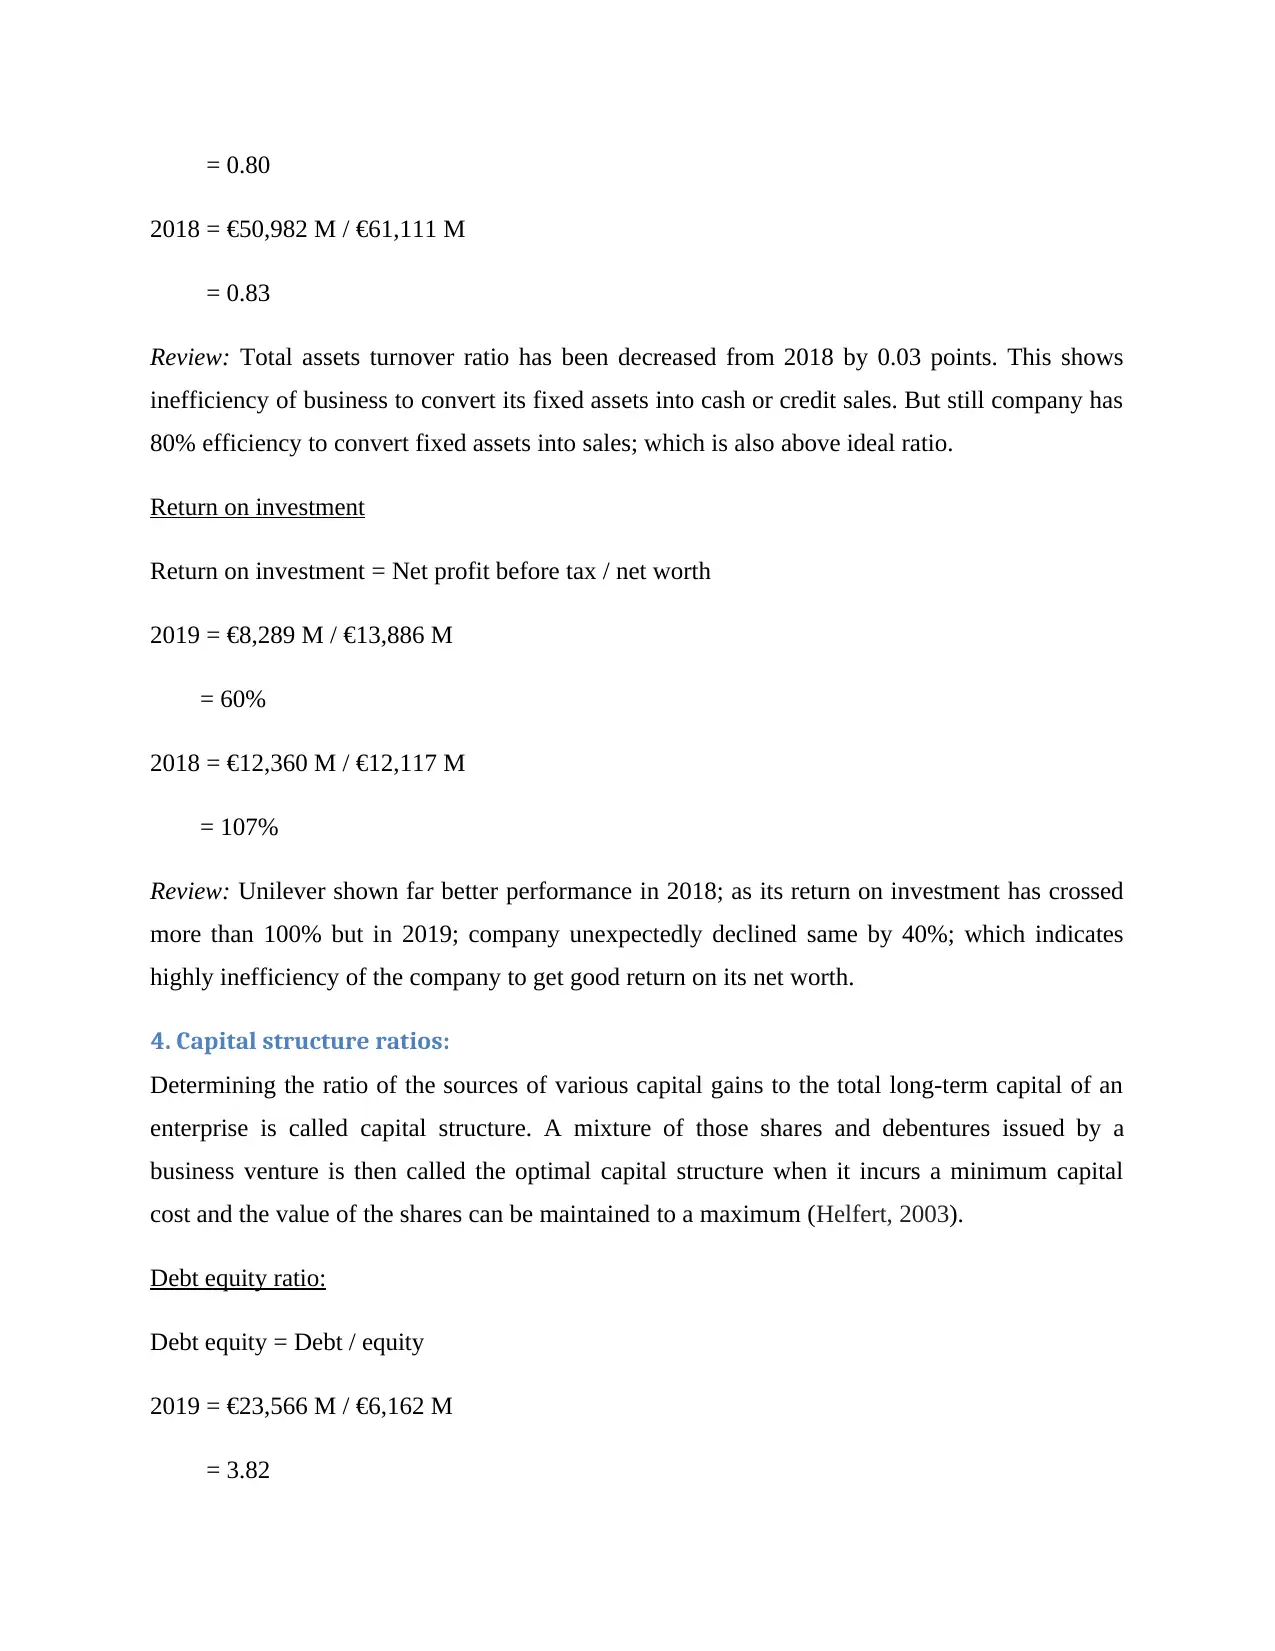
= 0.80
2018 = €50,982 M / €61,111 M
= 0.83
Review: Total assets turnover ratio has been decreased from 2018 by 0.03 points. This shows
inefficiency of business to convert its fixed assets into cash or credit sales. But still company has
80% efficiency to convert fixed assets into sales; which is also above ideal ratio.
Return on investment
Return on investment = Net profit before tax / net worth
2019 = €8,289 M / €13,886 M
= 60%
2018 = €12,360 M / €12,117 M
= 107%
Review: Unilever shown far better performance in 2018; as its return on investment has crossed
more than 100% but in 2019; company unexpectedly declined same by 40%; which indicates
highly inefficiency of the company to get good return on its net worth.
4. Capital structure ratios:
Determining the ratio of the sources of various capital gains to the total long-term capital of an
enterprise is called capital structure. A mixture of those shares and debentures issued by a
business venture is then called the optimal capital structure when it incurs a minimum capital
cost and the value of the shares can be maintained to a maximum (Helfert, 2003).
Debt equity ratio:
Debt equity = Debt / equity
2019 = €23,566 M / €6,162 M
= 3.82
Paraphrase This Document
Need a fresh take? Get an instant paraphrase of this document with our AI Paraphraser
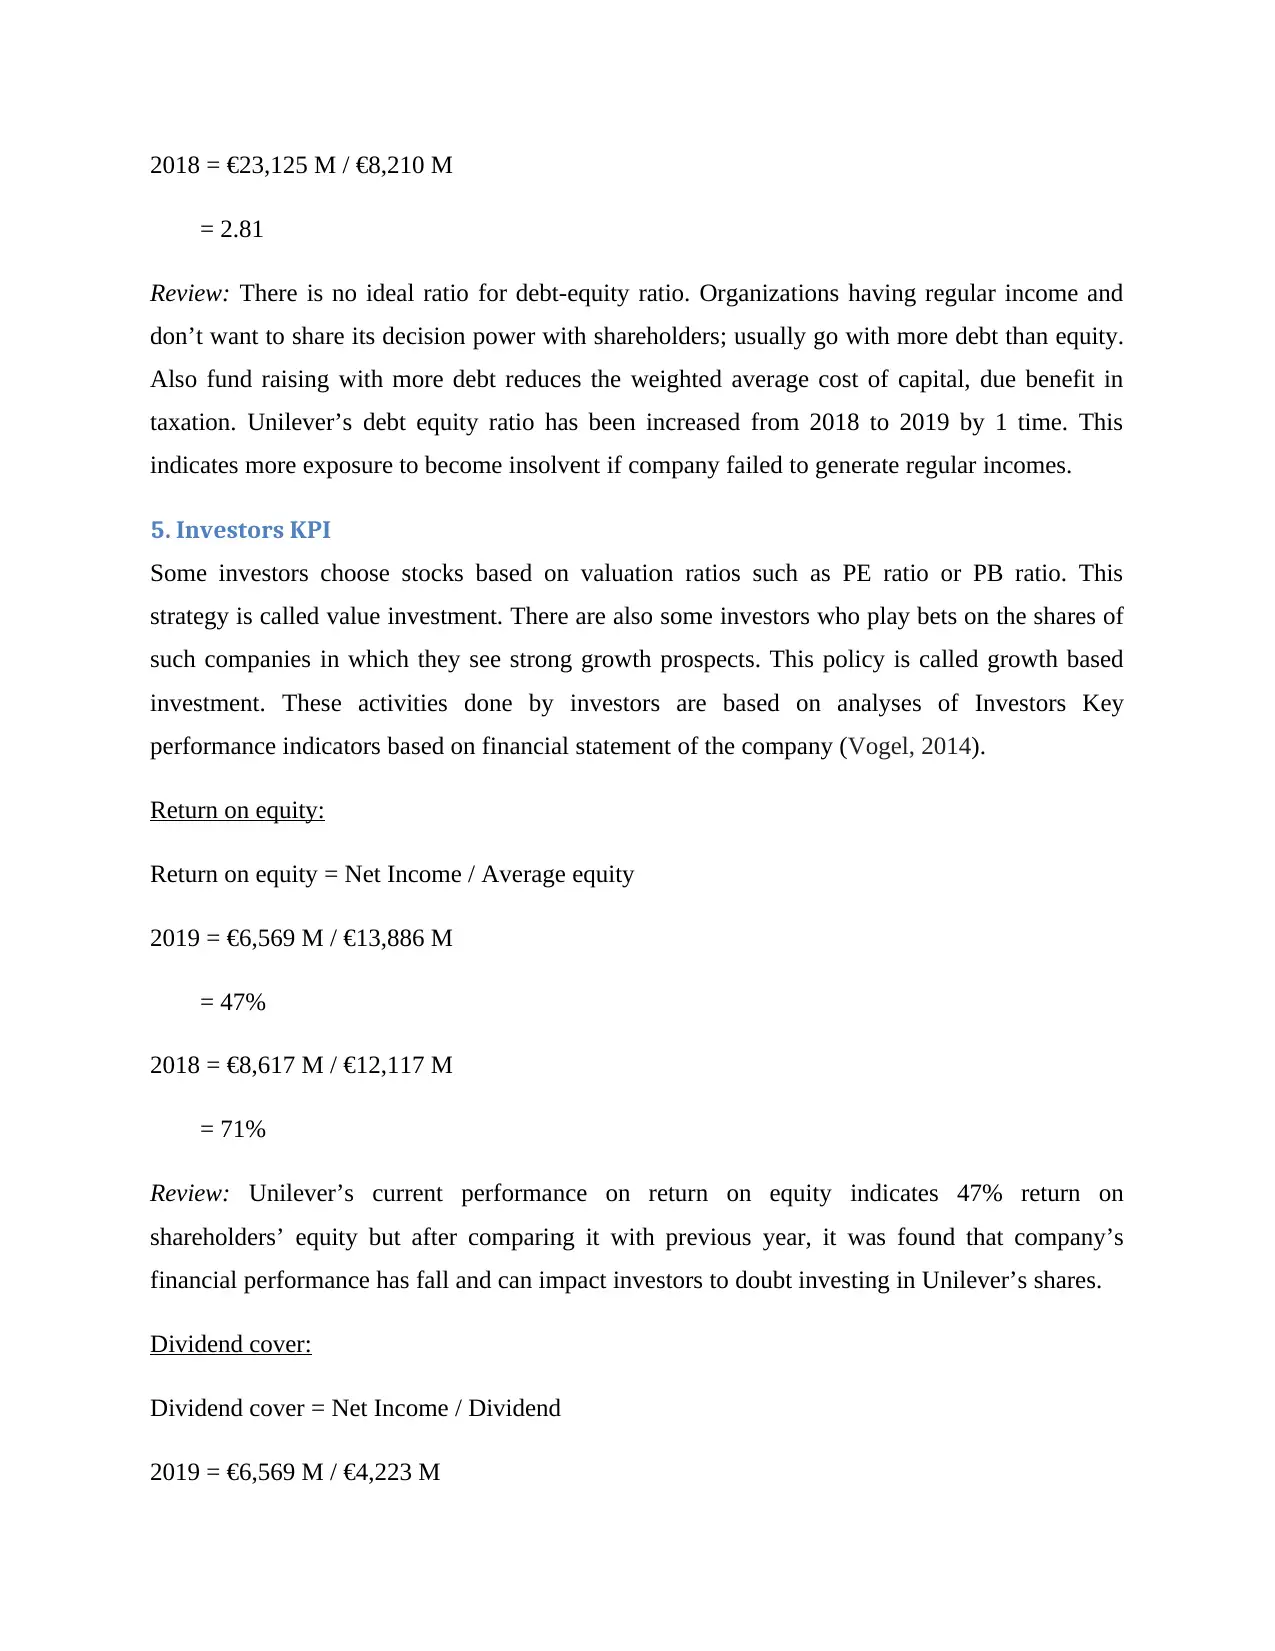
2018 = €23,125 M / €8,210 M
= 2.81
Review: There is no ideal ratio for debt-equity ratio. Organizations having regular income and
don’t want to share its decision power with shareholders; usually go with more debt than equity.
Also fund raising with more debt reduces the weighted average cost of capital, due benefit in
taxation. Unilever’s debt equity ratio has been increased from 2018 to 2019 by 1 time. This
indicates more exposure to become insolvent if company failed to generate regular incomes.
5. Investors KPI
Some investors choose stocks based on valuation ratios such as PE ratio or PB ratio. This
strategy is called value investment. There are also some investors who play bets on the shares of
such companies in which they see strong growth prospects. This policy is called growth based
investment. These activities done by investors are based on analyses of Investors Key
performance indicators based on financial statement of the company (Vogel, 2014).
Return on equity:
Return on equity = Net Income / Average equity
2019 = €6,569 M / €13,886 M
= 47%
2018 = €8,617 M / €12,117 M
= 71%
Review: Unilever’s current performance on return on equity indicates 47% return on
shareholders’ equity but after comparing it with previous year, it was found that company’s
financial performance has fall and can impact investors to doubt investing in Unilever’s shares.
Dividend cover:
Dividend cover = Net Income / Dividend
2019 = €6,569 M / €4,223 M
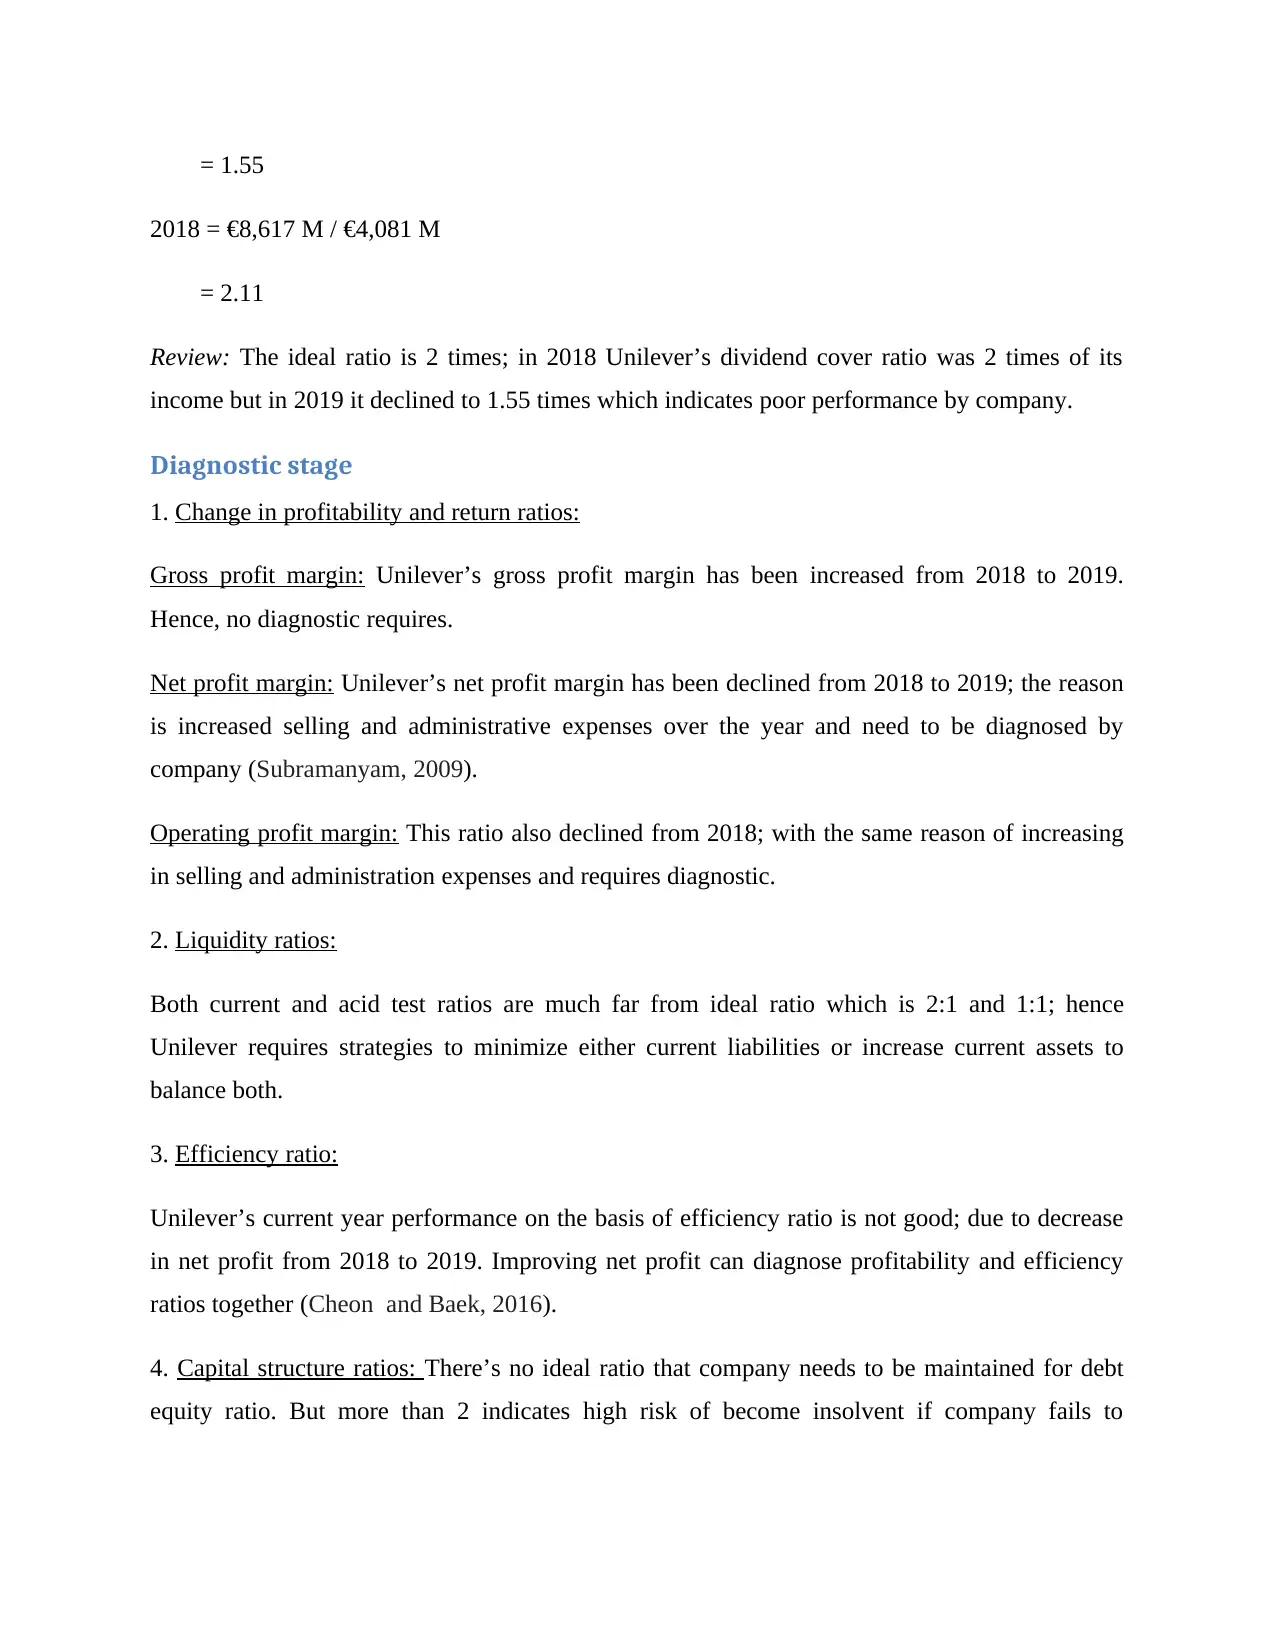
= 1.55
2018 = €8,617 M / €4,081 M
= 2.11
Review: The ideal ratio is 2 times; in 2018 Unilever’s dividend cover ratio was 2 times of its
income but in 2019 it declined to 1.55 times which indicates poor performance by company.
Diagnostic stage
1. Change in profitability and return ratios:
Gross profit margin: Unilever’s gross profit margin has been increased from 2018 to 2019.
Hence, no diagnostic requires.
Net profit margin: Unilever’s net profit margin has been declined from 2018 to 2019; the reason
is increased selling and administrative expenses over the year and need to be diagnosed by
company (Subramanyam, 2009).
Operating profit margin: This ratio also declined from 2018; with the same reason of increasing
in selling and administration expenses and requires diagnostic.
2. Liquidity ratios:
Both current and acid test ratios are much far from ideal ratio which is 2:1 and 1:1; hence
Unilever requires strategies to minimize either current liabilities or increase current assets to
balance both.
3. Efficiency ratio:
Unilever’s current year performance on the basis of efficiency ratio is not good; due to decrease
in net profit from 2018 to 2019. Improving net profit can diagnose profitability and efficiency
ratios together (Cheon and Baek, 2016).
4. Capital structure ratios: There’s no ideal ratio that company needs to be maintained for debt
equity ratio. But more than 2 indicates high risk of become insolvent if company fails to
⊘ This is a preview!⊘
Do you want full access?
Subscribe today to unlock all pages.
Trusted by 1+ million students worldwide
1 out of 17
Related Documents


Your All-in-One AI-Powered Toolkit for Academic Success.
+13062052269
info@desklib.com
Available 24*7 on WhatsApp / Email
![[object Object]](/_next/static/media/star-bottom.7253800d.svg)
Unlock your academic potential
Copyright © 2020–2026 A2Z Services. All Rights Reserved. Developed and managed by ZUCOL.