Project Report: Unilever Financial Analysis and Performance
VerifiedAdded on 2020/04/15
|25
|7118
|47
Project
AI Summary
This project report provides a comprehensive financial analysis of Unilever N.V., a leading consumer goods company. The report examines Unilever's financial statements from 2014 to 2016, including income statements, balance sheets, and cash flow statements. It utilizes various financial analysis techniques such as trend analysis and vertical analysis to evaluate the company's performance, profitability, and stability. The analysis covers key financial metrics like revenue, net income, earnings per share, assets, liabilities, and shareholder equity. The report highlights significant changes and trends, such as revenue fluctuations, expense management, and the impact on profitability and shareholder equity. The study aims to assess Unilever's financial position and offer insights into its strategic decisions and overall financial health, ultimately determining how financial accounting and management can improve the company's choices.
Running Head: International Management
1
Project Report: International Management
1
Project Report: International Management
Paraphrase This Document
Need a fresh take? Get an instant paraphrase of this document with our AI Paraphraser
International Management
2
Contents
Introduction.......................................................................................................................3
Company and industry overview......................................................................................3
Financial Analysis............................................................................................................4
Evaluation of financial performance................................................................................9
Strategies.........................................................................................................................11
Recommendation and Conclusion..................................................................................15
References.......................................................................................................................16
Appendix.........................................................................................................................18
International Management
3
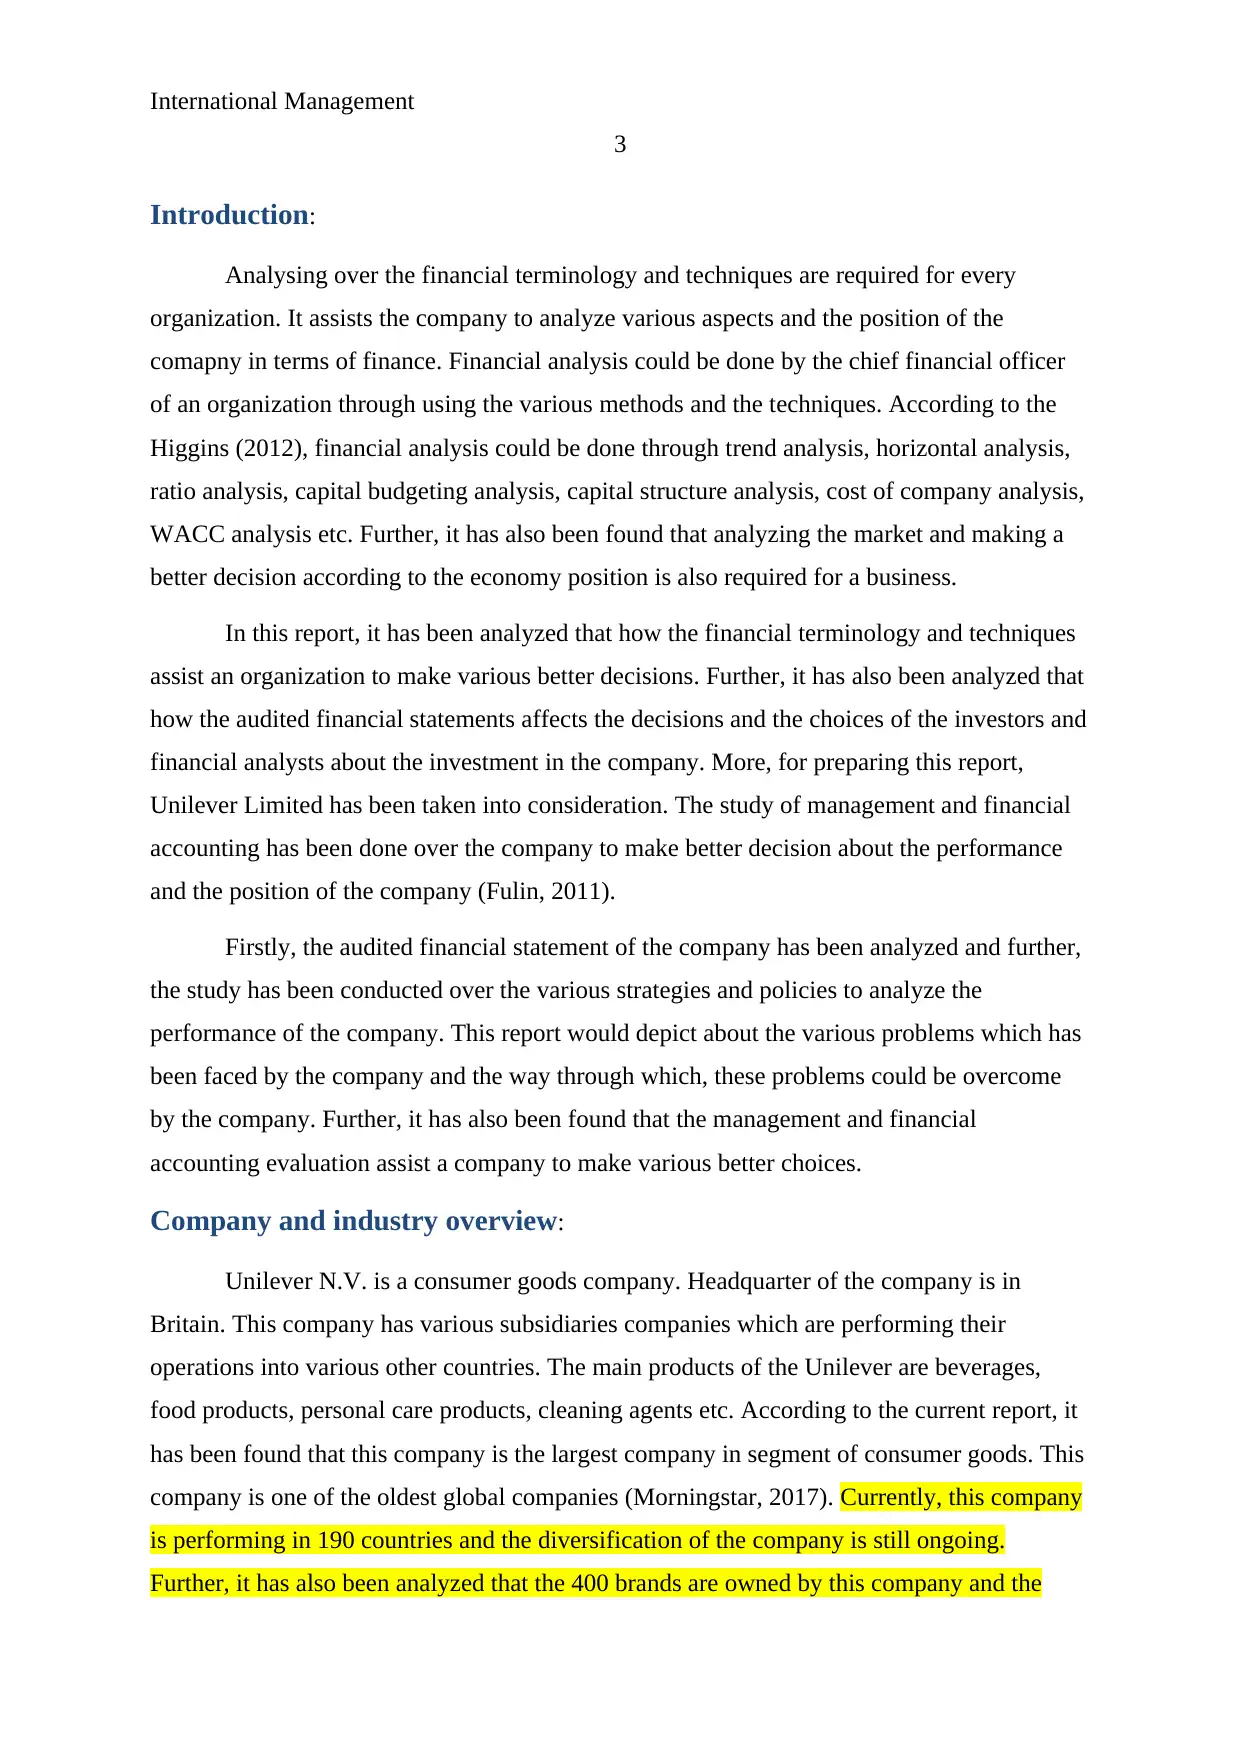
Introduction:
Analysing over the financial terminology and techniques are required for every
organization. It assists the company to analyze various aspects and the position of the
comapny in terms of finance. Financial analysis could be done by the chief financial officer
of an organization through using the various methods and the techniques. According to the
Higgins (2012), financial analysis could be done through trend analysis, horizontal analysis,
ratio analysis, capital budgeting analysis, capital structure analysis, cost of company analysis,
WACC analysis etc. Further, it has also been found that analyzing the market and making a
better decision according to the economy position is also required for a business.
In this report, it has been analyzed that how the financial terminology and techniques
assist an organization to make various better decisions. Further, it has also been analyzed that
how the audited financial statements affects the decisions and the choices of the investors and
financial analysts about the investment in the company. More, for preparing this report,
Unilever Limited has been taken into consideration. The study of management and financial
accounting has been done over the company to make better decision about the performance
and the position of the company (Fulin, 2011).
Firstly, the audited financial statement of the company has been analyzed and further,
the study has been conducted over the various strategies and policies to analyze the
performance of the company. This report would depict about the various problems which has
been faced by the company and the way through which, these problems could be overcome
by the company. Further, it has also been found that the management and financial
accounting evaluation assist a company to make various better choices.
Company and industry overview:
Unilever N.V. is a consumer goods company. Headquarter of the company is in
Britain. This company has various subsidiaries companies which are performing their
operations into various other countries. The main products of the Unilever are beverages,
food products, personal care products, cleaning agents etc. According to the current report, it
has been found that this company is the largest company in segment of consumer goods. This
company is one of the oldest global companies (Morningstar, 2017). Currently, this company
is performing in 190 countries and the diversification of the company is still ongoing.
Further, it has also been analyzed that the 400 brands are owned by this company and the
3
Introduction:
Analysing over the financial terminology and techniques are required for every
organization. It assists the company to analyze various aspects and the position of the
comapny in terms of finance. Financial analysis could be done by the chief financial officer
of an organization through using the various methods and the techniques. According to the
Higgins (2012), financial analysis could be done through trend analysis, horizontal analysis,
ratio analysis, capital budgeting analysis, capital structure analysis, cost of company analysis,
WACC analysis etc. Further, it has also been found that analyzing the market and making a
better decision according to the economy position is also required for a business.
In this report, it has been analyzed that how the financial terminology and techniques
assist an organization to make various better decisions. Further, it has also been analyzed that
how the audited financial statements affects the decisions and the choices of the investors and
financial analysts about the investment in the company. More, for preparing this report,
Unilever Limited has been taken into consideration. The study of management and financial
accounting has been done over the company to make better decision about the performance
and the position of the company (Fulin, 2011).
Firstly, the audited financial statement of the company has been analyzed and further,
the study has been conducted over the various strategies and policies to analyze the
performance of the company. This report would depict about the various problems which has
been faced by the company and the way through which, these problems could be overcome
by the company. Further, it has also been found that the management and financial
accounting evaluation assist a company to make various better choices.
Company and industry overview:
Unilever N.V. is a consumer goods company. Headquarter of the company is in
Britain. This company has various subsidiaries companies which are performing their
operations into various other countries. The main products of the Unilever are beverages,
food products, personal care products, cleaning agents etc. According to the current report, it
has been found that this company is the largest company in segment of consumer goods. This
company is one of the oldest global companies (Morningstar, 2017). Currently, this company
is performing in 190 countries and the diversification of the company is still ongoing.
Further, it has also been analyzed that the 400 brands are owned by this company and the
⊘ This is a preview!⊘
Do you want full access?
Subscribe today to unlock all pages.
Trusted by 1+ million students worldwide
International Management
4
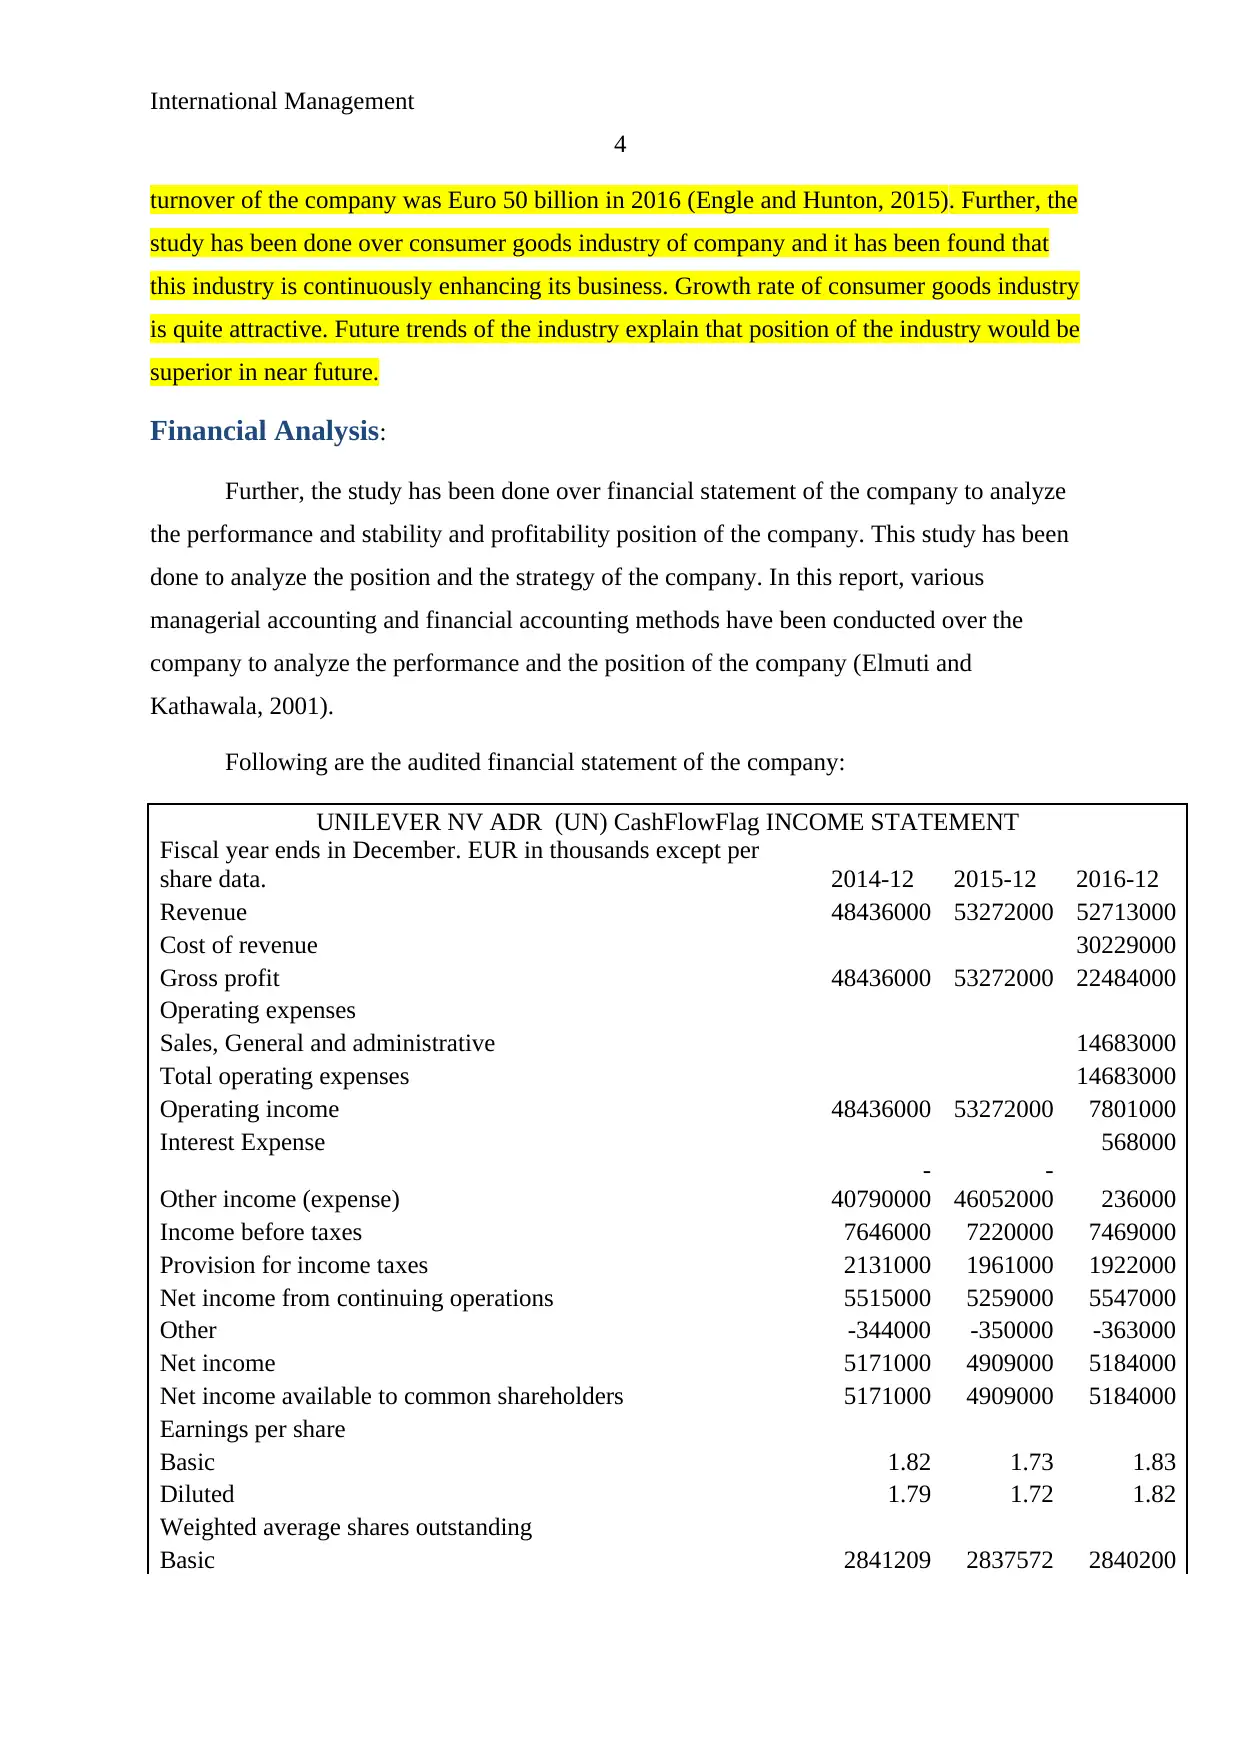
turnover of the company was Euro 50 billion in 2016 (Engle and Hunton, 2015). Further, the
study has been done over consumer goods industry of company and it has been found that
this industry is continuously enhancing its business. Growth rate of consumer goods industry
is quite attractive. Future trends of the industry explain that position of the industry would be
superior in near future.
Financial Analysis:
Further, the study has been done over financial statement of the company to analyze
the performance and stability and profitability position of the company. This study has been
done to analyze the position and the strategy of the company. In this report, various
managerial accounting and financial accounting methods have been conducted over the
company to analyze the performance and the position of the company (Elmuti and
Kathawala, 2001).
Following are the audited financial statement of the company:
UNILEVER NV ADR (UN) CashFlowFlag INCOME STATEMENT
Fiscal year ends in December. EUR in thousands except per
share data. 2014-12 2015-12 2016-12
Revenue 48436000 53272000 52713000
Cost of revenue 30229000
Gross profit 48436000 53272000 22484000
Operating expenses
Sales, General and administrative 14683000
Total operating expenses 14683000
Operating income 48436000 53272000 7801000
Interest Expense 568000
Other income (expense)
-
40790000
-
46052000 236000
Income before taxes 7646000 7220000 7469000
Provision for income taxes 2131000 1961000 1922000
Net income from continuing operations 5515000 5259000 5547000
Other -344000 -350000 -363000
Net income 5171000 4909000 5184000
Net income available to common shareholders 5171000 4909000 5184000
Earnings per share
Basic 1.82 1.73 1.83
Diluted 1.79 1.72 1.82
Weighted average shares outstanding
Basic 2841209 2837572 2840200
4
turnover of the company was Euro 50 billion in 2016 (Engle and Hunton, 2015). Further, the
study has been done over consumer goods industry of company and it has been found that
this industry is continuously enhancing its business. Growth rate of consumer goods industry
is quite attractive. Future trends of the industry explain that position of the industry would be
superior in near future.
Financial Analysis:
Further, the study has been done over financial statement of the company to analyze
the performance and stability and profitability position of the company. This study has been
done to analyze the position and the strategy of the company. In this report, various
managerial accounting and financial accounting methods have been conducted over the
company to analyze the performance and the position of the company (Elmuti and
Kathawala, 2001).
Following are the audited financial statement of the company:
UNILEVER NV ADR (UN) CashFlowFlag INCOME STATEMENT
Fiscal year ends in December. EUR in thousands except per
share data. 2014-12 2015-12 2016-12
Revenue 48436000 53272000 52713000
Cost of revenue 30229000
Gross profit 48436000 53272000 22484000
Operating expenses
Sales, General and administrative 14683000
Total operating expenses 14683000
Operating income 48436000 53272000 7801000
Interest Expense 568000
Other income (expense)
-
40790000
-
46052000 236000
Income before taxes 7646000 7220000 7469000
Provision for income taxes 2131000 1961000 1922000
Net income from continuing operations 5515000 5259000 5547000
Other -344000 -350000 -363000
Net income 5171000 4909000 5184000
Net income available to common shareholders 5171000 4909000 5184000
Earnings per share
Basic 1.82 1.73 1.83
Diluted 1.79 1.72 1.82
Weighted average shares outstanding
Basic 2841209 2837572 2840200
Paraphrase This Document
Need a fresh take? Get an instant paraphrase of this document with our AI Paraphraser
International Management
5
Diluted 2888827 2854070 2853900
EBITDA 7980000 7515000 9501000
UNILEVER NV ADR (UN) CashFlowFlag BALANCE SHEET
Fiscal year ends in December. EUR in thousands except per share
data. 2014-12 2015-12 2016-12
Assets
Current assets
Cash
Cash and cash equivalents 3382000
Short-term investments 599000
Total cash 3981000
Receivables 5310000 5034000 3329000
Inventories 4278000
Deferred income taxes
Other current assets 7037000 7652000 2296000
Total current assets 12347000 12686000 13884000
Non-current assets
Property, plant and equipment
Gross property, plant and equipment 21207000
Accumulated Depreciation -9534000
Net property, plant and equipment 11673000
Equity and other investments 760000
Goodwill 17624000
Intangible assets 22174000 25059000 9809000
Deferred income taxes 1286000 1185000 1354000
Prepaid pension benefit 694000
Other long-term assets 12220000 13368000 631000
Total non-current assets 35680000 39612000 42545000
Total assets 48027000 52298000 56429000
Liabilities and stockholders' equity
Liabilities
Current liabilities
Short-term debt 5266000
Capital leases 9000
Accounts payable 13788000 8591000
Taxes payable 1081000 1127000 1312000
Accrued liabilities 3655000
Other current liabilities 18561000 5104000 1723000
Total current liabilities 19642000 20019000 20556000
Non-current liabilities
Long-term debt 10933000
International Management
6
Capital leases 134000
Deferred taxes liabilities 2061000
Accrued liabilities 159000
Pensions and other benefits 3947000 3254000 3867000
Minority interest 612000 643000 626000
Other long-term liabilities 10175000 12943000 1739000
Total non-current liabilities 14734000 16840000 19519000
Total liabilities 34376000 36859000 40075000
Stockholders' equity
Common stock 484000
Additional paid-in capital 134000
Retained earnings 23179000
Accumulated other comprehensive income 13651000 15439000 -7443000
Total stockholders' equity 13651000 15439000 16354000
Total liabilities and stockholders' equity 48027000 52298000 56429000
UNILEVER NV ADR (UN) Statement of CASH FLOW
Fiscal year ends in December. EUR in thousands except per share
data. 2014-12 2015-12 2016-12
Cash Flows From Operating Activities
Net income 5547000
Depreciation & amortization 1464000
Stock based compensation 198000
Inventory 190000
Accounts payable -281000
Other working capital 142000
Other non-cash items 5543000 7330000 -213000
Net cash provided by operating activities 5543000 7330000 7047000
Cash Flows From Investing Activities
Investments in property, plant, and equipment
-
1804000
Property, plant, and equipment reductions 158000
Acquisitions, net
-
1701000
Purchases of investments -208000
Sales/Maturities of investments 173000
Purchases of intangibles -232000
Other investing activities -341000
-
3539000 426000
Net cash used for investing activities -341000
-
3539000
-
3188000
Cash Flows From Financing Activities
Debt issued 6761000
⊘ This is a preview!⊘
Do you want full access?
Subscribe today to unlock all pages.
Trusted by 1+ million students worldwide
International Management
7
Debt repayment
-
5248000
Common stock repurchased
Dividend paid
-
4081000
Other financing activities
-
5190000
-
3032000 -505000
Net cash provided by (used for) financing activities
-
5190000
-
3032000
-
3073000
Effect of exchange rate changes -146000 -541000 284000
Net change in cash -134000 218000 1070000
Cash at beginning of period 2044000 1910000 2128000
Cash at end of period 1910000 2128000 3198000
Free Cash Flow
Operating cash flow 5543000 7330000 7047000
Capital expenditure
-
2036000
Free cash flow 5543000 7330000 5011000
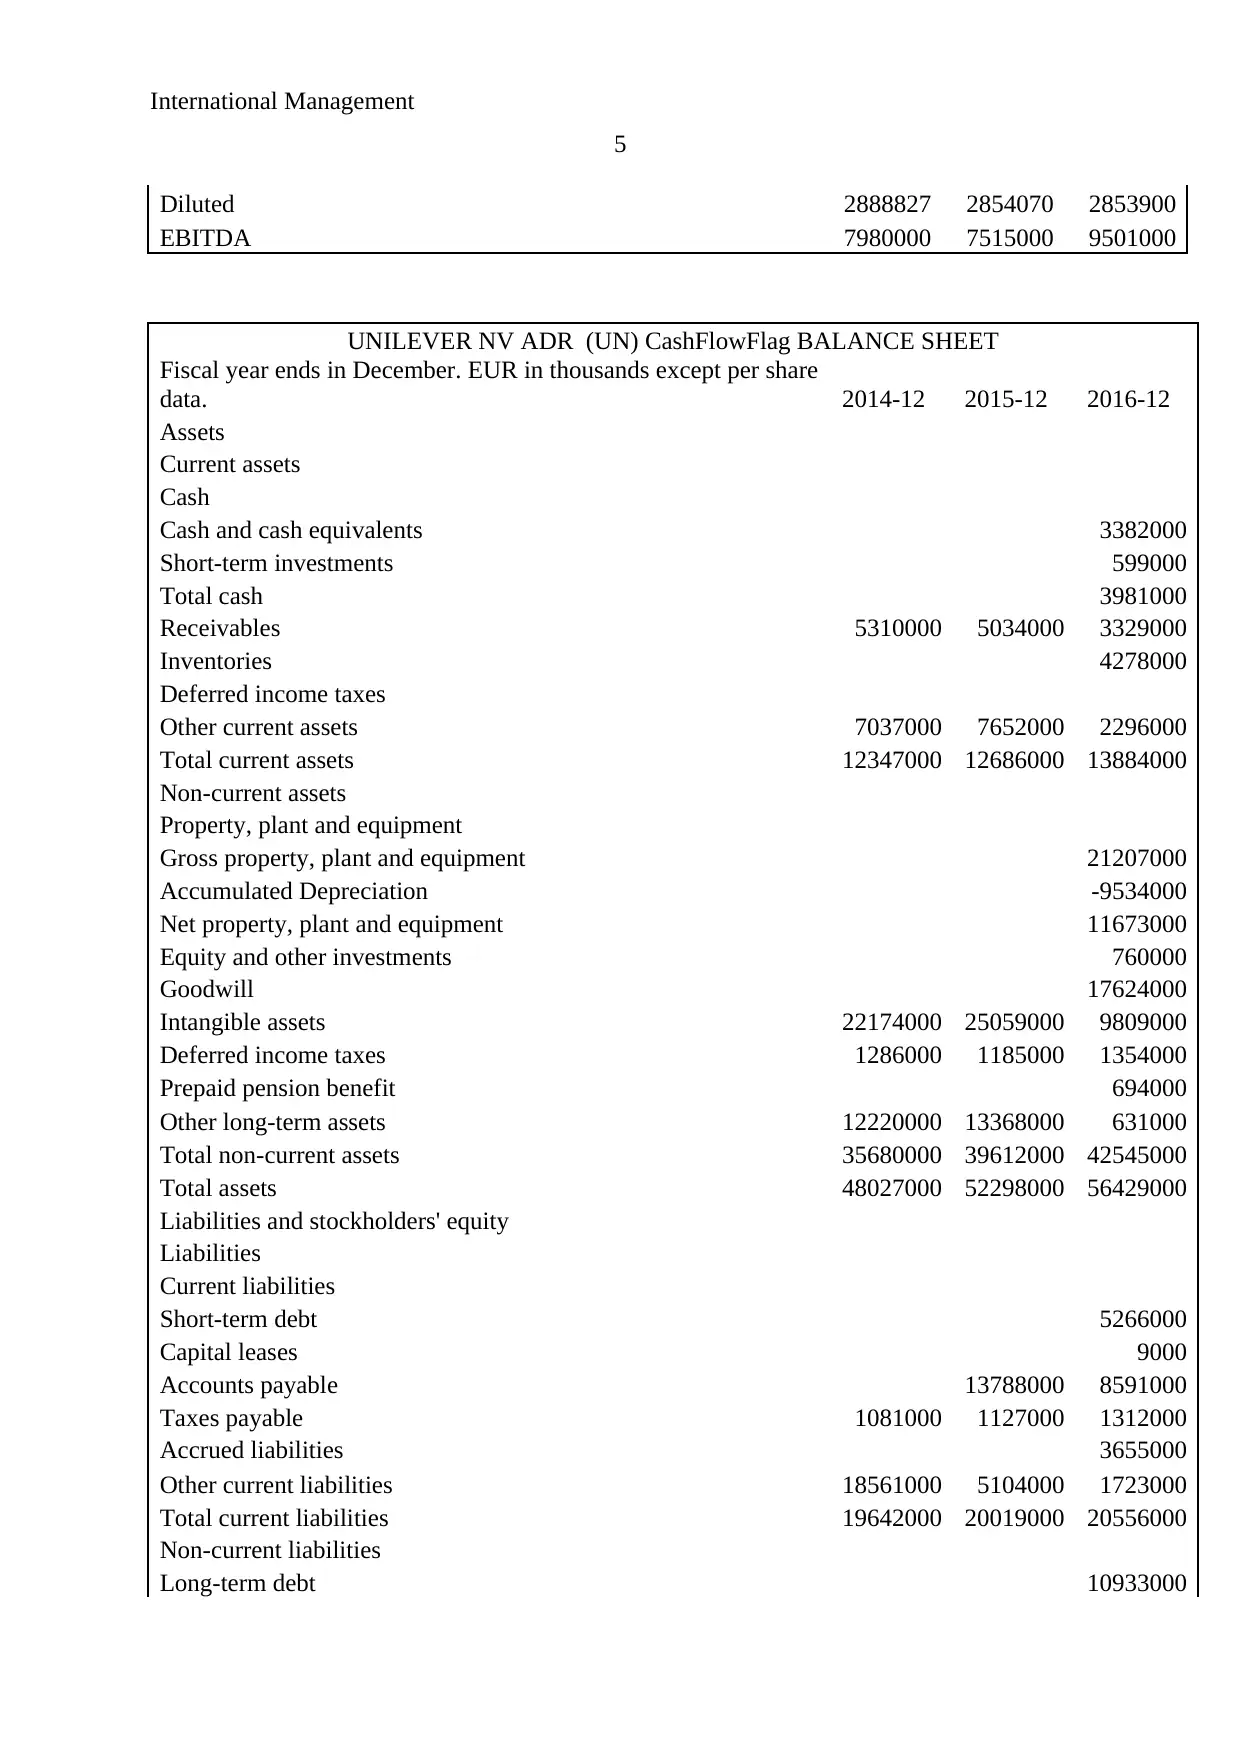
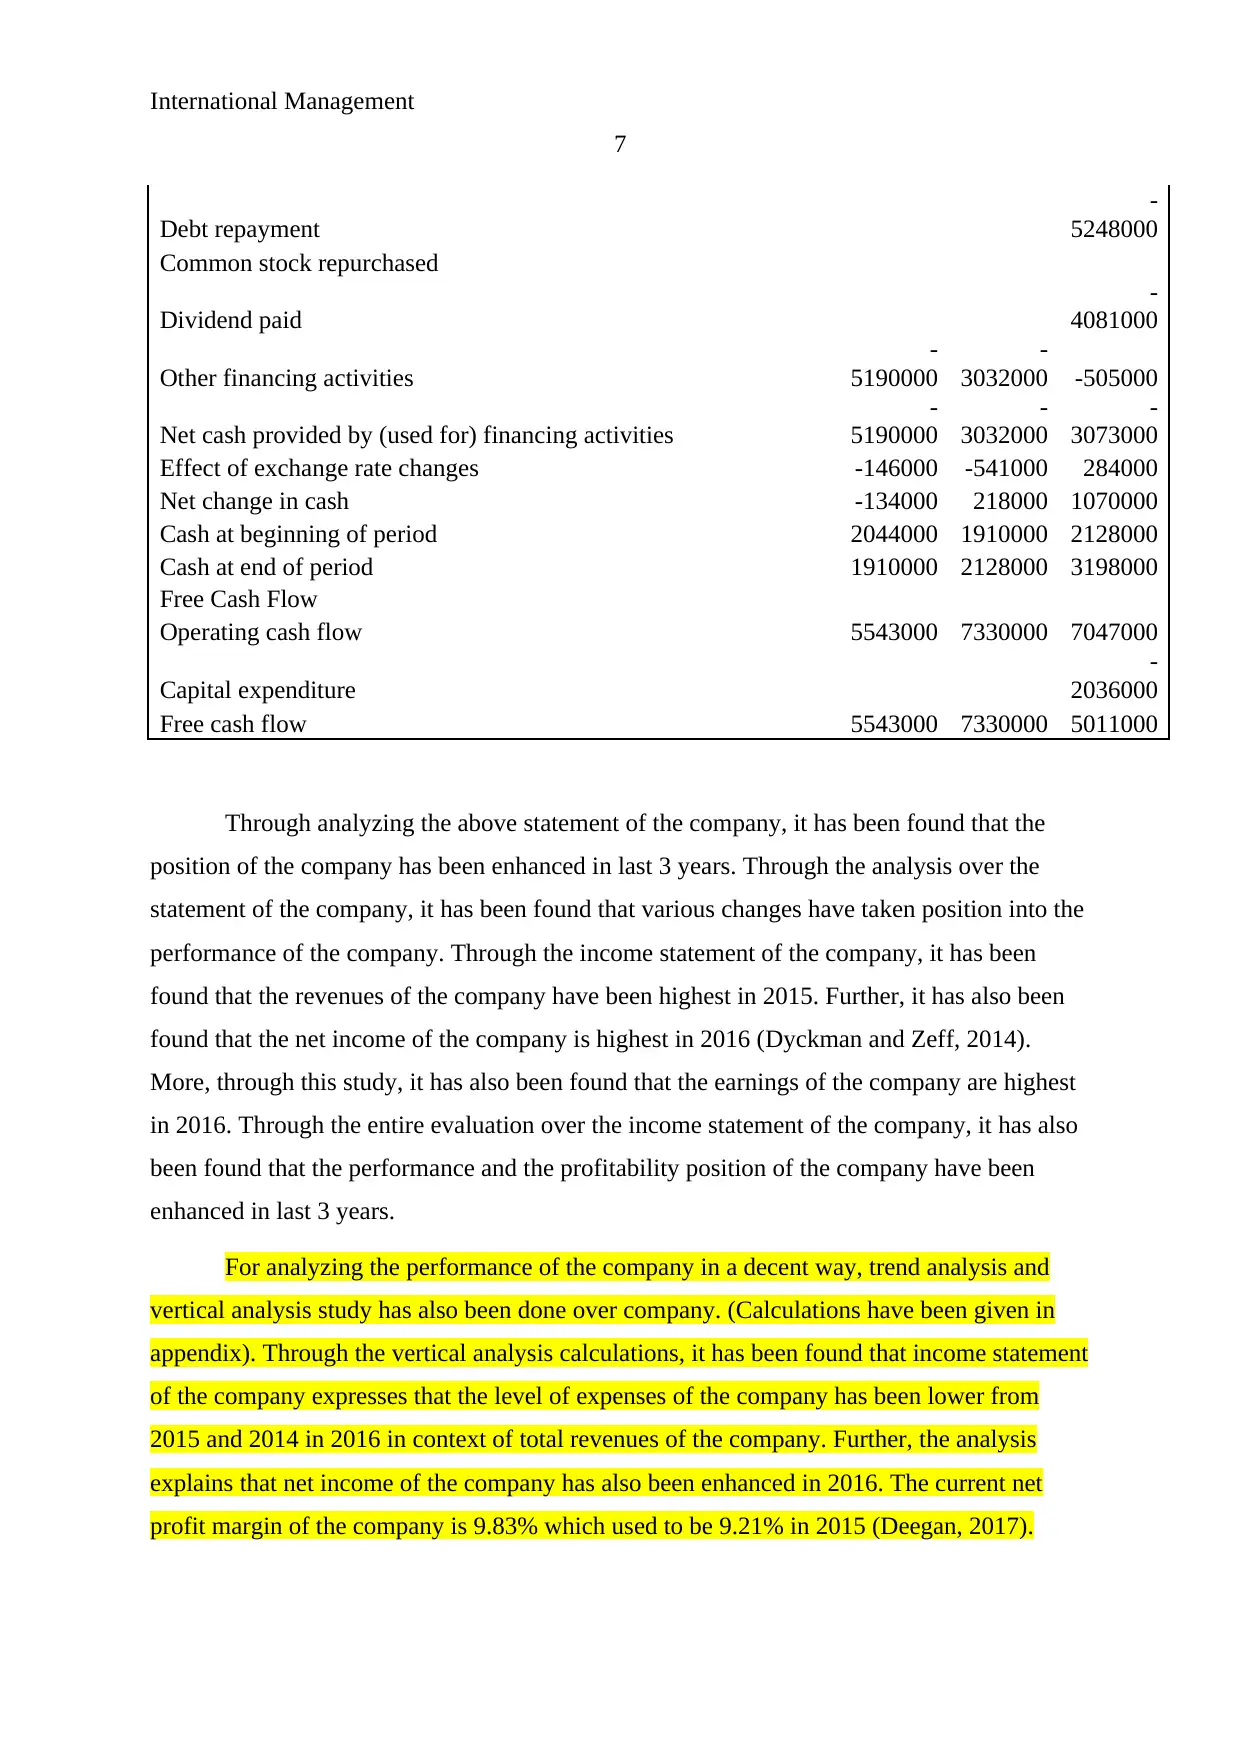
Through analyzing the above statement of the company, it has been found that the
position of the company has been enhanced in last 3 years. Through the analysis over the
statement of the company, it has been found that various changes have taken position into the
performance of the company. Through the income statement of the company, it has been
found that the revenues of the company have been highest in 2015. Further, it has also been
found that the net income of the company is highest in 2016 (Dyckman and Zeff, 2014).
More, through this study, it has also been found that the earnings of the company are highest
in 2016. Through the entire evaluation over the income statement of the company, it has also
been found that the performance and the profitability position of the company have been
enhanced in last 3 years.
For analyzing the performance of the company in a decent way, trend analysis and
vertical analysis study has also been done over company. (Calculations have been given in
appendix). Through the vertical analysis calculations, it has been found that income statement
of the company expresses that the level of expenses of the company has been lower from
2015 and 2014 in 2016 in context of total revenues of the company. Further, the analysis
explains that net income of the company has also been enhanced in 2016. The current net
profit margin of the company is 9.83% which used to be 9.21% in 2015 (Deegan, 2017).
7
Debt repayment
-
5248000
Common stock repurchased
Dividend paid
-
4081000
Other financing activities
-
5190000
-
3032000 -505000
Net cash provided by (used for) financing activities
-
5190000
-
3032000
-
3073000
Effect of exchange rate changes -146000 -541000 284000
Net change in cash -134000 218000 1070000
Cash at beginning of period 2044000 1910000 2128000
Cash at end of period 1910000 2128000 3198000
Free Cash Flow
Operating cash flow 5543000 7330000 7047000
Capital expenditure
-
2036000
Free cash flow 5543000 7330000 5011000
Through analyzing the above statement of the company, it has been found that the
position of the company has been enhanced in last 3 years. Through the analysis over the
statement of the company, it has been found that various changes have taken position into the
performance of the company. Through the income statement of the company, it has been
found that the revenues of the company have been highest in 2015. Further, it has also been
found that the net income of the company is highest in 2016 (Dyckman and Zeff, 2014).
More, through this study, it has also been found that the earnings of the company are highest
in 2016. Through the entire evaluation over the income statement of the company, it has also
been found that the performance and the profitability position of the company have been
enhanced in last 3 years.
For analyzing the performance of the company in a decent way, trend analysis and
vertical analysis study has also been done over company. (Calculations have been given in
appendix). Through the vertical analysis calculations, it has been found that income statement
of the company expresses that the level of expenses of the company has been lower from
2015 and 2014 in 2016 in context of total revenues of the company. Further, the analysis
explains that net income of the company has also been enhanced in 2016. The current net
profit margin of the company is 9.83% which used to be 9.21% in 2015 (Deegan, 2017).
Paraphrase This Document
Need a fresh take? Get an instant paraphrase of this document with our AI Paraphraser
International Management
8
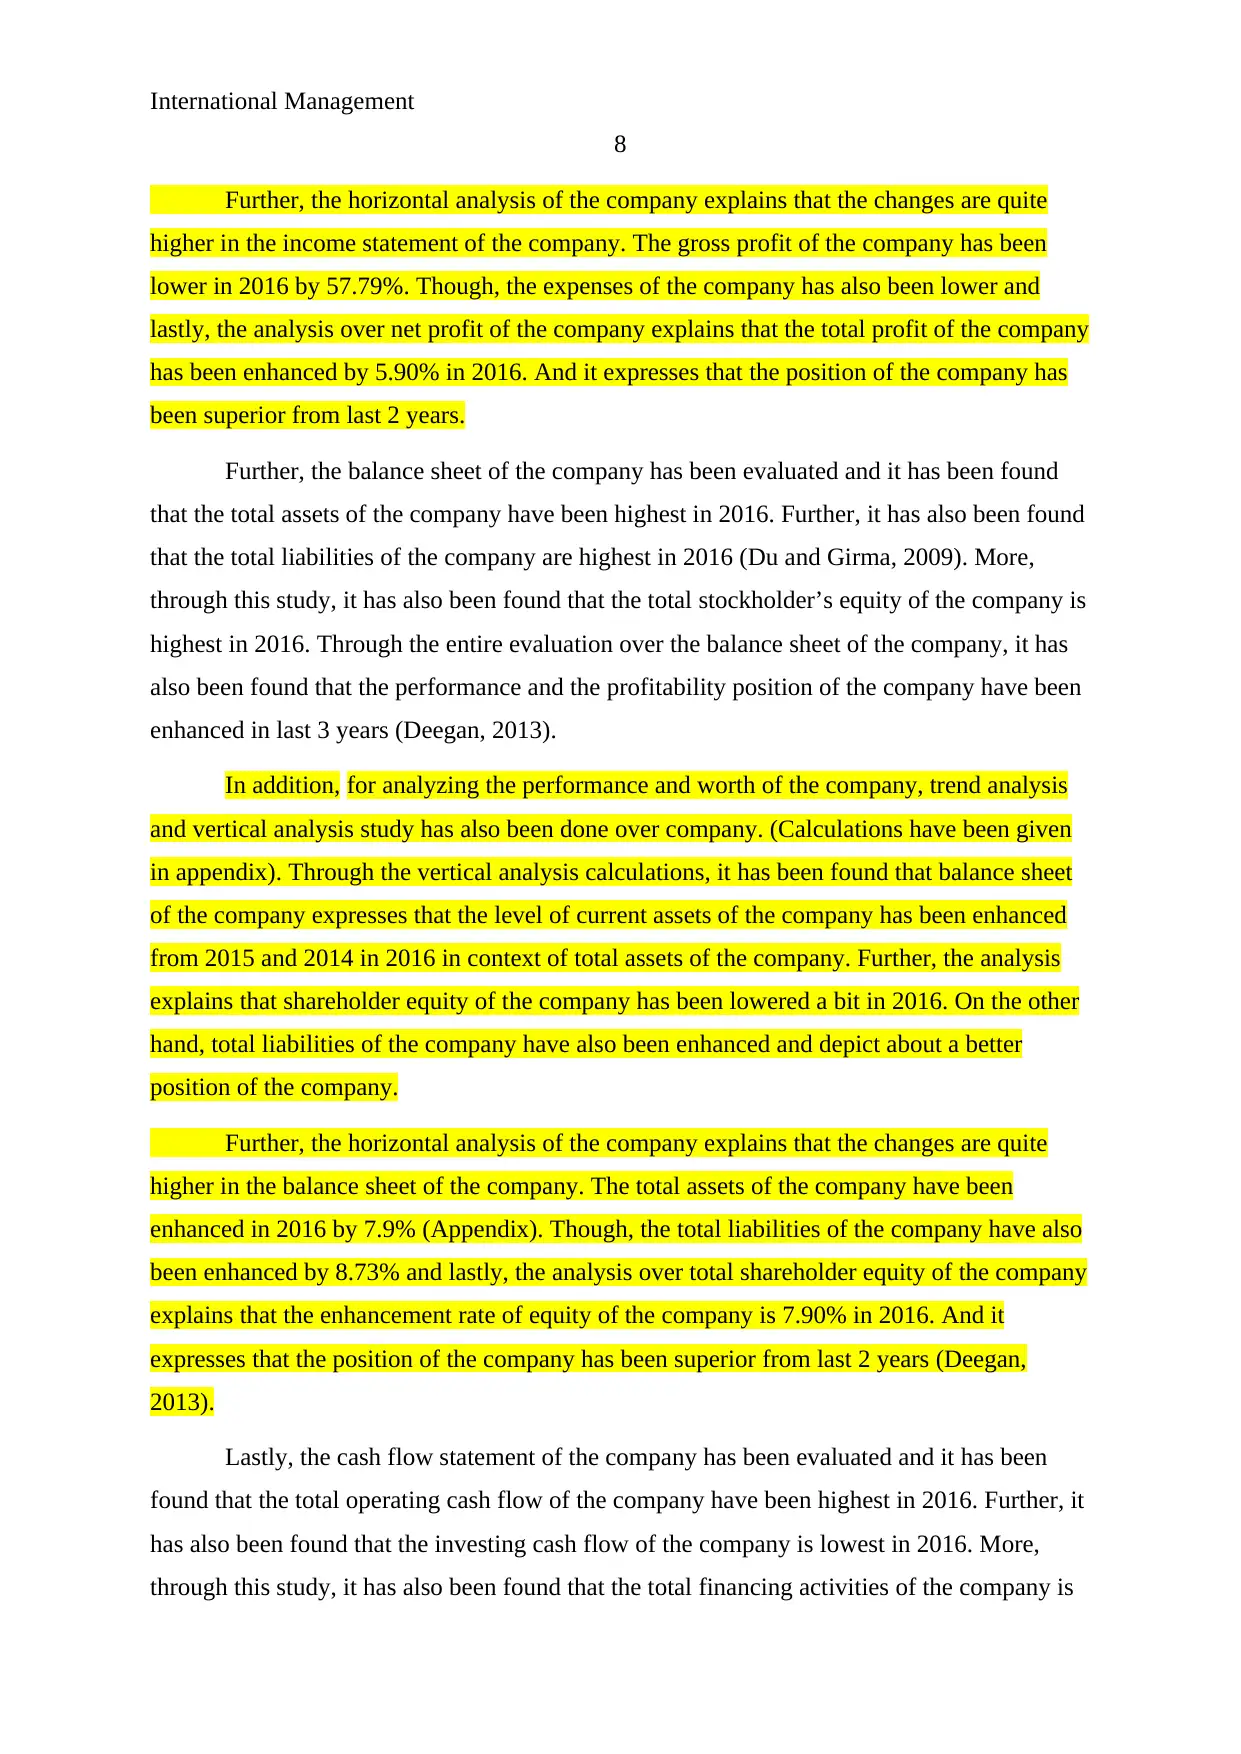
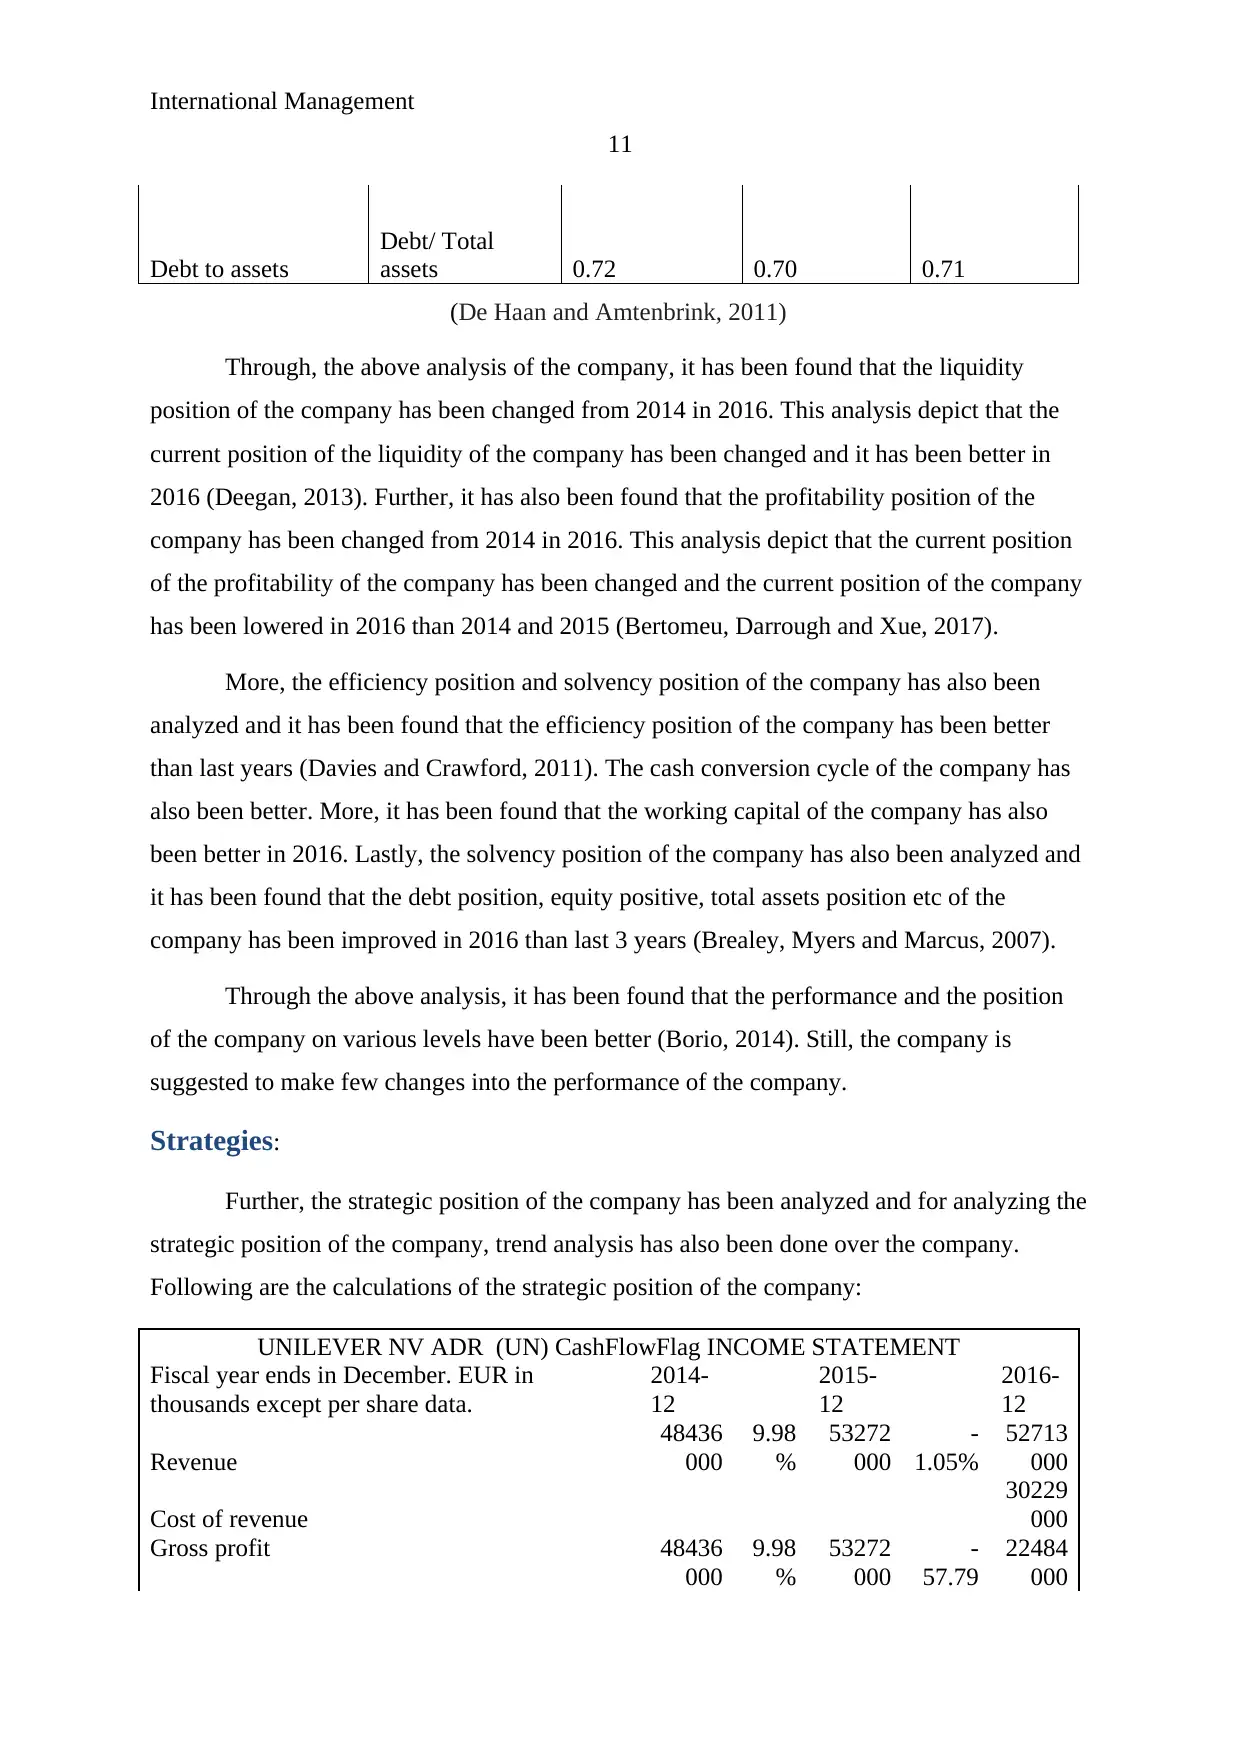
Further, the horizontal analysis of the company explains that the changes are quite
higher in the income statement of the company. The gross profit of the company has been
lower in 2016 by 57.79%. Though, the expenses of the company has also been lower and
lastly, the analysis over net profit of the company explains that the total profit of the company
has been enhanced by 5.90% in 2016. And it expresses that the position of the company has
been superior from last 2 years.
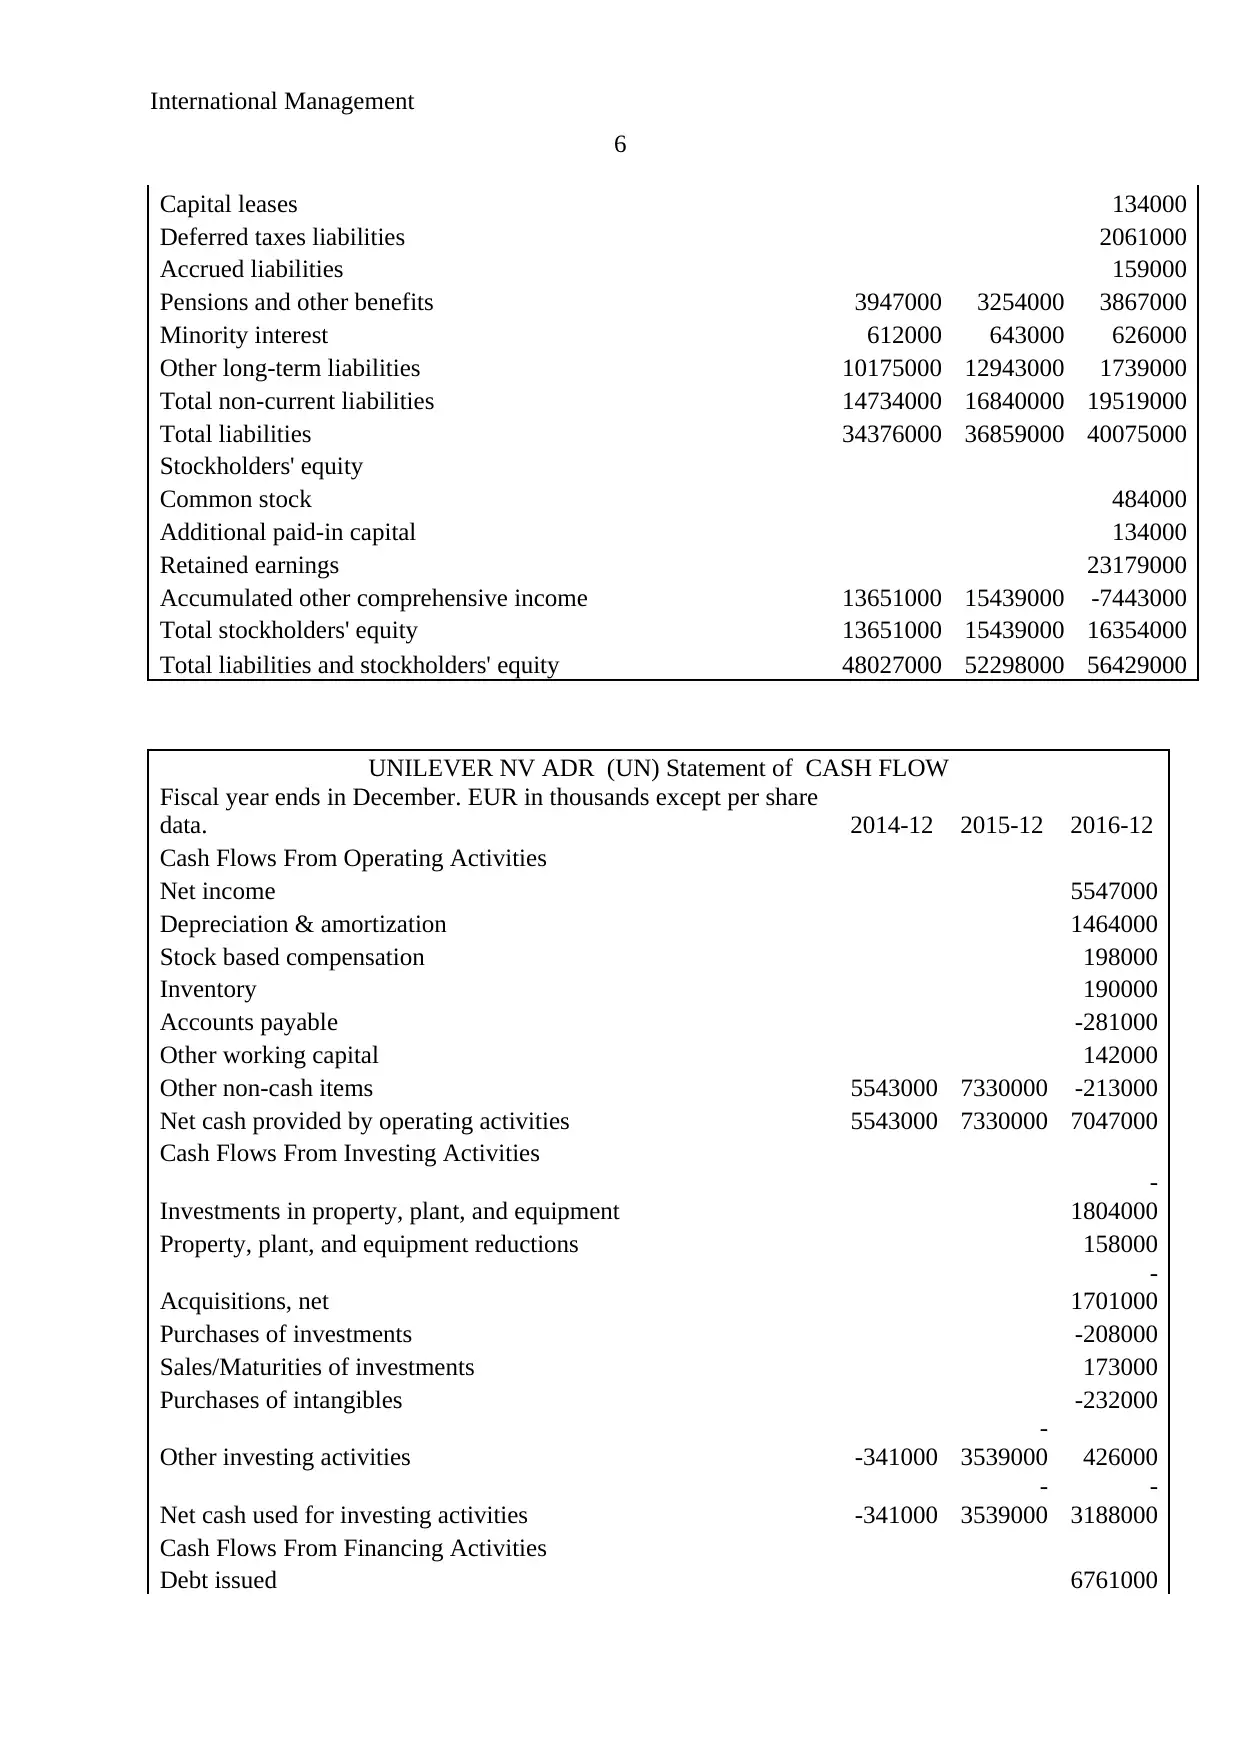
Further, the balance sheet of the company has been evaluated and it has been found
that the total assets of the company have been highest in 2016. Further, it has also been found
that the total liabilities of the company are highest in 2016 (Du and Girma, 2009). More,
through this study, it has also been found that the total stockholder’s equity of the company is
highest in 2016. Through the entire evaluation over the balance sheet of the company, it has
also been found that the performance and the profitability position of the company have been
enhanced in last 3 years (Deegan, 2013).
In addition, for analyzing the performance and worth of the company, trend analysis
and vertical analysis study has also been done over company. (Calculations have been given
in appendix). Through the vertical analysis calculations, it has been found that balance sheet
of the company expresses that the level of current assets of the company has been enhanced
from 2015 and 2014 in 2016 in context of total assets of the company. Further, the analysis
explains that shareholder equity of the company has been lowered a bit in 2016. On the other
hand, total liabilities of the company have also been enhanced and depict about a better
position of the company.
Further, the horizontal analysis of the company explains that the changes are quite
higher in the balance sheet of the company. The total assets of the company have been
enhanced in 2016 by 7.9% (Appendix). Though, the total liabilities of the company have also
been enhanced by 8.73% and lastly, the analysis over total shareholder equity of the company
explains that the enhancement rate of equity of the company is 7.90% in 2016. And it
expresses that the position of the company has been superior from last 2 years (Deegan,
2013).
Lastly, the cash flow statement of the company has been evaluated and it has been
found that the total operating cash flow of the company have been highest in 2016. Further, it
has also been found that the investing cash flow of the company is lowest in 2016. More,
through this study, it has also been found that the total financing activities of the company is
8
Further, the horizontal analysis of the company explains that the changes are quite
higher in the income statement of the company. The gross profit of the company has been
lower in 2016 by 57.79%. Though, the expenses of the company has also been lower and
lastly, the analysis over net profit of the company explains that the total profit of the company
has been enhanced by 5.90% in 2016. And it expresses that the position of the company has
been superior from last 2 years.
Further, the balance sheet of the company has been evaluated and it has been found
that the total assets of the company have been highest in 2016. Further, it has also been found
that the total liabilities of the company are highest in 2016 (Du and Girma, 2009). More,
through this study, it has also been found that the total stockholder’s equity of the company is
highest in 2016. Through the entire evaluation over the balance sheet of the company, it has
also been found that the performance and the profitability position of the company have been
enhanced in last 3 years (Deegan, 2013).
In addition, for analyzing the performance and worth of the company, trend analysis
and vertical analysis study has also been done over company. (Calculations have been given
in appendix). Through the vertical analysis calculations, it has been found that balance sheet
of the company expresses that the level of current assets of the company has been enhanced
from 2015 and 2014 in 2016 in context of total assets of the company. Further, the analysis
explains that shareholder equity of the company has been lowered a bit in 2016. On the other
hand, total liabilities of the company have also been enhanced and depict about a better
position of the company.
Further, the horizontal analysis of the company explains that the changes are quite
higher in the balance sheet of the company. The total assets of the company have been
enhanced in 2016 by 7.9% (Appendix). Though, the total liabilities of the company have also
been enhanced by 8.73% and lastly, the analysis over total shareholder equity of the company
explains that the enhancement rate of equity of the company is 7.90% in 2016. And it
expresses that the position of the company has been superior from last 2 years (Deegan,
2013).
Lastly, the cash flow statement of the company has been evaluated and it has been
found that the total operating cash flow of the company have been highest in 2016. Further, it
has also been found that the investing cash flow of the company is lowest in 2016. More,
through this study, it has also been found that the total financing activities of the company is
International Management
9
lowest in 2016 (De Haan and Amtenbrink, 2011). Through the entire evaluation over the cash
flow statement of the company, it has also been found that the performance and the
profitability position of the company have been enhanced in last 3 years.
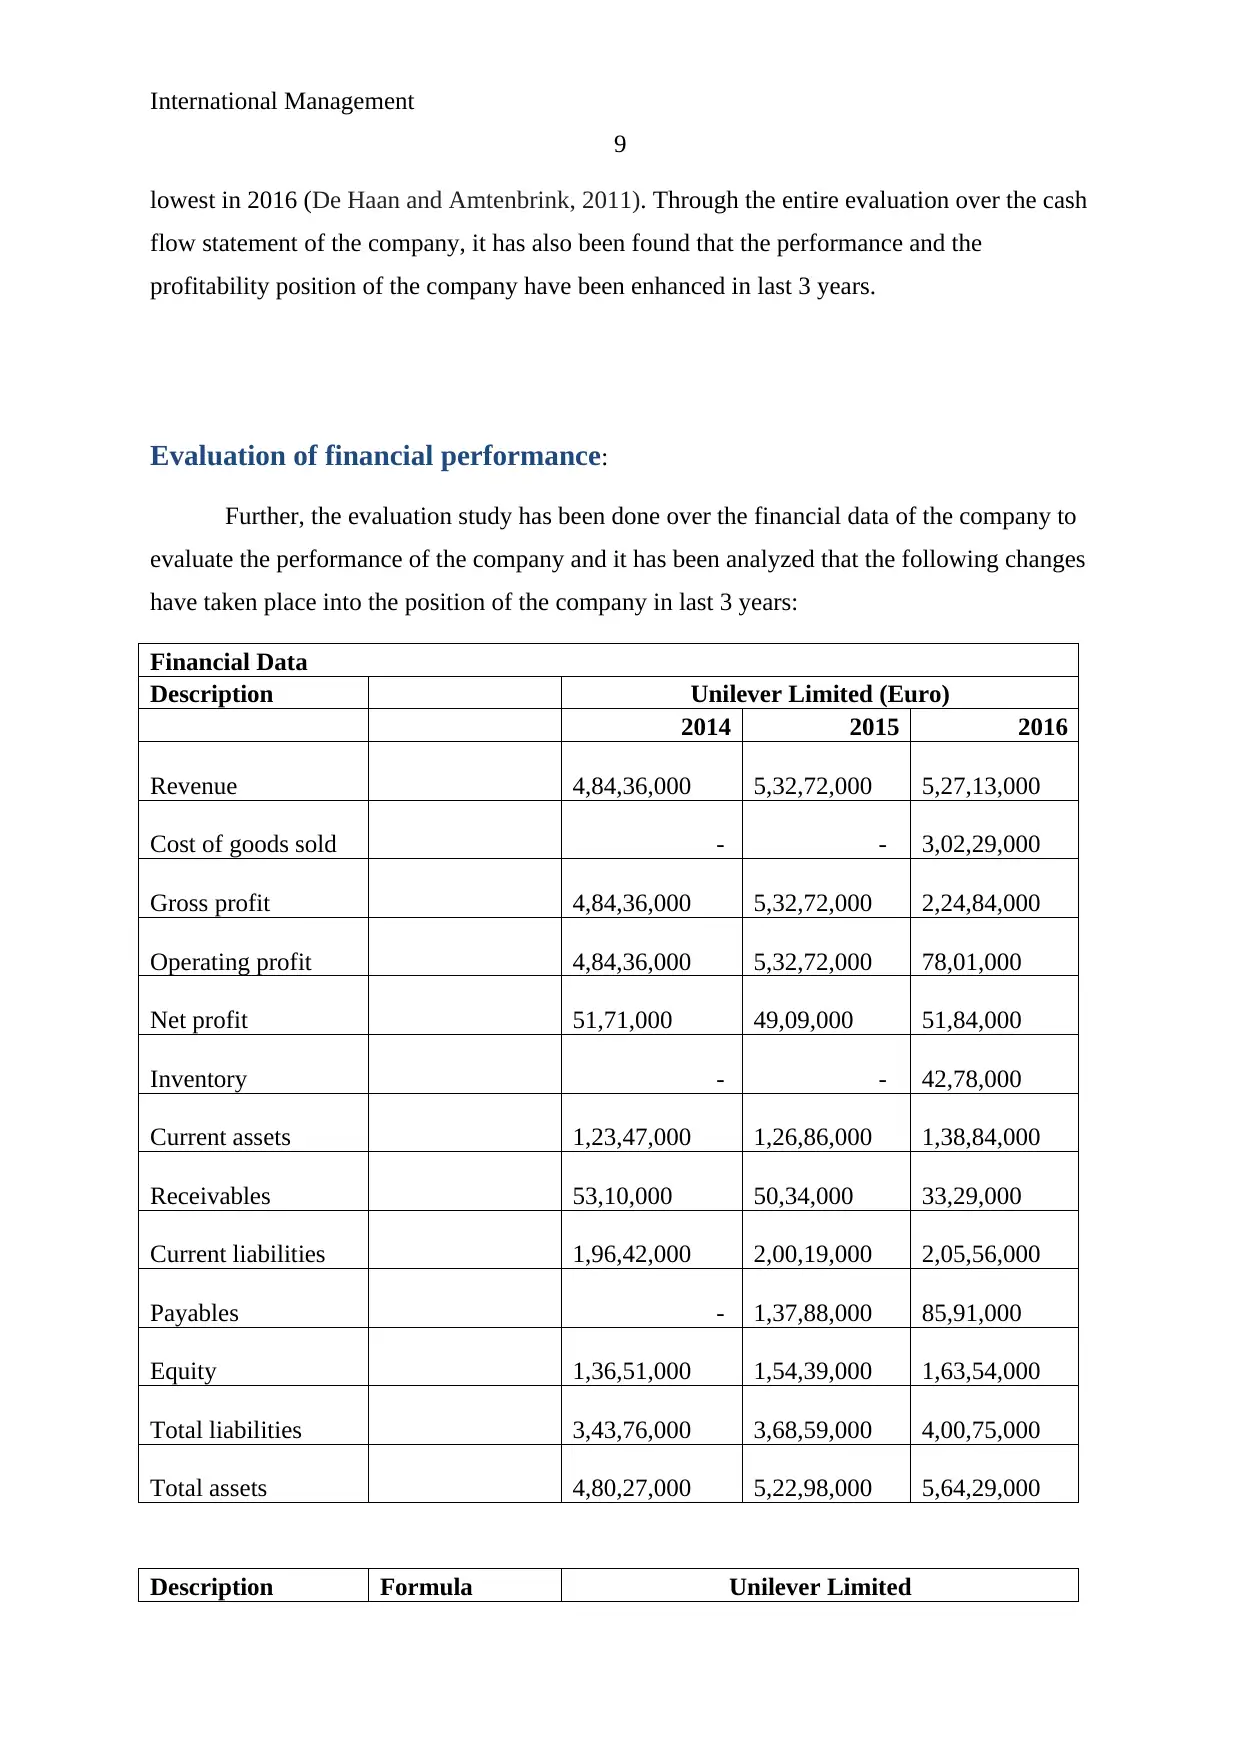
Evaluation of financial performance:
Further, the evaluation study has been done over the financial data of the company to
evaluate the performance of the company and it has been analyzed that the following changes
have taken place into the position of the company in last 3 years:
Financial Data
Description Unilever Limited (Euro)
2014 2015 2016
Revenue 4,84,36,000 5,32,72,000 5,27,13,000
Cost of goods sold - - 3,02,29,000
Gross profit 4,84,36,000 5,32,72,000 2,24,84,000
Operating profit 4,84,36,000 5,32,72,000 78,01,000
Net profit 51,71,000 49,09,000 51,84,000
Inventory - - 42,78,000
Current assets 1,23,47,000 1,26,86,000 1,38,84,000
Receivables 53,10,000 50,34,000 33,29,000
Current liabilities 1,96,42,000 2,00,19,000 2,05,56,000
Payables - 1,37,88,000 85,91,000
Equity 1,36,51,000 1,54,39,000 1,63,54,000
Total liabilities 3,43,76,000 3,68,59,000 4,00,75,000
Total assets 4,80,27,000 5,22,98,000 5,64,29,000
Description Formula Unilever Limited
9
lowest in 2016 (De Haan and Amtenbrink, 2011). Through the entire evaluation over the cash
flow statement of the company, it has also been found that the performance and the
profitability position of the company have been enhanced in last 3 years.
Evaluation of financial performance:
Further, the evaluation study has been done over the financial data of the company to
evaluate the performance of the company and it has been analyzed that the following changes
have taken place into the position of the company in last 3 years:
Financial Data
Description Unilever Limited (Euro)
2014 2015 2016
Revenue 4,84,36,000 5,32,72,000 5,27,13,000
Cost of goods sold - - 3,02,29,000
Gross profit 4,84,36,000 5,32,72,000 2,24,84,000
Operating profit 4,84,36,000 5,32,72,000 78,01,000
Net profit 51,71,000 49,09,000 51,84,000
Inventory - - 42,78,000
Current assets 1,23,47,000 1,26,86,000 1,38,84,000
Receivables 53,10,000 50,34,000 33,29,000
Current liabilities 1,96,42,000 2,00,19,000 2,05,56,000
Payables - 1,37,88,000 85,91,000
Equity 1,36,51,000 1,54,39,000 1,63,54,000
Total liabilities 3,43,76,000 3,68,59,000 4,00,75,000
Total assets 4,80,27,000 5,22,98,000 5,64,29,000
Description Formula Unilever Limited
⊘ This is a preview!⊘
Do you want full access?
Subscribe today to unlock all pages.
Trusted by 1+ million students worldwide
International Management
10
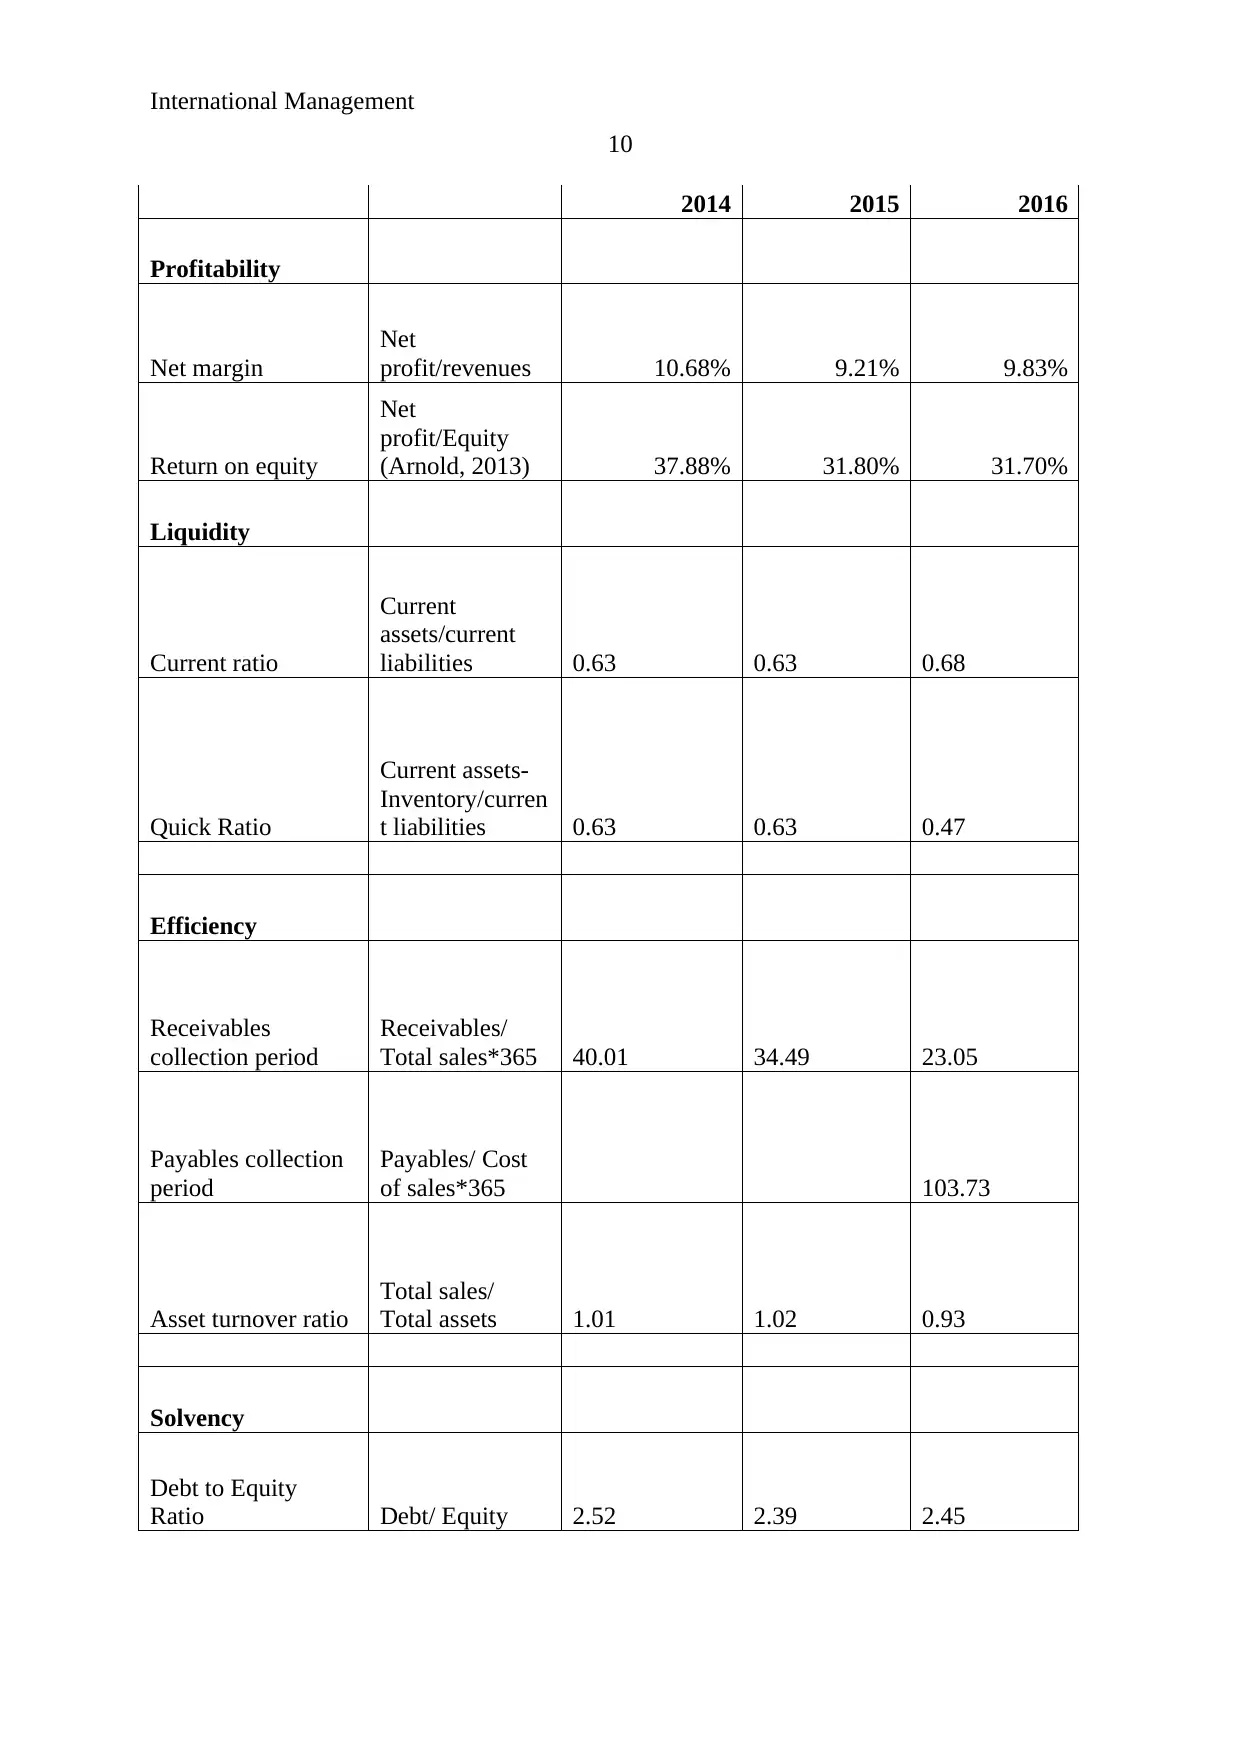
2014 2015 2016
Profitability
Net margin
Net
profit/revenues 10.68% 9.21% 9.83%
Return on equity
Net
profit/Equity
(Arnold, 2013) 37.88% 31.80% 31.70%
Liquidity
Current ratio
Current
assets/current
liabilities 0.63 0.63 0.68
Quick Ratio
Current assets-
Inventory/curren
t liabilities 0.63 0.63 0.47
Efficiency
Receivables
collection period
Receivables/
Total sales*365 40.01 34.49 23.05
Payables collection
period
Payables/ Cost
of sales*365 103.73
Asset turnover ratio
Total sales/
Total assets 1.01 1.02 0.93
Solvency
Debt to Equity
Ratio Debt/ Equity 2.52 2.39 2.45
10
2014 2015 2016
Profitability
Net margin
Net
profit/revenues 10.68% 9.21% 9.83%
Return on equity
Net
profit/Equity
(Arnold, 2013) 37.88% 31.80% 31.70%
Liquidity
Current ratio
Current
assets/current
liabilities 0.63 0.63 0.68
Quick Ratio
Current assets-
Inventory/curren
t liabilities 0.63 0.63 0.47
Efficiency
Receivables
collection period
Receivables/
Total sales*365 40.01 34.49 23.05
Payables collection
period
Payables/ Cost
of sales*365 103.73
Asset turnover ratio
Total sales/
Total assets 1.01 1.02 0.93
Solvency
Debt to Equity
Ratio Debt/ Equity 2.52 2.39 2.45
Paraphrase This Document
Need a fresh take? Get an instant paraphrase of this document with our AI Paraphraser
International Management
11
Debt to assets
Debt/ Total
assets 0.72 0.70 0.71
(De Haan and Amtenbrink, 2011)
Through, the above analysis of the company, it has been found that the liquidity
position of the company has been changed from 2014 in 2016. This analysis depict that the
current position of the liquidity of the company has been changed and it has been better in
2016 (Deegan, 2013). Further, it has also been found that the profitability position of the
company has been changed from 2014 in 2016. This analysis depict that the current position
of the profitability of the company has been changed and the current position of the company
has been lowered in 2016 than 2014 and 2015 (Bertomeu, Darrough and Xue, 2017).
More, the efficiency position and solvency position of the company has also been
analyzed and it has been found that the efficiency position of the company has been better
than last years (Davies and Crawford, 2011). The cash conversion cycle of the company has
also been better. More, it has been found that the working capital of the company has also
been better in 2016. Lastly, the solvency position of the company has also been analyzed and
it has been found that the debt position, equity positive, total assets position etc of the
company has been improved in 2016 than last 3 years (Brealey, Myers and Marcus, 2007).
Through the above analysis, it has been found that the performance and the position
of the company on various levels have been better (Borio, 2014). Still, the company is
suggested to make few changes into the performance of the company.
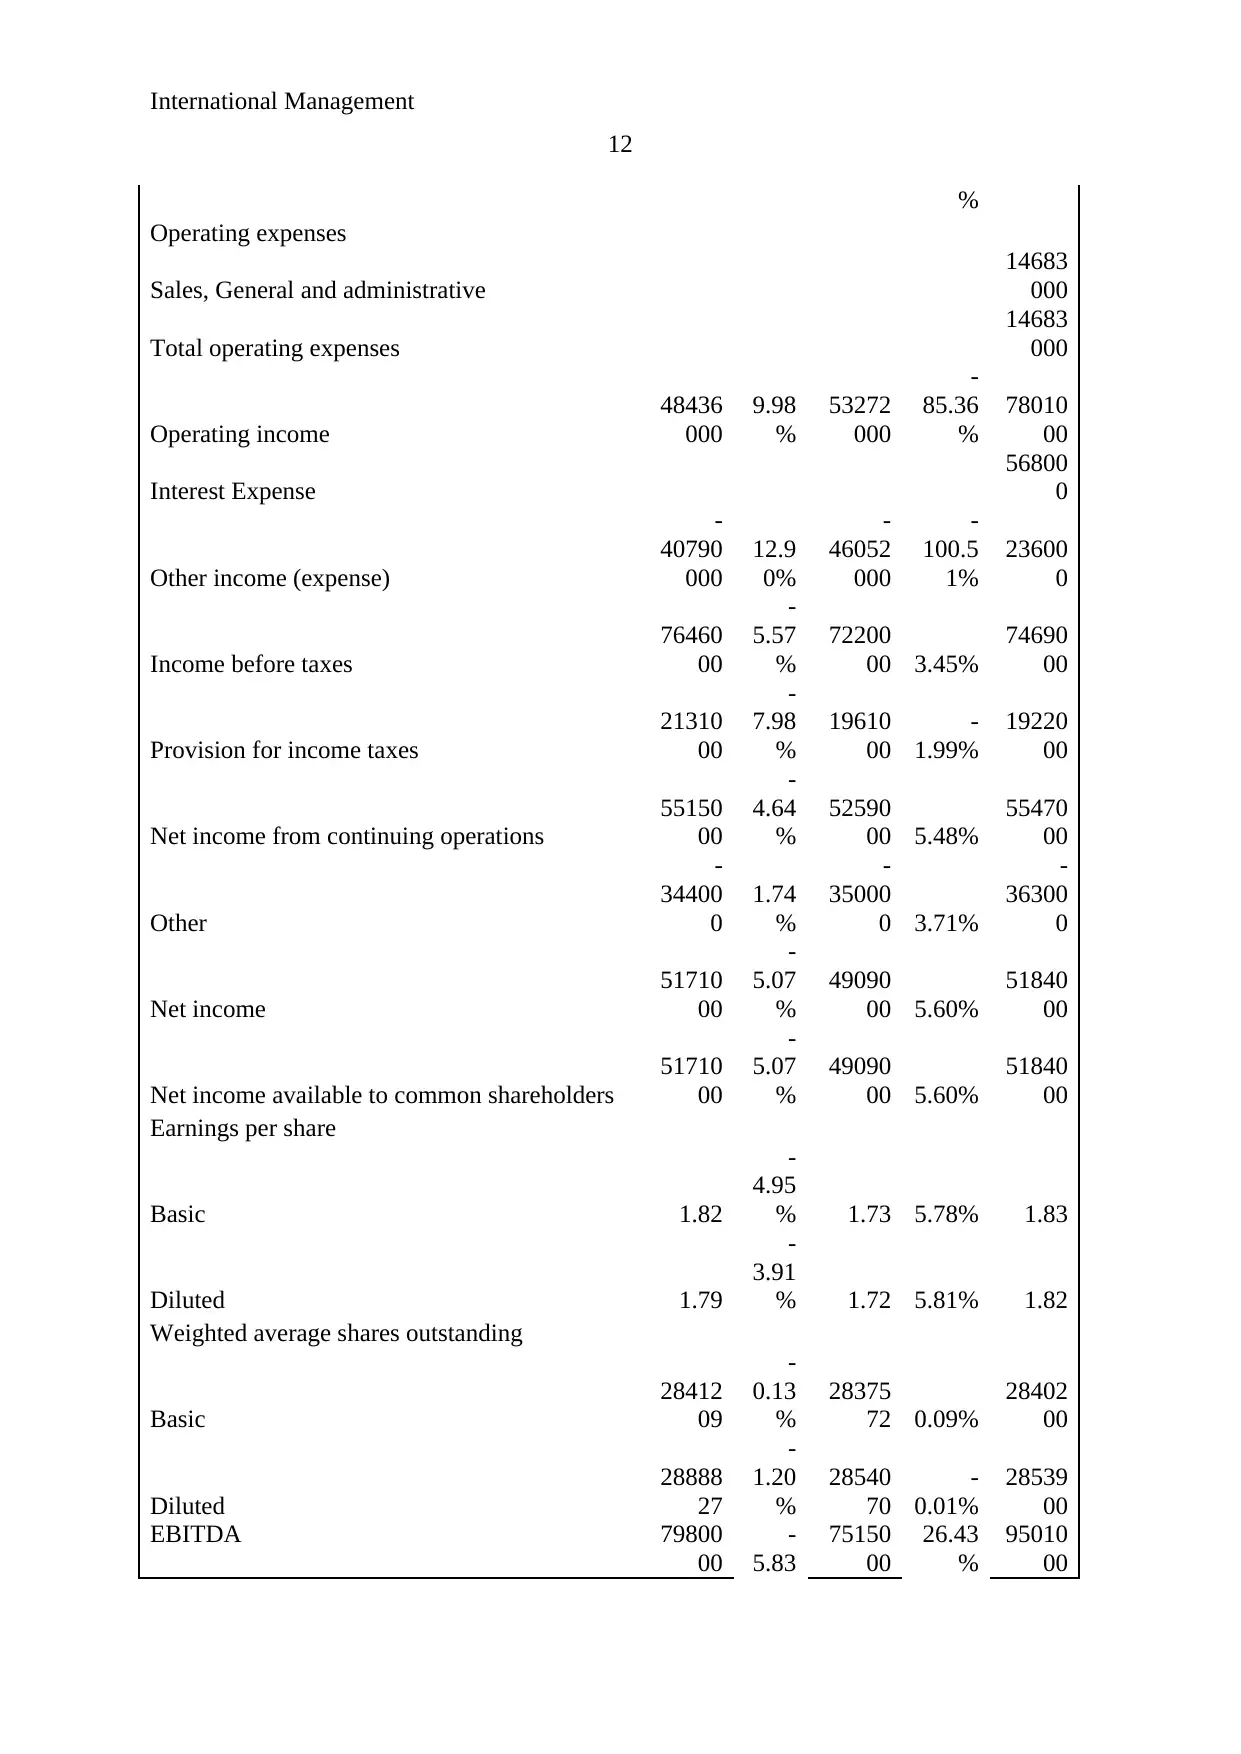
Strategies:
Further, the strategic position of the company has been analyzed and for analyzing the
strategic position of the company, trend analysis has also been done over the company.
Following are the calculations of the strategic position of the company:
UNILEVER NV ADR (UN) CashFlowFlag INCOME STATEMENT
Fiscal year ends in December. EUR in
thousands except per share data.
2014-
12
2015-
12
2016-
12
Revenue
48436
000
9.98
%
53272
000
-
1.05%
52713
000
Cost of revenue
30229
000
Gross profit 48436
000
9.98
%
53272
000
-
57.79
22484
000
11
Debt to assets
Debt/ Total
assets 0.72 0.70 0.71
(De Haan and Amtenbrink, 2011)
Through, the above analysis of the company, it has been found that the liquidity
position of the company has been changed from 2014 in 2016. This analysis depict that the
current position of the liquidity of the company has been changed and it has been better in
2016 (Deegan, 2013). Further, it has also been found that the profitability position of the
company has been changed from 2014 in 2016. This analysis depict that the current position
of the profitability of the company has been changed and the current position of the company
has been lowered in 2016 than 2014 and 2015 (Bertomeu, Darrough and Xue, 2017).
More, the efficiency position and solvency position of the company has also been
analyzed and it has been found that the efficiency position of the company has been better
than last years (Davies and Crawford, 2011). The cash conversion cycle of the company has
also been better. More, it has been found that the working capital of the company has also
been better in 2016. Lastly, the solvency position of the company has also been analyzed and
it has been found that the debt position, equity positive, total assets position etc of the
company has been improved in 2016 than last 3 years (Brealey, Myers and Marcus, 2007).
Through the above analysis, it has been found that the performance and the position
of the company on various levels have been better (Borio, 2014). Still, the company is
suggested to make few changes into the performance of the company.
Strategies:
Further, the strategic position of the company has been analyzed and for analyzing the
strategic position of the company, trend analysis has also been done over the company.
Following are the calculations of the strategic position of the company:
UNILEVER NV ADR (UN) CashFlowFlag INCOME STATEMENT
Fiscal year ends in December. EUR in
thousands except per share data.
2014-
12
2015-
12
2016-
12
Revenue
48436
000
9.98
%
53272
000
-
1.05%
52713
000
Cost of revenue
30229
000
Gross profit 48436
000
9.98
%
53272
000
-
57.79
22484
000
International Management
12
%
Operating expenses
Sales, General and administrative
14683
000
Total operating expenses
14683
000
Operating income
48436
000
9.98
%
53272
000
-
85.36
%
78010
00
Interest Expense
56800
0
Other income (expense)
-
40790
000
12.9
0%
-
46052
000
-
100.5
1%
23600
0
Income before taxes
76460
00
-
5.57
%
72200
00 3.45%
74690
00
Provision for income taxes
21310
00
-
7.98
%
19610
00
-
1.99%
19220
00
Net income from continuing operations
55150
00
-
4.64
%
52590
00 5.48%
55470
00
Other
-
34400
0
1.74
%
-
35000
0 3.71%
-
36300
0
Net income
51710
00
-
5.07
%
49090
00 5.60%
51840
00
Net income available to common shareholders
51710
00
-
5.07
%
49090
00 5.60%
51840
00
Earnings per share
Basic 1.82
-
4.95
% 1.73 5.78% 1.83
Diluted 1.79
-
3.91
% 1.72 5.81% 1.82
Weighted average shares outstanding
Basic
28412
09
-
0.13
%
28375
72 0.09%
28402
00
Diluted
28888
27
-
1.20
%
28540
70
-
0.01%
28539
00
EBITDA 79800
00
-
5.83
75150
00
26.43
%
95010
00
⊘ This is a preview!⊘
Do you want full access?
Subscribe today to unlock all pages.
Trusted by 1+ million students worldwide
1 out of 25
Related Documents


Your All-in-One AI-Powered Toolkit for Academic Success.
+13062052269
info@desklib.com
Available 24*7 on WhatsApp / Email
![[object Object]](/_next/static/media/star-bottom.7253800d.svg)
Unlock your academic potential
Copyright © 2020–2026 A2Z Services. All Rights Reserved. Developed and managed by ZUCOL.