Financial Analysis of Unilever and Reckitt Benckiser: A Comparison
VerifiedAdded on 2023/04/21
|22
|6630
|424
Report
AI Summary
This report offers a comprehensive financial analysis comparing the performance of Unilever and Reckitt Benckiser, two major players in the consumer goods sector. The analysis encompasses a detailed examination of key financial ratios, including profitability, liquidity, efficiency, gearing, and investment ratios, over a three-year period (2015-2017). The report delves into the companies' respective core businesses, revenue sources, and market positions. Through the ratio analysis, the report identifies Unilever as having a stronger financial performance, particularly in terms of profit margins, return on assets, and efficient management of liabilities and assets compared to Reckitt Benckiser. The report concludes with an investment recommendation, suggesting Unilever as a more attractive option for prospective investors based on its superior financial health and future prospects.

Running Head: Financial Management
0
Financial Management
Student Name
Date
0
Financial Management
Student Name
Date
Paraphrase This Document
Need a fresh take? Get an instant paraphrase of this document with our AI Paraphraser

Comparison of financial performance between Unilever and Reckitt Benckiser
1
Executive Summary –
Unilever and Reckitt Benckiser are largest companies from consumer goods sector. They
directly deliver their products and services to the customers with high level of innovations
and continuous improvement in their products and services through new technologies and
innovative or sustainable products. The main source of revenue for Unilever is their personal
care products and main source of revenue for Reckitt Benckiser are their health and home
products which are delivering to their customers. By comparing the financial performance
through calculating various ratios as profitability ratios, liquidity ratios, efficiency ratios,
gearing ratios and investment ratios, we find that Unilever had more profit margin and return
on assets as compare to Reckitt Benckiser during the past three years. Unilever has more
efficient in managing their liabilities and use its assets, company has more ability to repay its
shorts term obligation and long term debts, they have more equity than its assets and
company also has gave more return to their investor as compare to Reckitt Benckiser over the
past three years. Future prospects of Unilever will more bright than Reckitt Benckiser
because as per analysts also earning of Unilever will continuously increase in the next couple
of years. So, we can say that, investor should buy the shares of Unilever because it will give
more return to them as compare to Reckitt Benckiser.

Comparison of financial performance between Unilever and Reckitt Benckiser
2
Table of Contents
Introduction –.............................................................................................................................3
Financial Analysis of Unilever and Reckitt Benckiser –...........................................................4
Ratio analysis of Unilever and Reckitt Benckiser..................................................................4
Corporate Strategy and the future prospects –...........................................................................7
Conclusion and Recommendations –.......................................................................................10
Learning Statement –...............................................................................................................11
References................................................................................................................................14
Appendixes-.............................................................................................................................17
Appendix 1...........................................................................................................................17
Appendix 2-..........................................................................................................................19
⊘ This is a preview!⊘
Do you want full access?
Subscribe today to unlock all pages.
Trusted by 1+ million students worldwide

Comparison of financial performance between Unilever and Reckitt Benckiser
3
Introduction –
The consumer goods sector is a category of companies which relate to products purchased by
person rather than by industries and manufactures. Companies which are includes in
consumer goods sector deliver their products to the customers with high level of innovation
and at high rate of turnover and in this sector, market is highly competitive. It includes
companies which are involved in clothing, food production, electronics, beverages and
automobiles (Viardot, 2017). There are various companies which are involved in consumer
goods sector and out of this Unilever and Reckitt Benckiser is largest company from
consumer goods sector. Unilever is an oldest multinational company and British Dutch
transactional company from consumer goods sector and it’s headquartered in London, United
Kingdom and its products are food, beverages, beauty products, cleaning agents and personal
care products. Unilever is fifth most valuable company in terms of revenue and sale in
consumer goods sector.
Unilever sell their products in 190 countries in whole world and it has approx. 400 brands but
company focus on 13 brands which have sales in billions (About US, 2019). Food and
beverages is main source of revenue for Unilever because it contributes 40 per cent of the
total revenue of the company and another source of revenue for the company is to segment its
products. Personal care products are also main source of revenue for the company and it is
generated about 20.6 billion euros out of total revenue as 50.9 billion euros in 2018 (Revenue
of the Unilever Group worldwide 2005-2018 by product segment, 2019). Reckitt Benckiser is
a British multinational company which includes in consumer goods sector and its products
relate to health, hygiene and home products and its revenue is 11.5 million pounds in 2017
(About US, 2019). Environmental factors are affecting to the revenue of the company and it
includes economic, legal, political, social and technological factors (Munro and Belanger,
2017). The report consists of comparative financial performance of Unilever and Reckitt
Benckiser, their corporate strategy and future prospects of both companies.
Paraphrase This Document
Need a fresh take? Get an instant paraphrase of this document with our AI Paraphraser
Comparison of financial performance between Unilever and Reckitt Benckiser
4
Financial Analysis of Unilever and Reckitt Benckiser –
There are various techniques and tools for the calculation and analysis of financial
performance of the company. The ratio analysis, the portfolio analysis and capital budgeting
are the main tools which are used by the company for analysis of financial performance
(Bhimani, 2012). The ratio analysis is an important tool which is used by Unilever and
Reckitt Benckiser for analysing their financial performance (Peterson Drake and Fabozzi,
2012). For a comparative financial performance of Unilever and Reckitt Benckiser, we
calculate various ratios as profitability ratio, liquidity ratio, efficiency, gearing and
investment ratio.
Ratio analysis of Unilever and Reckitt Benckiser (Appendix 1 and Appendix 2) –
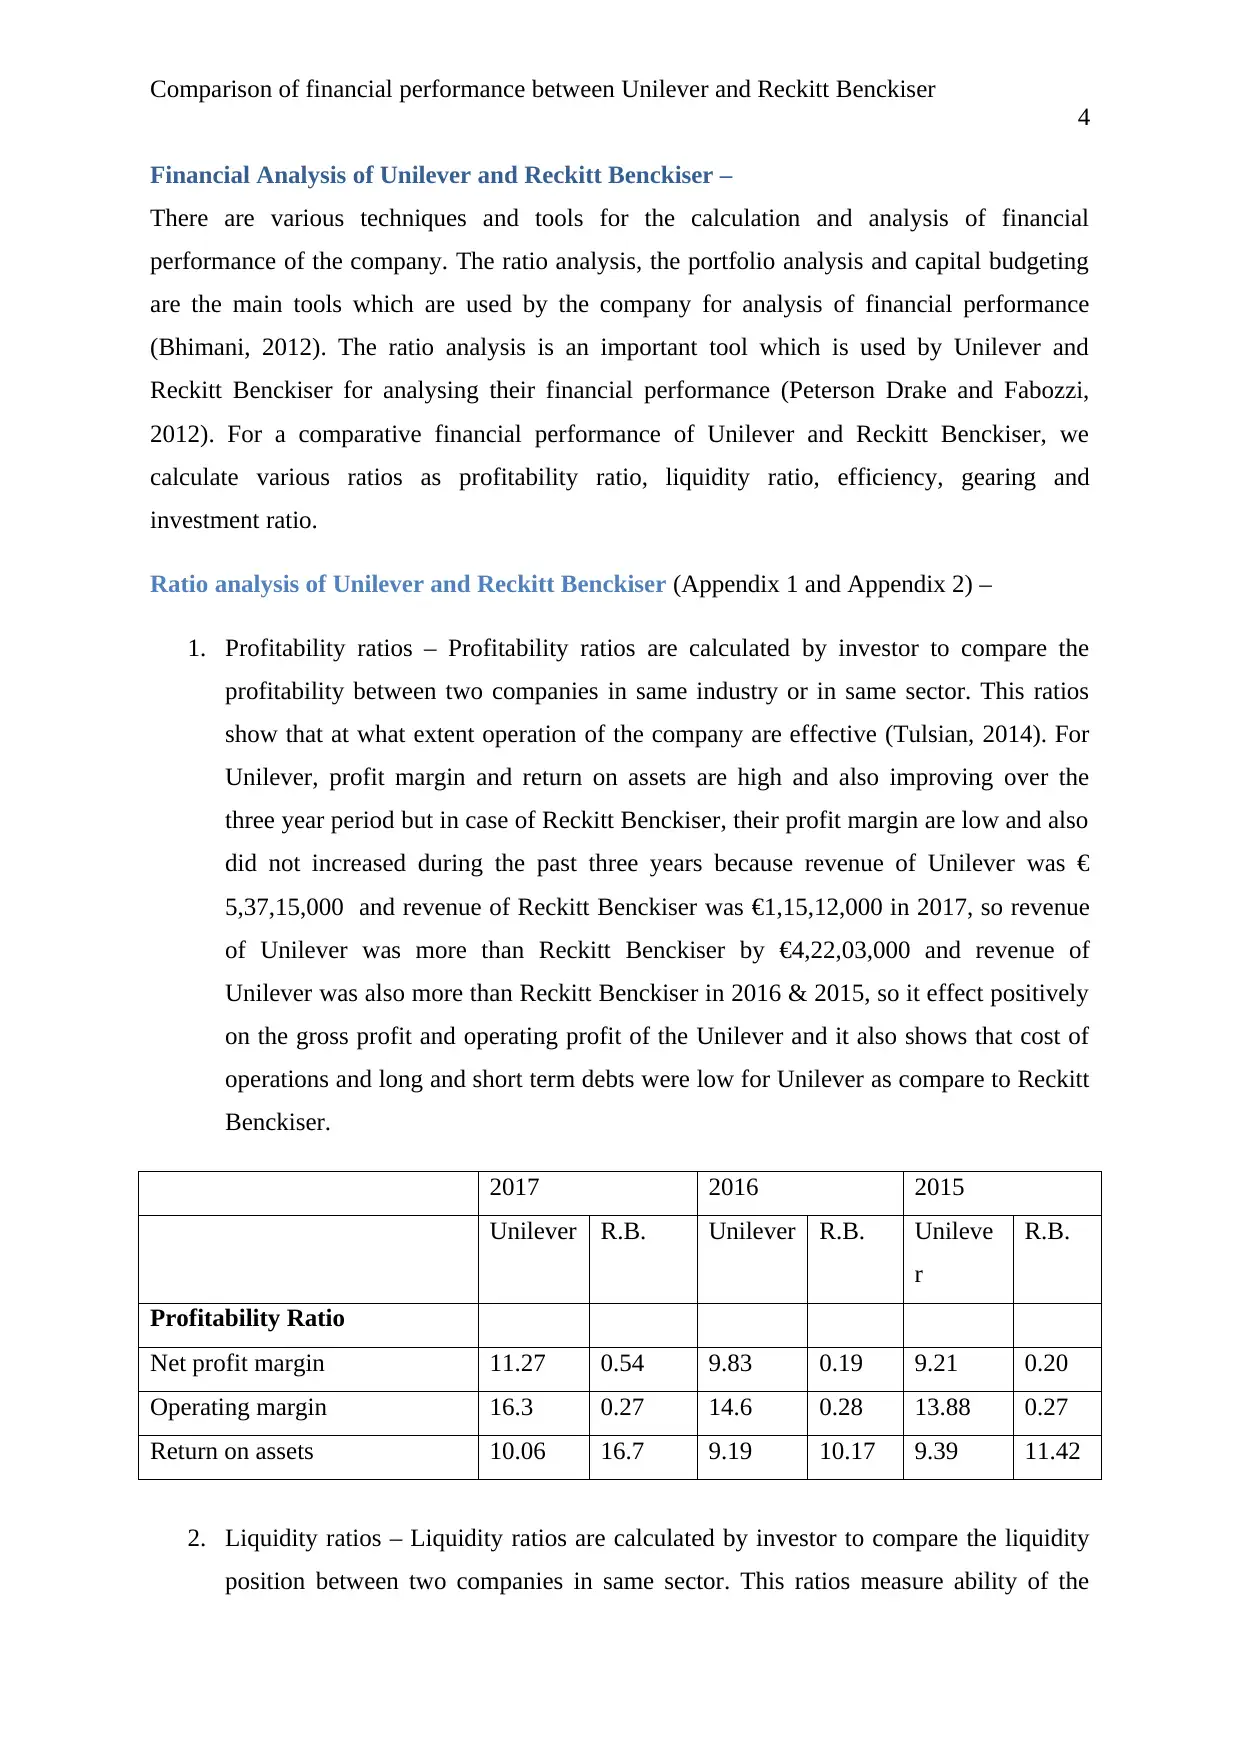
1. Profitability ratios – Profitability ratios are calculated by investor to compare the
profitability between two companies in same industry or in same sector. This ratios
show that at what extent operation of the company are effective (Tulsian, 2014). For
Unilever, profit margin and return on assets are high and also improving over the
three year period but in case of Reckitt Benckiser, their profit margin are low and also
did not increased during the past three years because revenue of Unilever was €
5,37,15,000 and revenue of Reckitt Benckiser was €1,15,12,000 in 2017, so revenue
of Unilever was more than Reckitt Benckiser by €4,22,03,000 and revenue of
Unilever was also more than Reckitt Benckiser in 2016 & 2015, so it effect positively
on the gross profit and operating profit of the Unilever and it also shows that cost of
operations and long and short term debts were low for Unilever as compare to Reckitt
Benckiser.
2017 2016 2015
Unilever R.B. Unilever R.B. Unileve
r
R.B.
Profitability Ratio
Net profit margin 11.27 0.54 9.83 0.19 9.21 0.20
Operating margin 16.3 0.27 14.6 0.28 13.88 0.27
Return on assets 10.06 16.7 9.19 10.17 9.39 11.42
2. Liquidity ratios – Liquidity ratios are calculated by investor to compare the liquidity
position between two companies in same sector. This ratios measure ability of the
4
Financial Analysis of Unilever and Reckitt Benckiser –
There are various techniques and tools for the calculation and analysis of financial
performance of the company. The ratio analysis, the portfolio analysis and capital budgeting
are the main tools which are used by the company for analysis of financial performance
(Bhimani, 2012). The ratio analysis is an important tool which is used by Unilever and
Reckitt Benckiser for analysing their financial performance (Peterson Drake and Fabozzi,
2012). For a comparative financial performance of Unilever and Reckitt Benckiser, we
calculate various ratios as profitability ratio, liquidity ratio, efficiency, gearing and
investment ratio.
Ratio analysis of Unilever and Reckitt Benckiser (Appendix 1 and Appendix 2) –
1. Profitability ratios – Profitability ratios are calculated by investor to compare the
profitability between two companies in same industry or in same sector. This ratios
show that at what extent operation of the company are effective (Tulsian, 2014). For
Unilever, profit margin and return on assets are high and also improving over the
three year period but in case of Reckitt Benckiser, their profit margin are low and also
did not increased during the past three years because revenue of Unilever was €
5,37,15,000 and revenue of Reckitt Benckiser was €1,15,12,000 in 2017, so revenue
of Unilever was more than Reckitt Benckiser by €4,22,03,000 and revenue of
Unilever was also more than Reckitt Benckiser in 2016 & 2015, so it effect positively
on the gross profit and operating profit of the Unilever and it also shows that cost of
operations and long and short term debts were low for Unilever as compare to Reckitt
Benckiser.
2017 2016 2015
Unilever R.B. Unilever R.B. Unileve
r
R.B.
Profitability Ratio
Net profit margin 11.27 0.54 9.83 0.19 9.21 0.20
Operating margin 16.3 0.27 14.6 0.28 13.88 0.27
Return on assets 10.06 16.7 9.19 10.17 9.39 11.42
2. Liquidity ratios – Liquidity ratios are calculated by investor to compare the liquidity
position between two companies in same sector. This ratios measure ability of the

Comparison of financial performance between Unilever and Reckitt Benckiser
5
company to repay its short term obligations (Brigham and Houston, 2012). Ideal
current ratio is 2: 1. In 2015 and 2016, Unilever had more ability to repay its short
term obligations as compare to Reckitt Benckiser because Unilever’s current assets I
2016 was €1,38,84,000 and current liabilities was €2,05,56,000, so there ratio were
0.68 and current assets of Reckitt Benckiser was €34,50,000 and current liabilities
were €54,01,000, so there ratio was 0.64, so it shows that Unilever had more ability to
repay its short term obligations but in 2017, Unilever had 0.73 ability to repay its
short term obligations whereas, Reckitt Benckiser had 0.82 ability to repay its short
term obligations, so the company grew faster from 2016 to 2017 because in 2017
Reckitt Benckiser had current assets €54,24,000 and current liabilities €65,76,000,
current assets were less than current liabilities only by €11,52,000 whereas currents
assets of Unilever was €1,69,83,000 and its current liabilities were €2,31,77,000,
which is more by current assets by €61,94,000, so it shows that Reckitt Benckiser had
more ability to manage its short term obligations as compare to Unilever in 2017.
2017 2016 2015
Liquidity Ratio Unilever R.B. Unilever R.B. Unileve
r
R.B.
Current Ratio 0.73 0.82 0.68 0.64 0.63 0.57
Quick Ratio 0.56 0.64 0.47 0.50 0.63 0.44
3. Efficiency Ratio – This ratio is used by the investor to measure the financial
performance of the company in which they want to invest. This ratios measure the
ability of company to use it assets and at what extent company have ability to manage
its liabilities. It also measure in how many time firms are able to manage its business
through assets and liabilities (Leach, 2010). So, the efficiency level of both company
decline during the past three years. Efficiency ratio of Unilever decline less as
compare to the efficiency ratio of Reckitt Benckiser from 2016 to 2017 because
receivables of Unilever was €42,04,000 and its total current assets were €1,69,83,000
in 2017 which was increased from 2016 to 2017 by €30,99,000 and total current
assets of Reckitt Benckiser in 2017 was €54,24,000 and in 2016 was 34,50,000, so it
was increased from 2016 to 2017 by €19,74,000, it shows that increment in total
current assets were more in Unilever. So, as per ratio analysis of both companies,
⊘ This is a preview!⊘
Do you want full access?
Subscribe today to unlock all pages.
Trusted by 1+ million students worldwide

Comparison of financial performance between Unilever and Reckitt Benckiser
6
Unilever are more efficient as compare to Reckitt Benckiser to manage is liabilities
and the company also has more ability to use it assets.
2017 2016 2015
Efficiency Ratio Unilever R.B. Unilever R.B. Unileve
r
R.B.
Inventory turnover ratio 7.41 5.55 7.02 5.07 7.31 5.09
Accounts receivable turnover
ratio
9.41 6.41 9.73 6.54 10.58 6.80
Assets turnover ratio 0.89 0.31 0.93 0.53 1.02 0.58
4. Gearing Ratio – This ratio is used by the investor to measure the financial
performance of the company and it helps them to know that which company is best to
invest. This ratio show how much debts and equity used by the company to funding
for managing its business. If equity is more than debt then it show that company has
less risk and able to manage its business by using debts and equity (Fleisher and
Bensoussan, 2015). In both companies, debts equity ratio rapidly increased from 2015
to 2017 but Unilever had less risk as compare to Reckitt Benckiser in because in 2017
Unilever’s debts were €1,63,42,000 and equity were €1,36,29,000, which was less
than debt by €27,13,000 and debts were more than equity and Reckitt Benckiser’s
debts were 1,15,27,000 and its equity were €1,35,33,000, which shows that equity is
more than debts. Unilever has more assets than equity as compare to Reckitt
Benckiser; it means that they have more ability to repay debts by using its assets as
compare to Reckitt Benckiser because Unilever assets were €6,02,85,000 and its
equity was €1,36,29,000 and Reckitt Benckiser’s assets were €3,70,13,000 and its
equity was €1,35,33,000, so it shows that Unilever had more assets than equity as
compare to Reckitt Benckiser in 2017, so it affect positively on the performance of
Unilever.
2017 2016 2015
Gearing Ratio Unilever R.B. Unilever R.B. Unileve
r
R.B.
Debt equity ratio 1.19 0.85 0.67 0.095 0.63 0.097
Equity asset ratio 0.23 0.37 0.29 0.47 0.30 0.45
Paraphrase This Document
Need a fresh take? Get an instant paraphrase of this document with our AI Paraphraser

Comparison of financial performance between Unilever and Reckitt Benckiser
7
5. Investment Ratio – This is most important ratios which are used by the investor for
measuring the position of the company. They also get to know that in which company
they should invest (Schmidlin, 2010). This ratio measure that what return company
give when investing in the company by investor and it also help the investor to get
know dividend per share, dividend yield and what is the ratio between price and their
earning, so it measure either investor should invest in the company or not
(Papadopoulos, 2010). For Unilever, investment ratios were rapidly increase from
2015 to 2017 and investment ratios for Reckitt Benckiser also increased during the
past three years but Unilever gave high return as compare to Reckitt Benckiser
because earning per share was less as compare to Reckitt Benckiser, price earning s
ratio was more as compare to Reckitt Benckiser and dividend pay- out ratio also more
in Unilever as compare to Reckitt Benckiser in 2017, it means returns and dividend
are more in Unilever than Reckitt Benckiser.
2017 2016 2015
Investment Ratio Unilever R.B. Unilever R.B. Unileve
r
R.B.
Earnings Per Share 2.24 8.67 2.03 2.56 1.95 2.40
Price Earnings Ratio 24.13 7.71 18.84 24.29 20.05 21.75
Dividend Pay-out Ratio 12.5 0.19 62 0.60 55.90 0.58
Dividend Yield Ratio 0.51 2.55 3.29 2.46 2.79 2.66
Book Value Per Share 1.06 0.25 1.55 1.80 1.61 1.65
Trends refer as change in a process, output or situation or in other words it refers as to move
in different direction over time. Trends change or prevails because growth of every company
fluctuating and they do not know what will be the future price of the company (Barros, 2009).
Corporate Strategy and the future prospects –
Every firm has to set their corporate strategy for achieving the common goal of the company
and they take day to day actions in order to achieve their corporate strategy. Corporate

Comparison of financial performance between Unilever and Reckitt Benckiser
8
strategy will have three components as short term, medium term and long term (Wit and
Meyer, 2010). Short term refer as what company has to achieve in one year or in less than
one year from setting up corporate strategy, it can be updated on annually basis. Medium
term refers as what company has to achieve between 2 to 3 years in order to achieve it
common goal and it can be updated to reflect development. Long term corporate strategy
refers as what company has to achieve in next 5 years towards the achievement of their
common goal (McCabe, 2010).
Corporate strategy of Unilever – The main strategy of Unilever is growing the core,
developing the channels and evolving the portfolio. It helps the company to deliver growth in
a competitive world or a fast changing world. Their strategies are:
1. Wining with brands and innovation – They believe that rapid innovation is helpful to
respond to the fragmentation effectively in rapidly changing market and changing
expectation and needs in consumer good industry. Innovation varies as per the market
requirements and brand strategies. It also help the company Research and
development mission and increase brand value through innovate and new
technologies.
2. Winning through continuous improvement – They also believe that continuous
improvement is the main key for success and wining in business. By using sharper
financial discipline governing overhead spending and zero based budgeting approach,
company will reduce their cost of operations. They also apply smart programmes and
net revenue management programmes which help them in enhancing their revenue
and profit. They also focus on maximising return for their investors.
3. Delivering long term value to investor – The company focus on how they can deliver
long term value to investor or maximising return for them. It will help the company to
increase its performance and achieving their goals and objectives.
4. Sustainability focused – The Company focuses on the sustainability and sustainable
development. It will help the company to create effective culture, improving the
financial performance of the company and to maximising the value for their
shareholders (Unilever Strategy, 2019).
Corporate strategy of Reckitt Benckiser – Strategy of Reckitt Benckiser has always been
clear, which help the company to achieving its objectives. They mainly focus on building
a better business, for this company has four pillars for achieving their objectives and it
⊘ This is a preview!⊘
Do you want full access?
Subscribe today to unlock all pages.
Trusted by 1+ million students worldwide

Comparison of financial performance between Unilever and Reckitt Benckiser
9
focus on better business in faster growing markets (Reckitt Benckiser Reshapes Company
Strategy, 2012). Company’s strategies are:
1. To maintain effective organization culture and they believes that their people are what
makes them outperform, so respecting them, try to developing their skills and
knowledge, motivate them and keeping them safe.
2. They invest a huge amount in 20 market leading power brands, so it will help them in
increasing their revenue and also helps in increasing their growth and profits.
3. They focus on controlling their cost and high margin initiatives through virtuous
earnings model, so it will help the company to expand or develop their revenue and
operating margin.
4. Company will focus on more innovative and sustainable products.
5. For achieving or maintaining better environment within an organization, they focus on
reducing greenhouse gas emissions, developed energy and efficiency programs,
product innovation and investing in renewable resources (Rb Annual report 2017,
2019).
Future prospects of Unilever – Company’s future prospect is to increase their earnings by 6.1
per cent by focusing on enhancing efficiency of cost and increasing their revenue. As per
analysts, growth of the company will continuously increase and return per equity of Unilever
will also increase than industry average because of attributes related to earnings identified in
their margin analysis. Another future prospect of company is to develop innovation, more
strategies for the achievement of its goals and objectives, advertising and focus on research
and development of their products. As company is single holding company so it will brings
more flexibility and greater simplicity to make changes in future and shareholder will share
maximum dividend. Unilever will continue to enhance its earning and declare dividend for
the shareholder’s in euros, there will be no change in the policy related to dividend and it will
be more attractive, sustainable and growing for their shareholders. Company’s another future
prospect is a high level of collaboration and partnership with others, it will help the company
I their transformational change and high level of sustainability in their products. So,
company’s future prospects are more bright and attractive by continuous improvement and
they also believe in creating value for their investors (Building the Unilever of the future,
2018).
Paraphrase This Document
Need a fresh take? Get an instant paraphrase of this document with our AI Paraphraser

Comparison of financial performance between Unilever and Reckitt Benckiser
10
Future Prospects of Reckitt Benckiser – Company’s future prospects are to increase their
revenue through advanced science and technology, so it will result stronger, lighter and shape
shifting material and it will impact the future household products. Another future prospect is
to improving manufacturing cost and quality by increasing functionality of manufacturing the
robotics and the shrinking cost. Company will decrease their cost of production by 3D
printing. It’s another future prospect is to by 2021, earnings of the company will increase by
4.23 per cent and its expected return on investment will also rise to 16.56 per cent. This
shows that Reckitt Benckiser has producing high profits for their investors as they have also
approach to reinvesting into business. As per the analysts, they expect that annual earnings of
the company will decline in next couple of years (How do analysts see Reckitt Benckiser
Group plc performing in the next couple of years, 2018). However, they also forecast that
company will outperform the market and advice to the investor to hold their shares in the
company. Company will increase their dividend by 3.05 per cent (Reckitt Benckiser, 2019).
Conclusion and Recommendations –
The consumer goods sector includes a category of companies which relate to products
purchased by an individual rather than by industries and manufactures. Unilever and Reckitt
Benckiser are the largest company from the consumer goods sector. They deliver their
products and services directly to the customers with high level of innovation. For Unilever,
main source of revenue is personal care products and their products related to food and
beverages. For Reckitt Benckiser, main source of revenue is their health and home products.
Financial performance of any company is the main factor which affects the productivity,
performance and achievement in their goals and objectives. We measures financial
performance of both companies through ratio analysis or calculating various ratios from the
financial statement of both company. Financial statement refers as the combination of three
report of every organization It includes income statement, which shows net income of the
company, balance sheet, which shows financial position of the company and cash flow
statement, which shows inflow and outflow of the company during a year. Ratio analysis is
an important technique which are used by the company or an investor to measure financial
performance of the company or to get know whether they should invest in that company or
not and it include profitability ratios, liquidity ratio, efficiency ratio, gearing ratio and
investment ratios. Profitability ratios show that at what extent operations of the company are
effective and it also helps in knowing the profit or profit margin of the company. Liquidity

Comparison of financial performance between Unilever and Reckitt Benckiser
11
ratios measure ability of the company to repay its short term obligations. Efficiency ratios
measure the ability of the company to use its assets and at what extent company is able to
manage its liabilities and at what time company is able to manage its liabilities. Gearing
ratios show how much debts and equity used by the company in funding for managing their
business. Investment ratios measure that what return company give when investing in the
company by the investor and it also helps the investor to get to know either they should invest
in that company or not.
By calculating financial ratios for Unilever and Reckitt Benckiser, we find that profit margin
and return on assets of Unilever are high and also improving during the past three years and
profit margin and return on assets of Reckitt Benckiser are comparatively low and did not
increase during the past three years, so we can say that cost of operations for Unilever are low
as compare to Reckitt Benckiser. Liquidity position of Unilever was good than Reckitt
Benckiser in 2015 and 2016 but in 2017, liquidity position of Reckitt Benckiser was good
than Unilever, it means company had more ability to pay its short term obligations. Unilever
was more efficient as compare to Rb to manage its assets and liabilities during the past three
years. During the past years, debts and equity ratios of both companies increased but Unilever
has more assets than equity, it means company has more ability to repay its debts by using
assets of the company. I both companies, investment ratios were rapidly increase from 2015
to 2017 but Unilever gave high return to their investors because its price earning are more
than Reckitt Benckiser. There are various different corporate strategies for both the
companies. Unilever has various strategies for achieving its common goals and increasing
their performance, productivity and growth in future. Main corporate strategies of Unilever
include growing the core, developing the channels an evolving the portfolio. There are some
other strategies as they believe in winning with brands and innovation, delivering long term
value to their investors, winning through continuous improvement in their products, services
which are delivering to their customers and they also focus on maintaining sustainable
products. Corporate strategies of Reckitt Benckiser are to focus on building a better business,
controlling their costs, more innovative and sustainable products, maintaining effective
culture and focus on reducing greenhouse gas emissions and developed energy and efficiency
programs.
Hence, as per the above analysis we can say that investor should buy shares of Unilever Plc
because by calculating their ratios we find that Unilever has more profit margin, return on
⊘ This is a preview!⊘
Do you want full access?
Subscribe today to unlock all pages.
Trusted by 1+ million students worldwide
1 out of 22
Related Documents


Your All-in-One AI-Powered Toolkit for Academic Success.
+13062052269
info@desklib.com
Available 24*7 on WhatsApp / Email
![[object Object]](/_next/static/media/star-bottom.7253800d.svg)
Unlock your academic potential
Copyright © 2020–2026 A2Z Services. All Rights Reserved. Developed and managed by ZUCOL.