CMHA OM005: Productivity Matrices Analysis of Emergency Department
VerifiedAdded on 2022/10/02
|6
|932
|423
Report
AI Summary
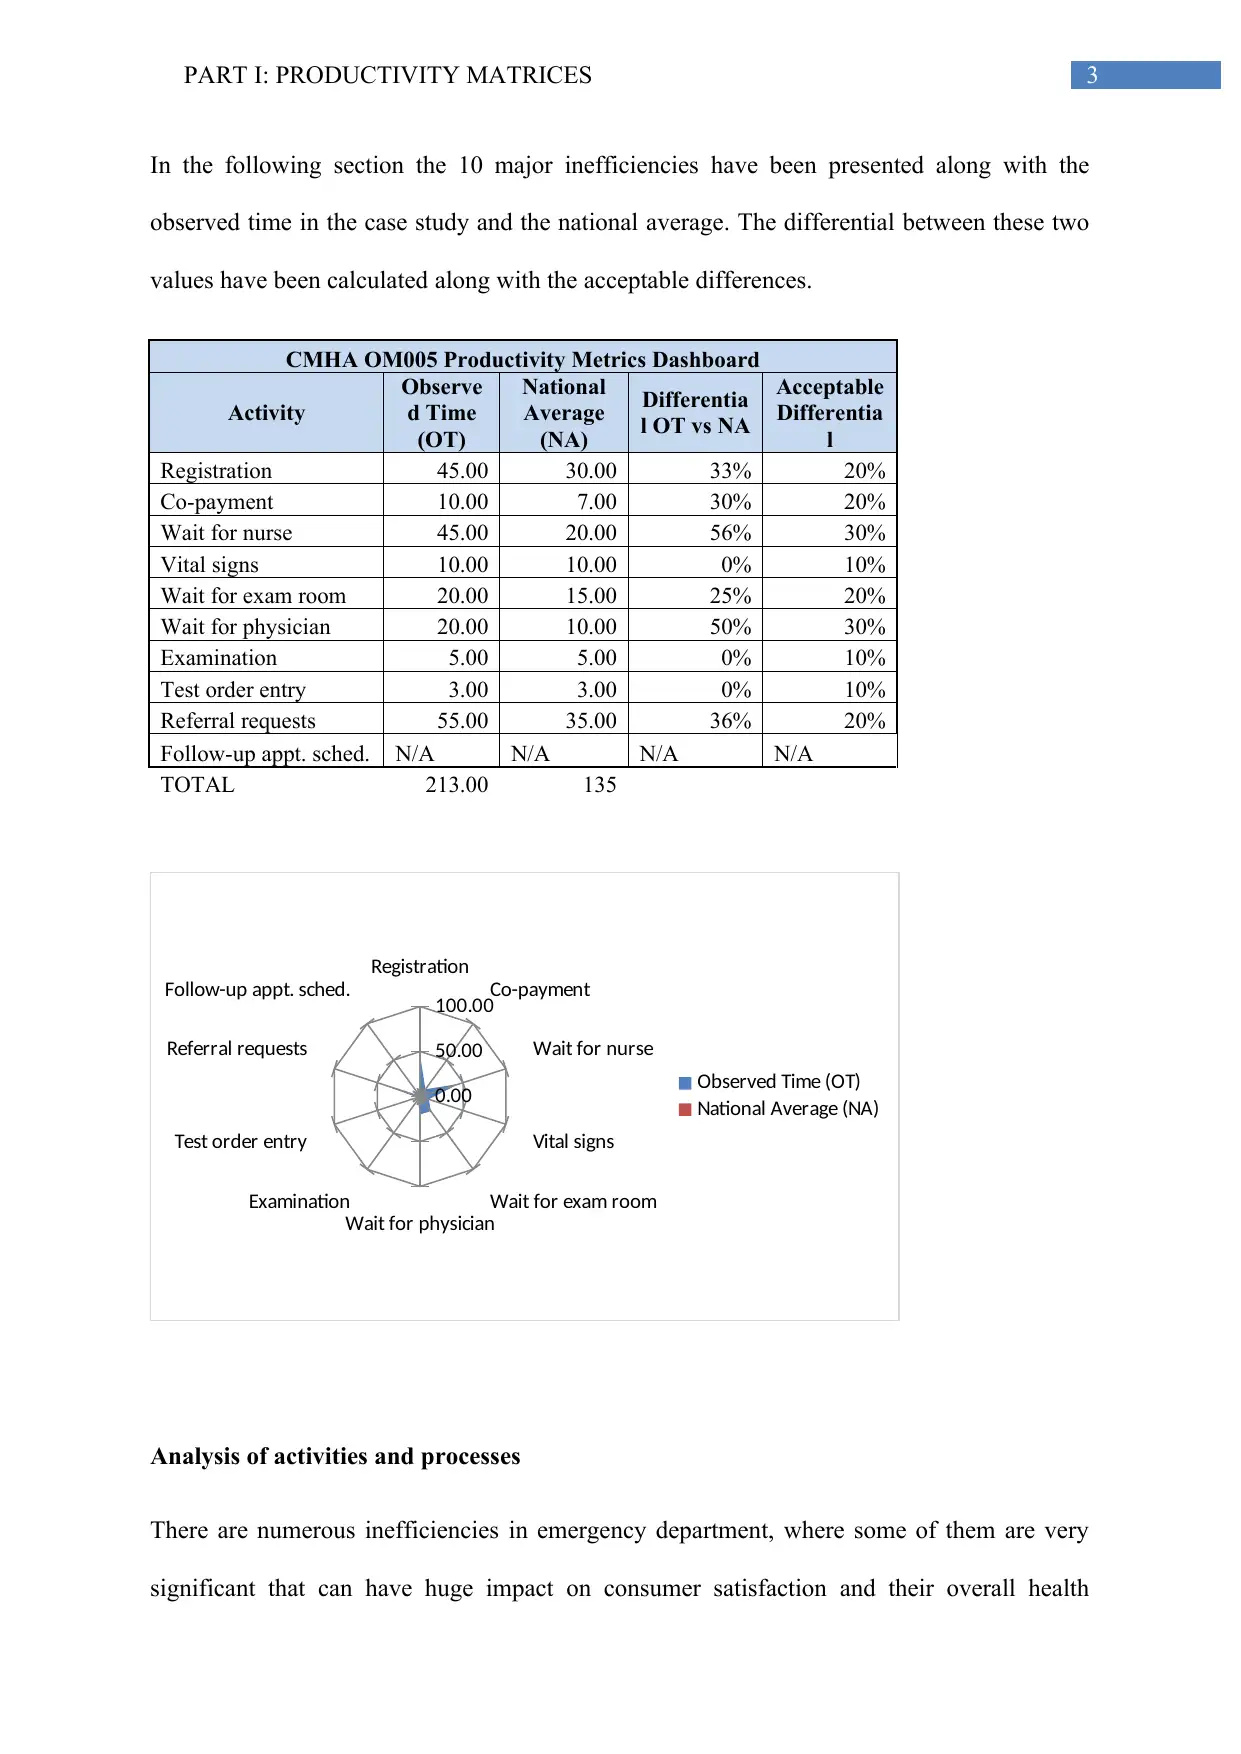
This report evaluates the productivity metrics of United General Hospital's emergency department based on a case study of a patient's experience. The analysis identifies ten major inefficiencies, including delays in registration, co-payment processing, waiting for nurses and physicians, and referral requests. The report compares observed times for these activities with national averages, calculating differentials and acceptable differences. It then focuses on the five most inefficient areas, providing rationales for their selection and reflecting the discrepancies with national benchmarks. The findings highlight significant areas for improvement, aiming to enhance patient satisfaction and overall healthcare delivery within the emergency department. The report also includes a bibliography of relevant sources to support the analysis.

Running head: PART I: PRODUCTIVITY MATRICES
Part I: Productivity Matrices
Name of the Student
Name of the University
Author note
Part I: Productivity Matrices
Name of the Student
Name of the University
Author note
Paraphrase This Document
Need a fresh take? Get an instant paraphrase of this document with our AI Paraphraser

2PART I: PRODUCTIVITY MATRICES
Introduction
The purpose of this report is to analyse the current inefficiencies of procedures in United
General’s emergency department. For this the Ron’s case study has been analysed through his
experience summary. The inefficiencies of activities have been analysed along allow with the
5 major procedures amongst them. After comparing the performance with national standard,
the differential has been measured with acceptable differentials. The aim is to find 5 major
procedural faults in which significant improvement is required in United General’s
emergency department.
Activities or processes carried out
From the case study analysis of Ron’s Experience, it has been found that there are some
major and some minor performance inefficiency issues present in the operational structure of
United General’s emergency department. From the very beginning of the registration to the
final discharge, the major performance issues are delay or wait time. Among those delays the
10 major performance issues found in this case are:
Delay in Registration
Delay in Co-payment
Wait for nurse
Wait for Vital signs
Wait for exam room
Wait for physician
Wait for Examination
Wait for Test order entry
Wait for Referral requests
Wait for Follow-up appointment scheduled.

3PART I: PRODUCTIVITY MATRICES
In the following section the 10 major inefficiencies have been presented along with the
observed time in the case study and the national average. The differential between these two
values have been calculated along with the acceptable differences.
CMHA OM005 Productivity Metrics Dashboard
Activity
Observe
d Time
(OT)
National
Average
(NA)
Differentia
l OT vs NA
Acceptable
Differentia
l
Registration 45.00 30.00 33% 20%
Co-payment 10.00 7.00 30% 20%
Wait for nurse 45.00 20.00 56% 30%
Vital signs 10.00 10.00 0% 10%
Wait for exam room 20.00 15.00 25% 20%
Wait for physician 20.00 10.00 50% 30%
Examination 5.00 5.00 0% 10%
Test order entry 3.00 3.00 0% 10%
Referral requests 55.00 35.00 36% 20%
Follow-up appt. sched. N/A N/A N/A N/A
TOTAL 213.00 135
Registration
Co-payment
Wait for nurse
Vital signs
Wait for exam room
Wait for physician
Examination
Test order entry
Referral requests
Follow-up appt. sched.
0.00
50.00
100.00
Observed Time (OT)
National Average (NA)
Analysis of activities and processes
There are numerous inefficiencies in emergency department, where some of them are very
significant that can have huge impact on consumer satisfaction and their overall health
You're viewing a preview
Unlock full access by subscribing today!

4PART I: PRODUCTIVITY MATRICES
improvement. In the following section the 5 most inefficient performance attribute have been
presented with the rationale for this selection.
Wait for nurse: It depends on the work efficiency of the nurses, availability of the nursing
workforce and wok engagement of the nursing stuffs (Bergeron, 2017)
Wait for physician: It depends on the work efficiency of the physicians, availability of the
medical professionals and wok engagement of the general physicians
Referral requests: It depends on the work efficiency of clinical technicians, availability of the
technical workforce and wok engagement of the additional healthcare stuffs (Elg, Palmberg
Broryd & Kollberg, 2013)
Registration: It depends on the work efficiency of the back office and reception stuffs,
availability of effective electronics and communication system and communication efficiency
within the healthcare workforce
Co-payment: It depends on the understanding of the financial workers availability of effective
electronics and communication system and communication efficiency within the healthcare
workforce
Reflect the inefficiency with the national average
Wait for nurse: The actual differential is 56% from the national average
Wait for physician: The actual differential is 50% from the national average
Referral requests: The actual differential is 36% from the national average
Registration: The actual differential is 33% from the national average
Co-payment: The actual differential is 30% from the national average
Paraphrase This Document
Need a fresh take? Get an instant paraphrase of this document with our AI Paraphraser

5PART I: PRODUCTIVITY MATRICES
Acceptable differences
The acceptable differences have been measured through considering national standard and
national average performance of emergency department operations. These standards have
been chosen through using the benchmarks determined by the Centers for Medicare and
Medicaid Services.
Wait for nurse: The actual differential is 53% where the acceptable differential is 20%
Wait for physician: The actual differential is 53% where the acceptable differential is 20%
Referral requests: The actual differential is 36% where the acceptable differential is 20%
Registration: The actual differential is 33% where the acceptable differential is 20%
Co-payment: The actual differential is 30% where the acceptable differential is 20%

6PART I: PRODUCTIVITY MATRICES
Bibliography
Bergeron, B. P. (2017). Performance management in healthcare: from key performance
indicators to balanced scorecard. Productivity Press.
Elg, M., Palmberg Broryd, K., & Kollberg, B. (2013). Performance measurement to drive
improvements in healthcare practice. International Journal of Operations &
Production Management, 33(11/12), 1623-1651.
Meena, K., & Thakkar, J. (2014). Development of balanced scorecard for healthcare using
interpretive structural modeling and analytic network process. Journal of Advances in
Management Research, 11(3), 232-256.
Shukri, N. F. M., & Ramli, A. (2015). Organizational structure and performances of
responsible Malaysian healthcare providers: A balanced scorecard
perspective. Procedia Economics and Finance, 28, 202-212.
You're viewing a preview
Unlock full access by subscribing today!
1 out of 6

Your All-in-One AI-Powered Toolkit for Academic Success.
+13062052269
info@desklib.com
Available 24*7 on WhatsApp / Email
Unlock your academic potential
© 2024 | Zucol Services PVT LTD | All rights reserved.