In-Depth Financial Analysis and Performance of Unity Foods Limited
VerifiedAdded on 2021/08/23
|15
|3006
|182
Project
AI Summary
This project offers a comprehensive financial analysis of Unity Foods Limited (UFL), a prominent agri-business company in Pakistan. The analysis encompasses a detailed overview of UFL's business segments, including edible oil, animal feeds, specialty fats, and flour, and its market position as the second-largest listed consumer company in terms of sales. The project delves into UFL's financial performance, examining key aspects such as revenue, market capitalization, profitability, and credit rating, alongside an economic overview of Pakistan's macro-economic environment. A SWOT analysis is presented, highlighting UFL's strengths, weaknesses, opportunities, and threats. Additionally, a PEST analysis evaluates the political, economic, social, and technological factors influencing the company. The project includes a thorough ratio analysis, interpreting gross margin, operating margin, net profit margin, current ratio, asset turnover, return on equity, and return on assets across multiple fiscal years. Industry comparisons are made to assess UFL's performance relative to competitors, with an analysis of earnings per share and M-score to evaluate the quality of earnings and potential for earnings manipulation. The project provides valuable insights into UFL's financial stability and market competitiveness.
STUDENT NAME: XYZ
REGISTERATION NUMBER: 0000
SUBMITTED TO: Sir Khurram Ali
SUBMISSION OF: Final project
INTRODUCTION
REGISTERATION NUMBER: 0000
SUBMITTED TO: Sir Khurram Ali
SUBMISSION OF: Final project
INTRODUCTION
Paraphrase This Document
Need a fresh take? Get an instant paraphrase of this document with our AI Paraphraser
Company overview:
Unity Foods Limited operates as an agri-business company in Pakistan. The company imports oil
seeds; extracts, refines, and markets edible oil; and processes ancillary and by-products. It offers
cooking, canola, banaspati, and palm oils under the Dastak, Ehtimam, Zauqeen, Lagan and
Parwan brands. The company also provides specialty fats, such as chocolate, confectionery, and
bakery fats for the industrial bakery, hotel, restaurant, and café applications under the Unity
brand. In addition, it offers wheat atta; and animal feed meal products, including soybean,
canola, and other oilseed meals, as well as soya pellets for poultry and livestock sector. The
company was formerly known as Taha Spinning Mills Limited and changed its name to Unity
Foods Limited in September 2017. Unity Foods Limited was incorporated in 1991 and is based
in Karachi, Pakistan.
Business segments:
1. Edible oil
2. Animal feeds
3. Specialty fats
4. Flour
Company rank:
Unity currently ranking as 2nd largest listed consumer company in term of sales. Unity is one of the top
brands in Pakistan because the company has various certifications that assure customers about the
quality of their products.
Company credit rating:
On April 2021 VIS credit rating Company limited they upgraded entity rating of UFL from
A- /A-2 to A / A-2. The long term rating of A’ signifies good credit quality whereas A-2
signifies good certainty of timely payment.
Company performance:
The company liquidity factor and fundamentals are sound. Access to capital market is good. Risk
factors are small. Outlook on the assigned rating is stable. The company show a positive demand
prospects for edible oil in the domestic market. High competitive intensity, low barriers to entry,
and volatility in raw material prices and exchange rate continue to remain risk factor affecting
the business risk profile of the company.
Company profitability:
During the ongoing fiscal year it shows an improvement in company profitability profile and
internal cash flow generation. Volumetric increase in sale is the primary reason for higher
profitability. Earning have grown by 81% per year over past 5 years. They generated revenue
PKR 71.92B and market capitalization by PKR 44.55B. They expect profitability of the company
to grow at 3 year CAGR of 201%.
Economic overview:
On the Macro-economic front, the country is witnessing increase in exports and inward
remittances from overseas Pakistanis. This, coupled with the fact that IMF program stands
resumed and Pakistan has raised as debt, an additional USD 2.5 billion from international
market, has provided much needed stability to Pak Rupee. In the last quarter, Pak Rupee has
appreciated by more than 4% against the US dollar. Interest rates have remained stable in the last
quarter, however, inflation remains a challenge. Government has recently made changes at the
top in the Ministry of Finance that indicate that its focus is now on growth. We, therefore, expect
the interest rates to remain stable and in the best case scenario, the rates may even come down.
Company export and import:
During Fiscal year 2020 the export sale is 1435,000,796 and current year export till March 31
2021 is 310,075,496. While on the other hand UFL is a leading import company in Pakistan.
SWOT analysis:
Strengths: Largest palm oil importer, Large capacity of oil seeds processing sectors like
extraction and refining sector, Conductive climatic condition for the production of oilseeds,
Stable demand, Well-established relationships, large distribution system, outstanding
customer service and multiple variants.
Weakness: High reliance on imports, huge capital need, Lack of required regulations by the
government of Pakistan, Highly fragmented sector, high production cost, and inadequate seed
technology.
Opportunities: Emerging market, reduced interest rate, vast distribution, reduced additional
custom duty, new product categories, changing consumer taste based on health
considerations, allowing new entrants in the market.
Threat: Covid 19, high restrictions to import, economic uncertainties, tight global supplies.
PEST analysis:
⊘ This is a preview!⊘
Do you want full access?
Subscribe today to unlock all pages.
Trusted by 1+ million students worldwide

Political: industrial law, foreign trade, environmental protection laws, taxation policy,
employment and government stability.
Economical: interest rate, inflation, disposable income.
Social: life style changes, level of education.
Technological: government spending on research, new discoveries and development,
Training and extension services.
Unity market share:
Total Pakistan edible oil consumption for 2020 is 5.42mn tons. Unity is targeting market share of
4% in edible oil. Edible oil market growth is estimated 6% per annum. Unity brand Dastak
placed in popular segment has 40% market share, whereas other unity brand like Moulvi, taaza
etc. placed in discounted segment have 50% market share. Unity Foods Limited approved
in principle acquisition of 31% shares of Sunridge Food at RS. 28 per share. It
may be noted that the company also holds 69% shares of Sunridge Food.
RATIO ANALYSIS
Paraphrase This Document
Need a fresh take? Get an instant paraphrase of this document with our AI Paraphraser
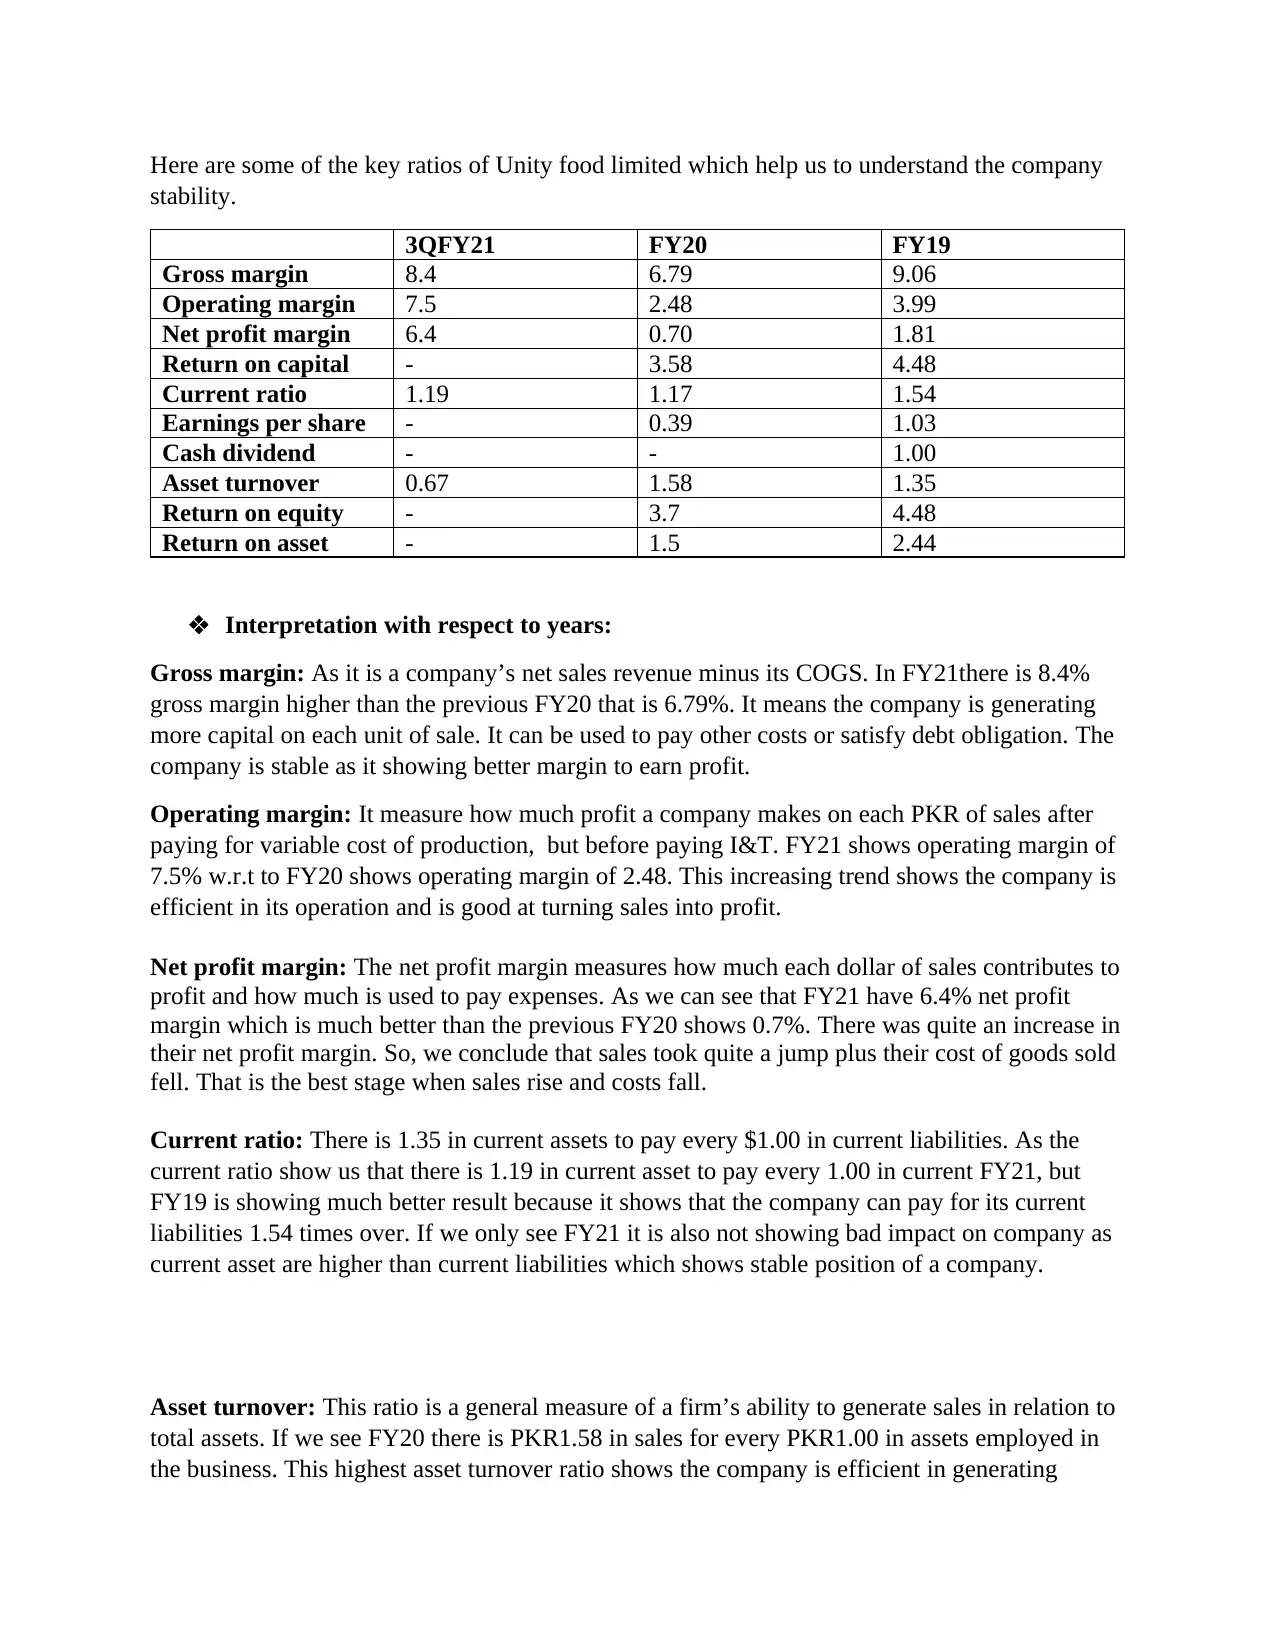
Here are some of the key ratios of Unity food limited which help us to understand the company
stability.
3QFY21 FY20 FY19
Gross margin 8.4 6.79 9.06
Operating margin 7.5 2.48 3.99
Net profit margin 6.4 0.70 1.81
Return on capital - 3.58 4.48
Current ratio 1.19 1.17 1.54
Earnings per share - 0.39 1.03
Cash dividend - - 1.00
Asset turnover 0.67 1.58 1.35
Return on equity - 3.7 4.48
Return on asset - 1.5 2.44
Interpretation with respect to years:
Gross margin: As it is a company’s net sales revenue minus its COGS. In FY21there is 8.4%
gross margin higher than the previous FY20 that is 6.79%. It means the company is generating
more capital on each unit of sale. It can be used to pay other costs or satisfy debt obligation. The
company is stable as it showing better margin to earn profit.
Operating margin: It measure how much profit a company makes on each PKR of sales after
paying for variable cost of production, but before paying I&T. FY21 shows operating margin of
7.5% w.r.t to FY20 shows operating margin of 2.48. This increasing trend shows the company is
efficient in its operation and is good at turning sales into profit.
Net profit margin: The net profit margin measures how much each dollar of sales contributes to
profit and how much is used to pay expenses. As we can see that FY21 have 6.4% net profit
margin which is much better than the previous FY20 shows 0.7%. There was quite an increase in
their net profit margin. So, we conclude that sales took quite a jump plus their cost of goods sold
fell. That is the best stage when sales rise and costs fall.
Current ratio: There is 1.35 in current assets to pay every $1.00 in current liabilities. As the
current ratio show us that there is 1.19 in current asset to pay every 1.00 in current FY21, but
FY19 is showing much better result because it shows that the company can pay for its current
liabilities 1.54 times over. If we only see FY21 it is also not showing bad impact on company as
current asset are higher than current liabilities which shows stable position of a company.
Asset turnover: This ratio is a general measure of a firm’s ability to generate sales in relation to
total assets. If we see FY20 there is PKR1.58 in sales for every PKR1.00 in assets employed in
the business. This highest asset turnover ratio shows the company is efficient in generating
revenues from its asset. Current FY21 shows result of 0.67 quarterly which means at the end of
the year it will rose up to very good level.
Return on equity: ROE measure profitability using resources provided by investors and
company earnings. As it shows that ROE decrease from 4.48 in 2019 to 3.37 in 2020. The reason
behind this fall is the decrease in profit margin for 2019 is 1.81 to 2020 is 0.7.
Return on asset: ROA is an indicator of how well a company utilizes its asset in term of
profitability. There is PKR1.15 in profit for every PKR1.00 in assets employed in the business
FY20. As it shoes FY19 is more efficient w.r.t to FY20 because it generate 2.44 times profit for
every PKR1 asset. If we see FY20 we can interpret that company is flourishing very well and the
management is doing their work effectively and efficiently.
Conclusion:
FY21 result showing better result as compare to its previous year which means the company is
working efficiently and going to earn more profit in upcoming years. The GP margin, operating
margin, and net profit margin all these are higher than the FY20. This is the reason we can say
this company is going to be earn higher earnings and become a most popular company in food
and personal care industry sector like other famous companies
.
INDUSTRY COMPARISION
UFL NESTLE UPFL FCEPL SCL NFL ISL PREMA INDUSTRY
⊘ This is a preview!⊘
Do you want full access?
Subscribe today to unlock all pages.
Trusted by 1+ million students worldwide
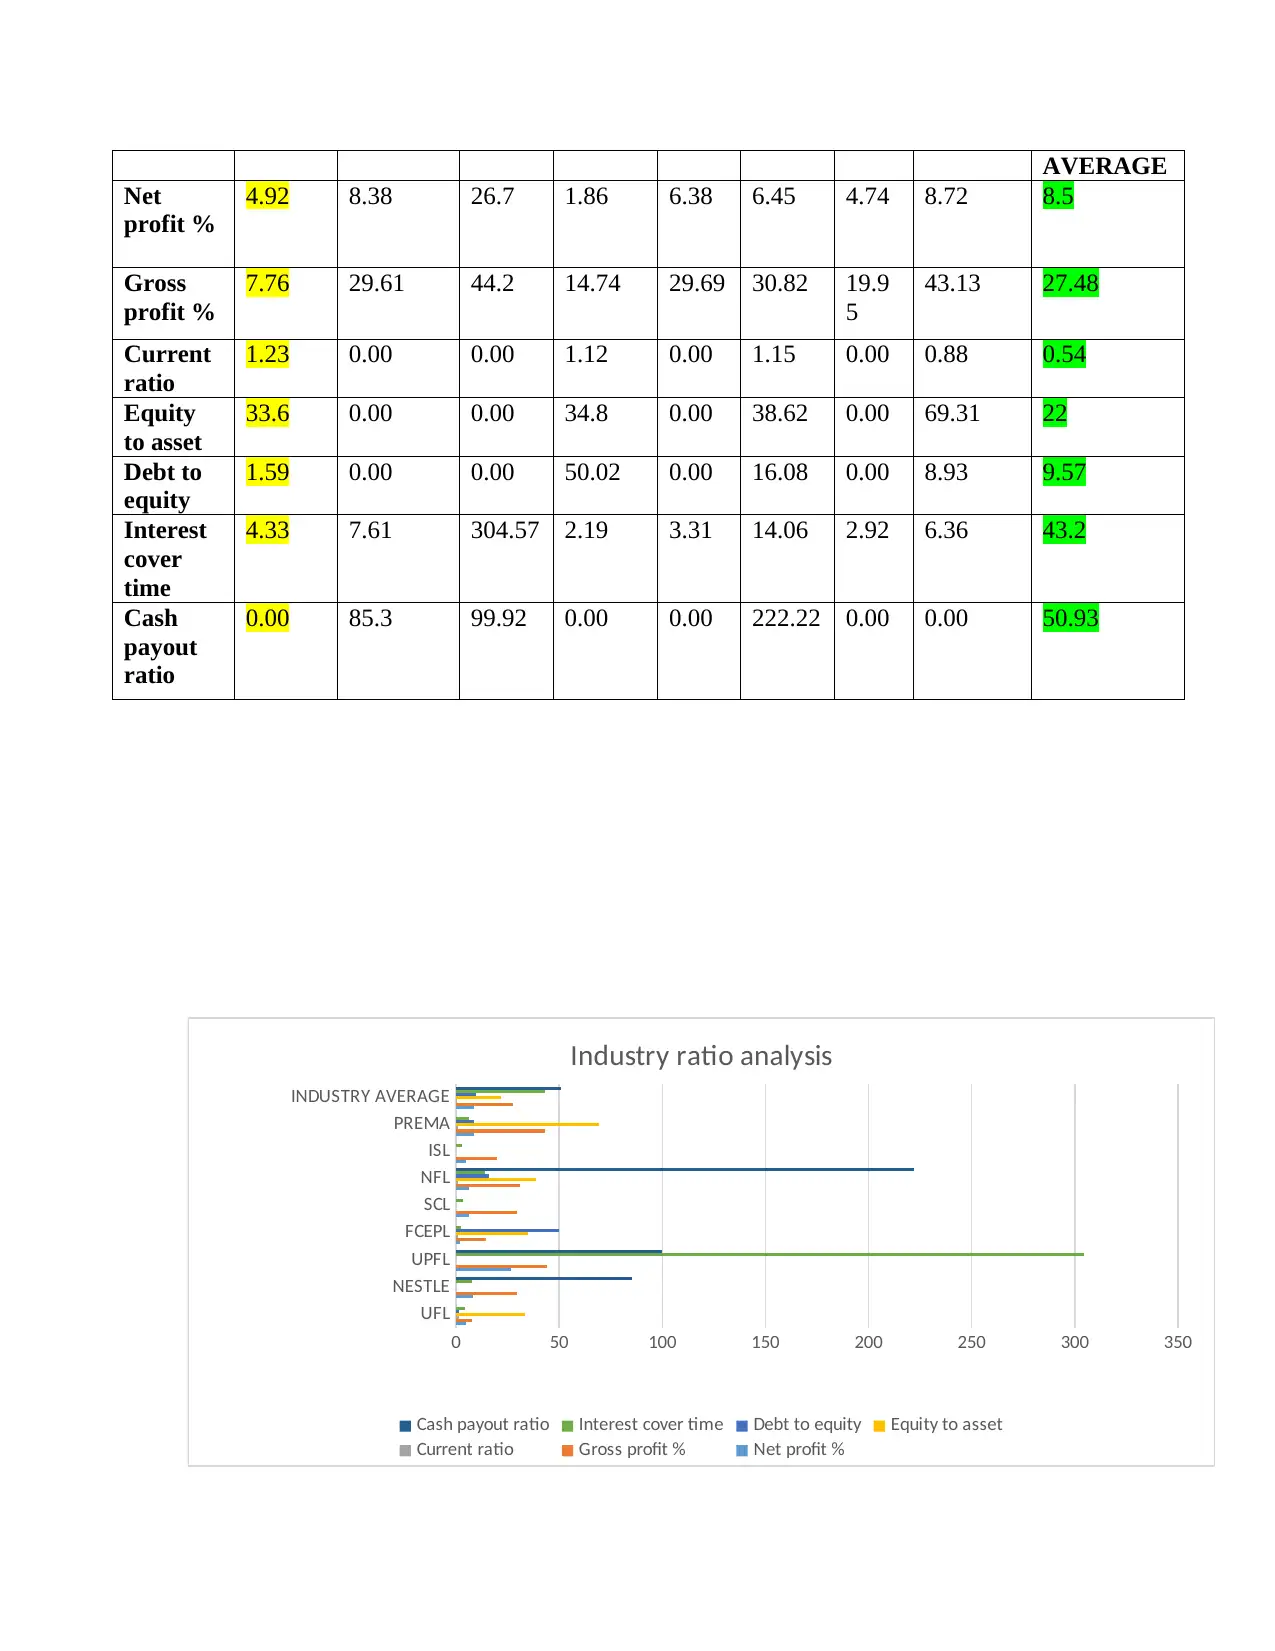
AVERAGE
Net
profit %
4.92 8.38 26.7 1.86 6.38 6.45 4.74 8.72 8.5
Gross
profit %
7.76 29.61 44.2 14.74 29.69 30.82 19.9
5
43.13 27.48
Current
ratio
1.23 0.00 0.00 1.12 0.00 1.15 0.00 0.88 0.54
Equity
to asset
33.6 0.00 0.00 34.8 0.00 38.62 0.00 69.31 22
Debt to
equity
1.59 0.00 0.00 50.02 0.00 16.08 0.00 8.93 9.57
Interest
cover
time
4.33 7.61 304.57 2.19 3.31 14.06 2.92 6.36 43.2
Cash
payout
ratio
0.00 85.3 99.92 0.00 0.00 222.22 0.00 0.00 50.93
UFL
NESTLE
UPFL
FCEPL
SCL
NFL
ISL
PREMA
INDUSTRY AVERAGE
0 50 100 150 200 250 300 350
Industry ratio analysis
Cash payout ratio Interest cover time Debt to equity Equity to asset
Current ratio Gross profit % Net profit %
Paraphrase This Document
Need a fresh take? Get an instant paraphrase of this document with our AI Paraphraser
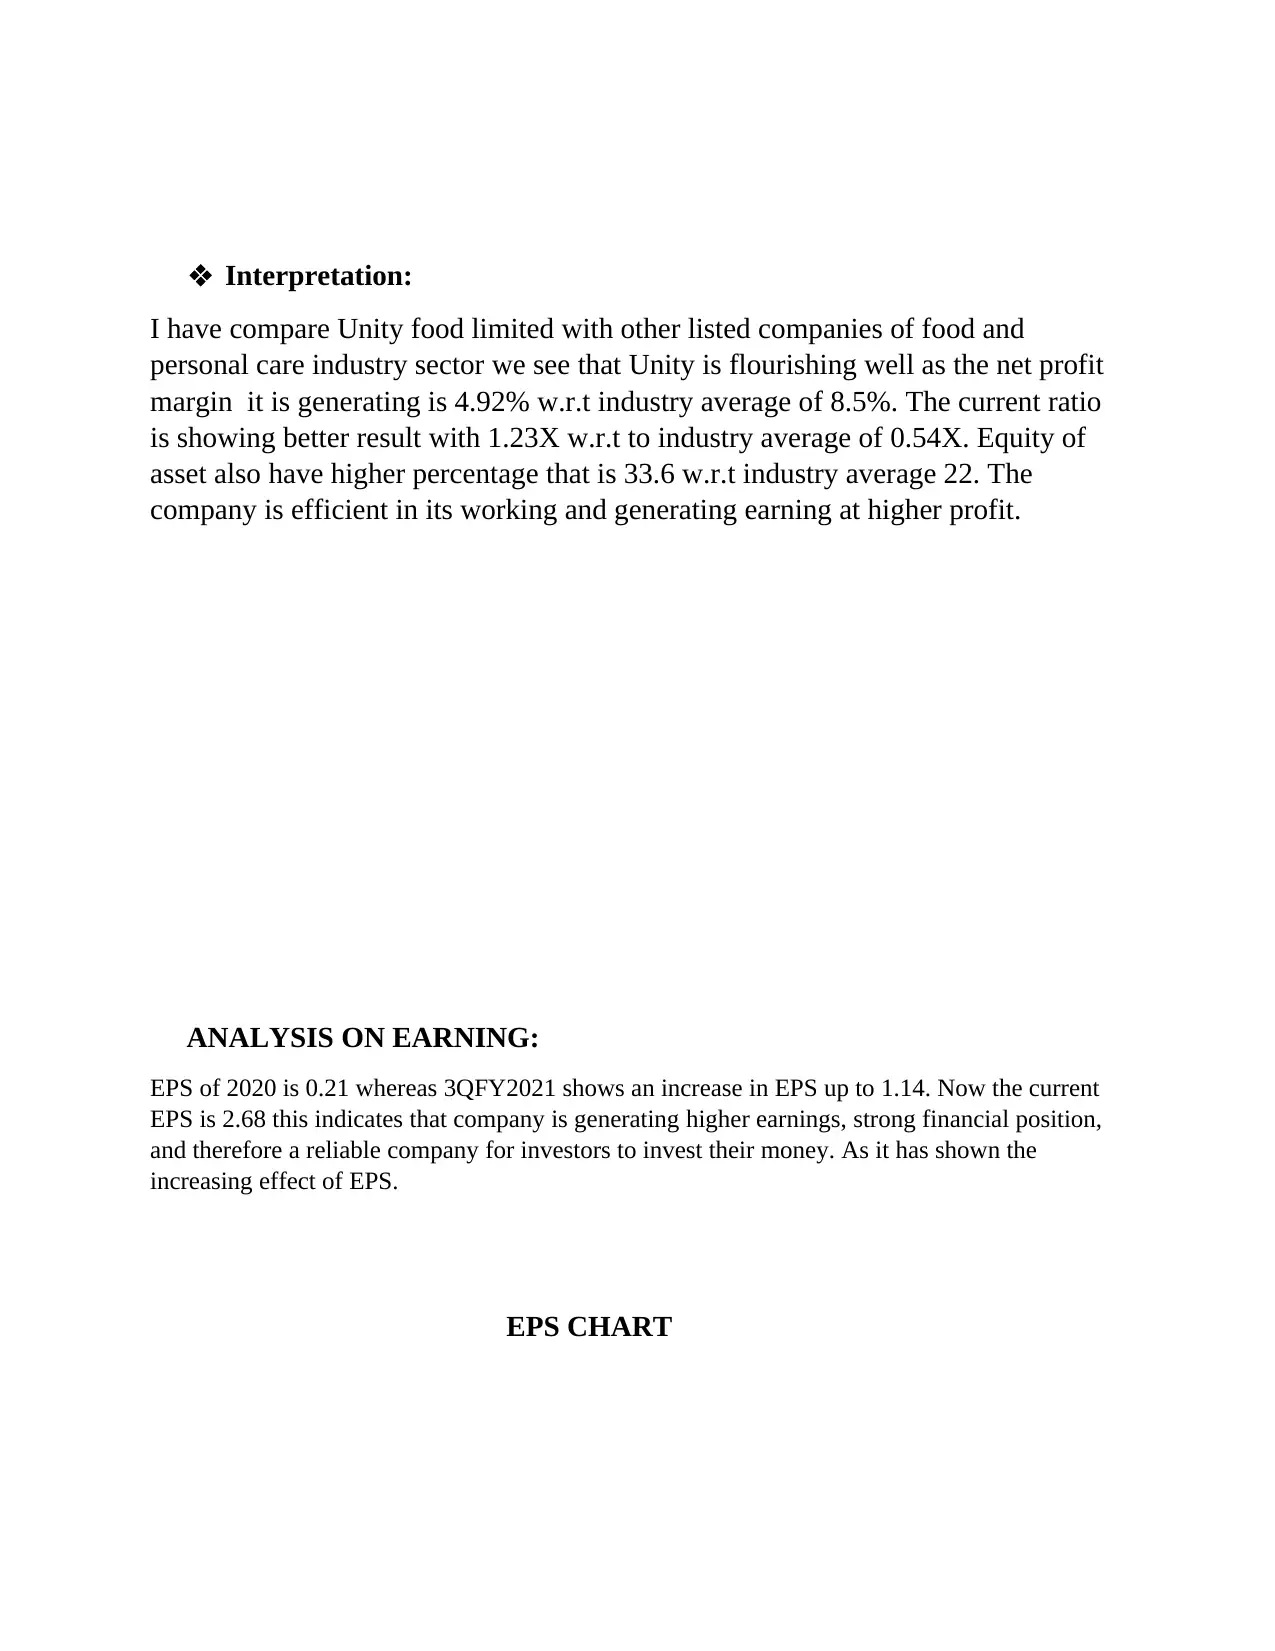
Interpretation:
I have compare Unity food limited with other listed companies of food and
personal care industry sector we see that Unity is flourishing well as the net profit
margin it is generating is 4.92% w.r.t industry average of 8.5%. The current ratio
is showing better result with 1.23X w.r.t to industry average of 0.54X. Equity of
asset also have higher percentage that is 33.6 w.r.t industry average 22. The
company is efficient in its working and generating earning at higher profit.
ANALYSIS ON EARNING:
EPS of 2020 is 0.21 whereas 3QFY2021 shows an increase in EPS up to 1.14. Now the current
EPS is 2.68 this indicates that company is generating higher earnings, strong financial position,
and therefore a reliable company for investors to invest their money. As it has shown the
increasing effect of EPS.
EPS CHART

2 0 1 8 2 0 1 9 2 0 2 0 3 Q F Y 2 1 F Y 2 1 c u r r e n t
0.72
0.47
0.21
1.14
2.68
Comparison with other companies:
Symbol EPS
UNITY 2.68
NESTLE 223.93
UPFL 700.95
SCL 34.5
FCEPL 1.11
NATF 12.2
ISIL 26.3
PREMA 1.2
0.72
0.47
0.21
1.14
2.68
Comparison with other companies:
Symbol EPS
UNITY 2.68
NESTLE 223.93
UPFL 700.95
SCL 34.5
FCEPL 1.11
NATF 12.2
ISIL 26.3
PREMA 1.2
⊘ This is a preview!⊘
Do you want full access?
Subscribe today to unlock all pages.
Trusted by 1+ million students worldwide
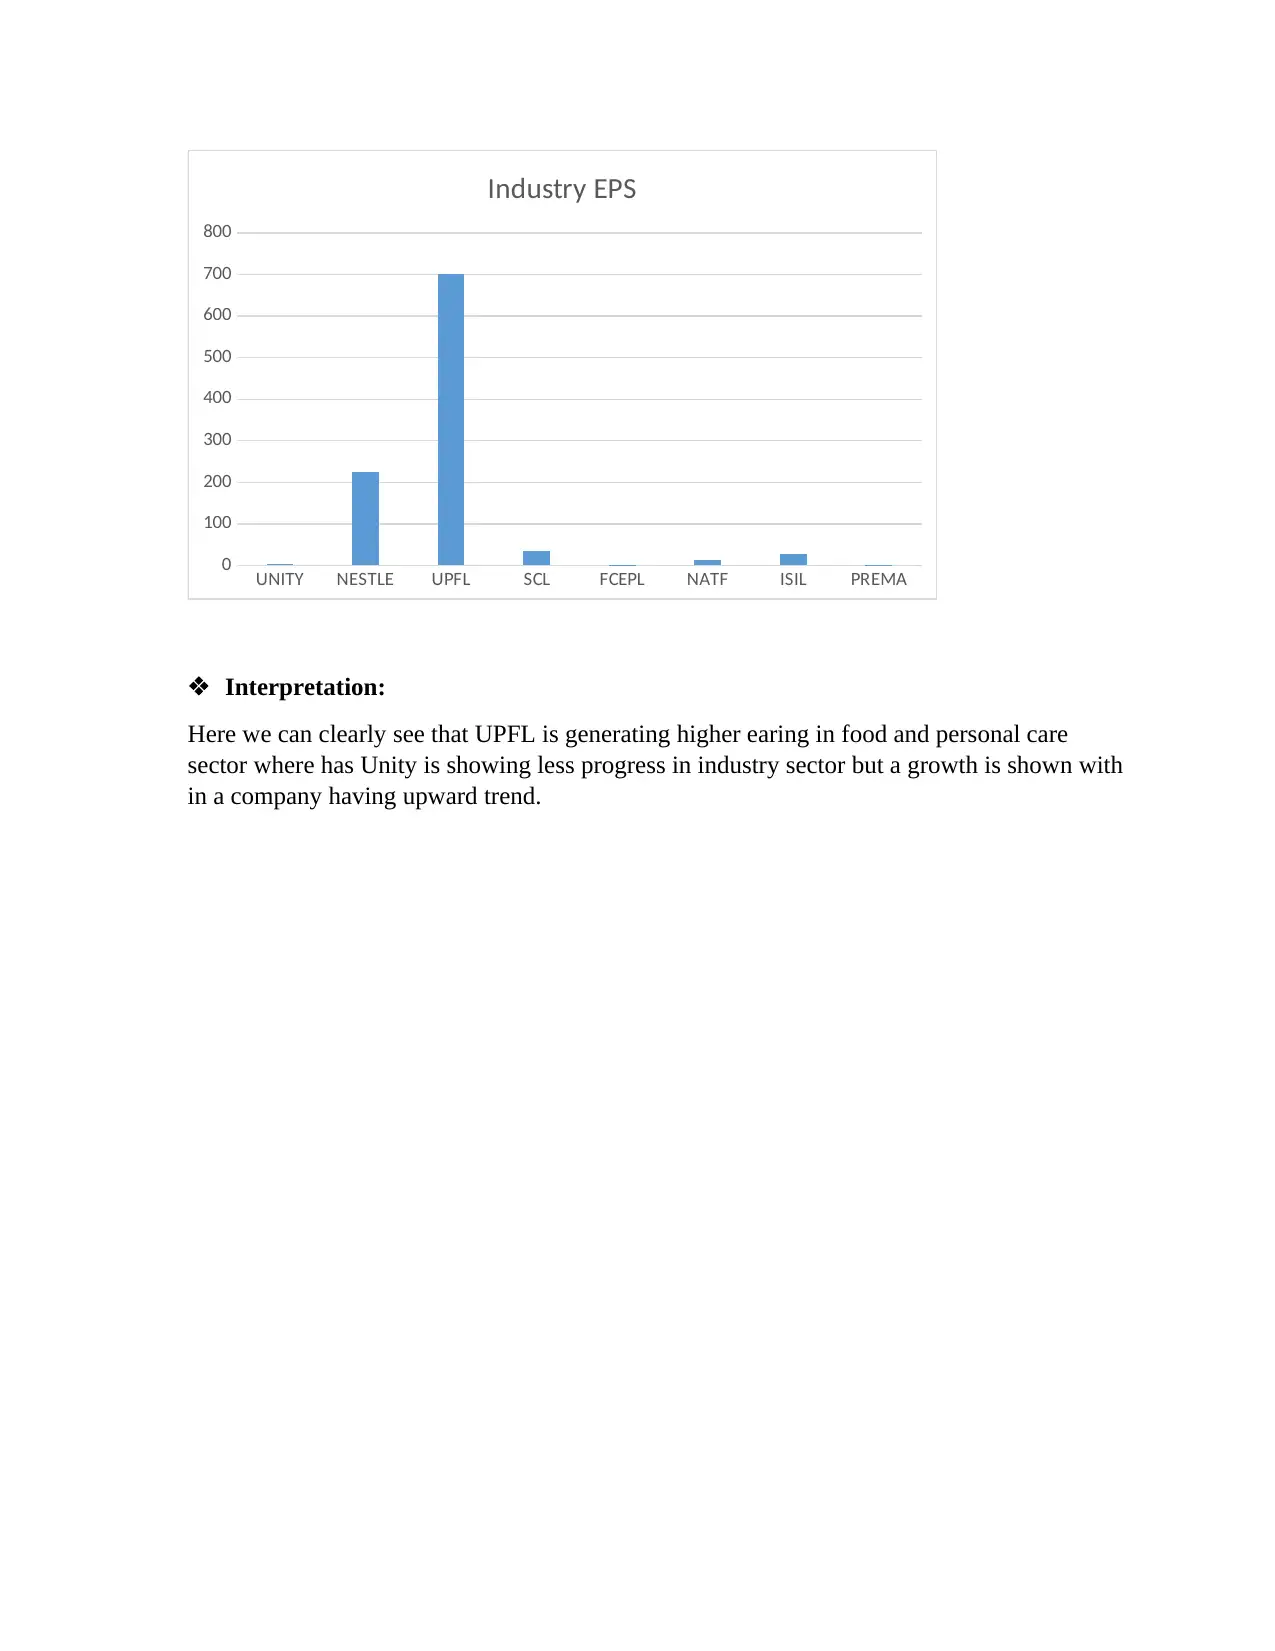
UNITY NESTLE UPFL SCL FCEPL NATF ISIL PREMA
0
100
200
300
400
500
600
700
800
Industry EPS
Interpretation:
Here we can clearly see that UPFL is generating higher earing in food and personal care
sector where has Unity is showing less progress in industry sector but a growth is shown with
in a company having upward trend.
0
100
200
300
400
500
600
700
800
Industry EPS
Interpretation:
Here we can clearly see that UPFL is generating higher earing in food and personal care
sector where has Unity is showing less progress in industry sector but a growth is shown with
in a company having upward trend.
Paraphrase This Document
Need a fresh take? Get an instant paraphrase of this document with our AI Paraphraser
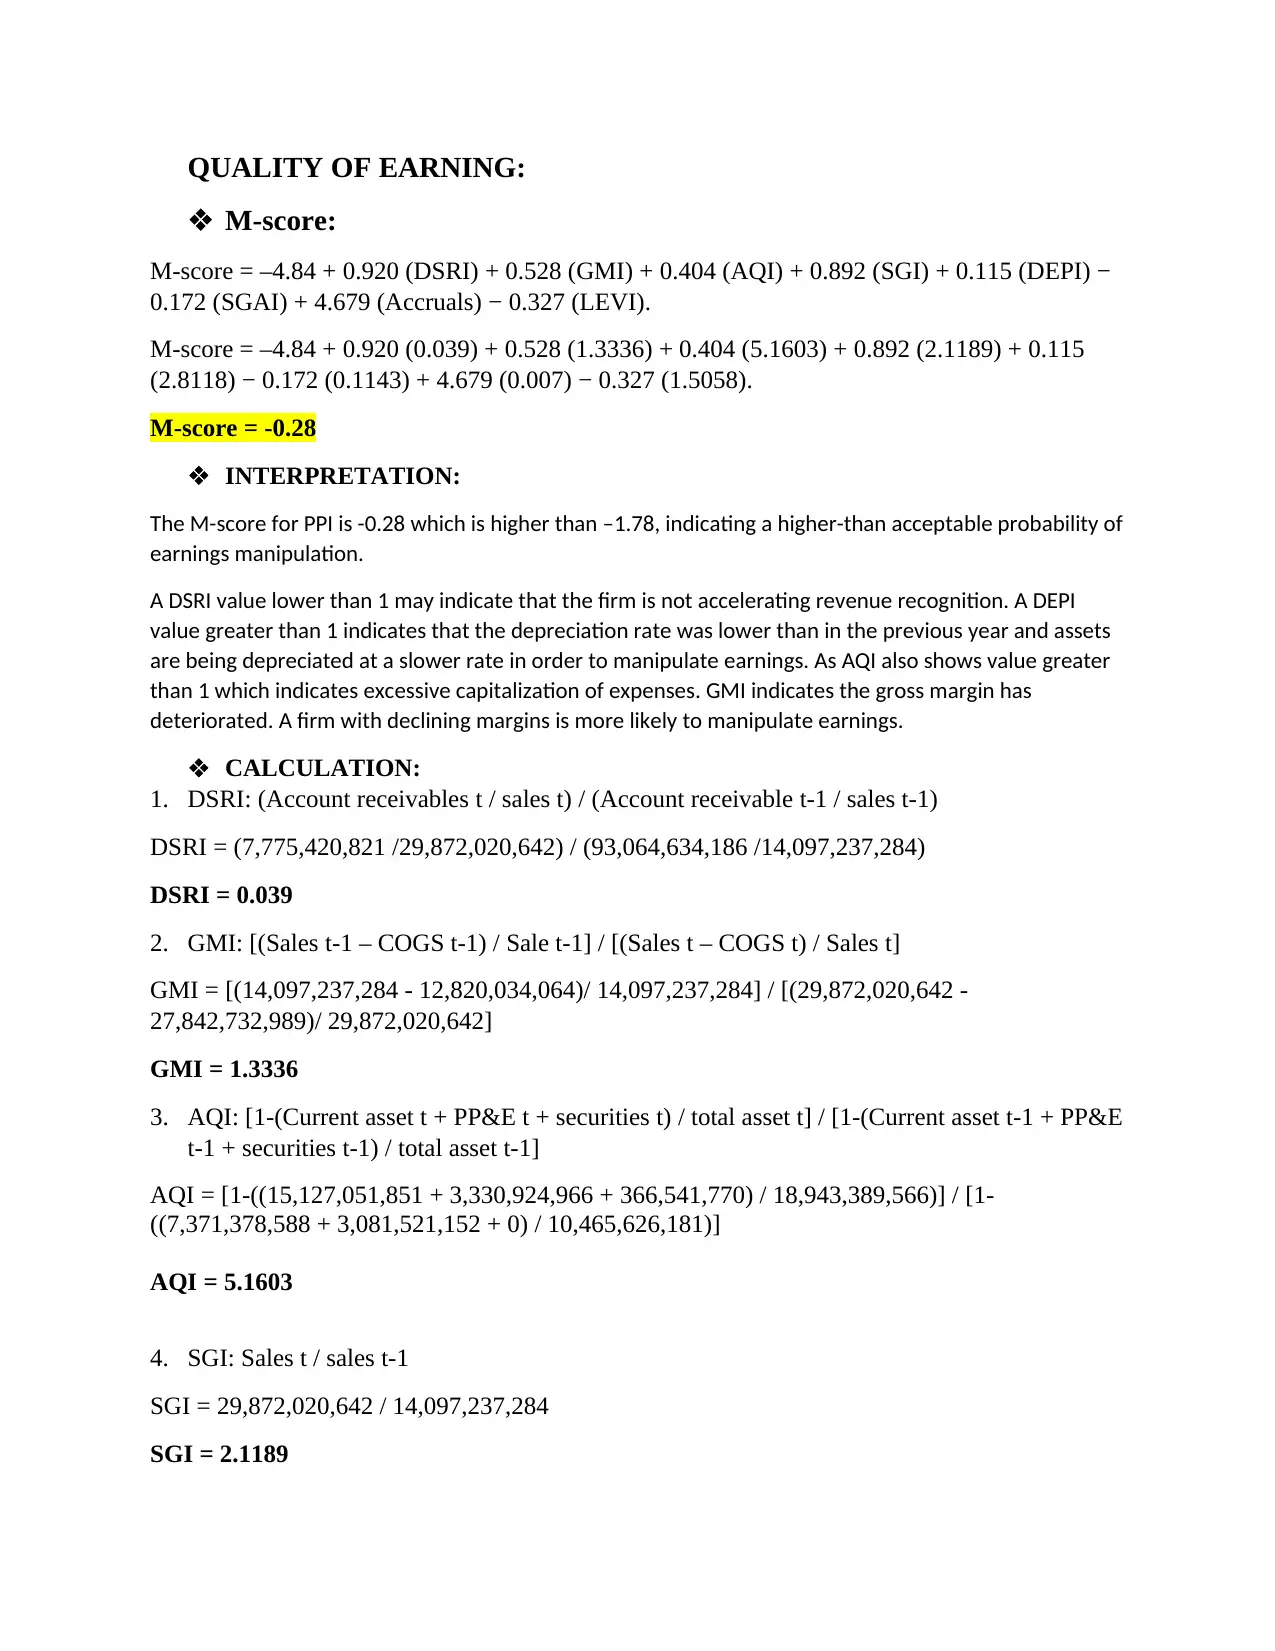
QUALITY OF EARNING:
M-score:
M-score = –4.84 + 0.920 (DSRI) + 0.528 (GMI) + 0.404 (AQI) + 0.892 (SGI) + 0.115 (DEPI) −
0.172 (SGAI) + 4.679 (Accruals) − 0.327 (LEVI).
M-score = –4.84 + 0.920 (0.039) + 0.528 (1.3336) + 0.404 (5.1603) + 0.892 (2.1189) + 0.115
(2.8118) − 0.172 (0.1143) + 4.679 (0.007) − 0.327 (1.5058).
M-score = -0.28
INTERPRETATION:
The M-score for PPI is -0.28 which is higher than –1.78, indicating a higher-than acceptable probability of
earnings manipulation.
A DSRI value lower than 1 may indicate that the firm is not accelerating revenue recognition. A DEPI
value greater than 1 indicates that the depreciation rate was lower than in the previous year and assets
are being depreciated at a slower rate in order to manipulate earnings. As AQI also shows value greater
than 1 which indicates excessive capitalization of expenses. GMI indicates the gross margin has
deteriorated. A firm with declining margins is more likely to manipulate earnings.
CALCULATION:
1. DSRI: (Account receivables t / sales t) / (Account receivable t-1 / sales t-1)
DSRI = (7,775,420,821 /29,872,020,642) / (93,064,634,186 /14,097,237,284)
DSRI = 0.039
2. GMI: [(Sales t-1 – COGS t-1) / Sale t-1] / [(Sales t – COGS t) / Sales t]
GMI = [(14,097,237,284 - 12,820,034,064)/ 14,097,237,284] / [(29,872,020,642 -
27,842,732,989)/ 29,872,020,642]
GMI = 1.3336
3. AQI: [1-(Current asset t + PP&E t + securities t) / total asset t] / [1-(Current asset t-1 + PP&E
t-1 + securities t-1) / total asset t-1]
AQI = [1-((15,127,051,851 + 3,330,924,966 + 366,541,770) / 18,943,389,566)] / [1-
((7,371,378,588 + 3,081,521,152 + 0) / 10,465,626,181)]
AQI = 5.1603
4. SGI: Sales t / sales t-1
SGI = 29,872,020,642 / 14,097,237,284
SGI = 2.1189
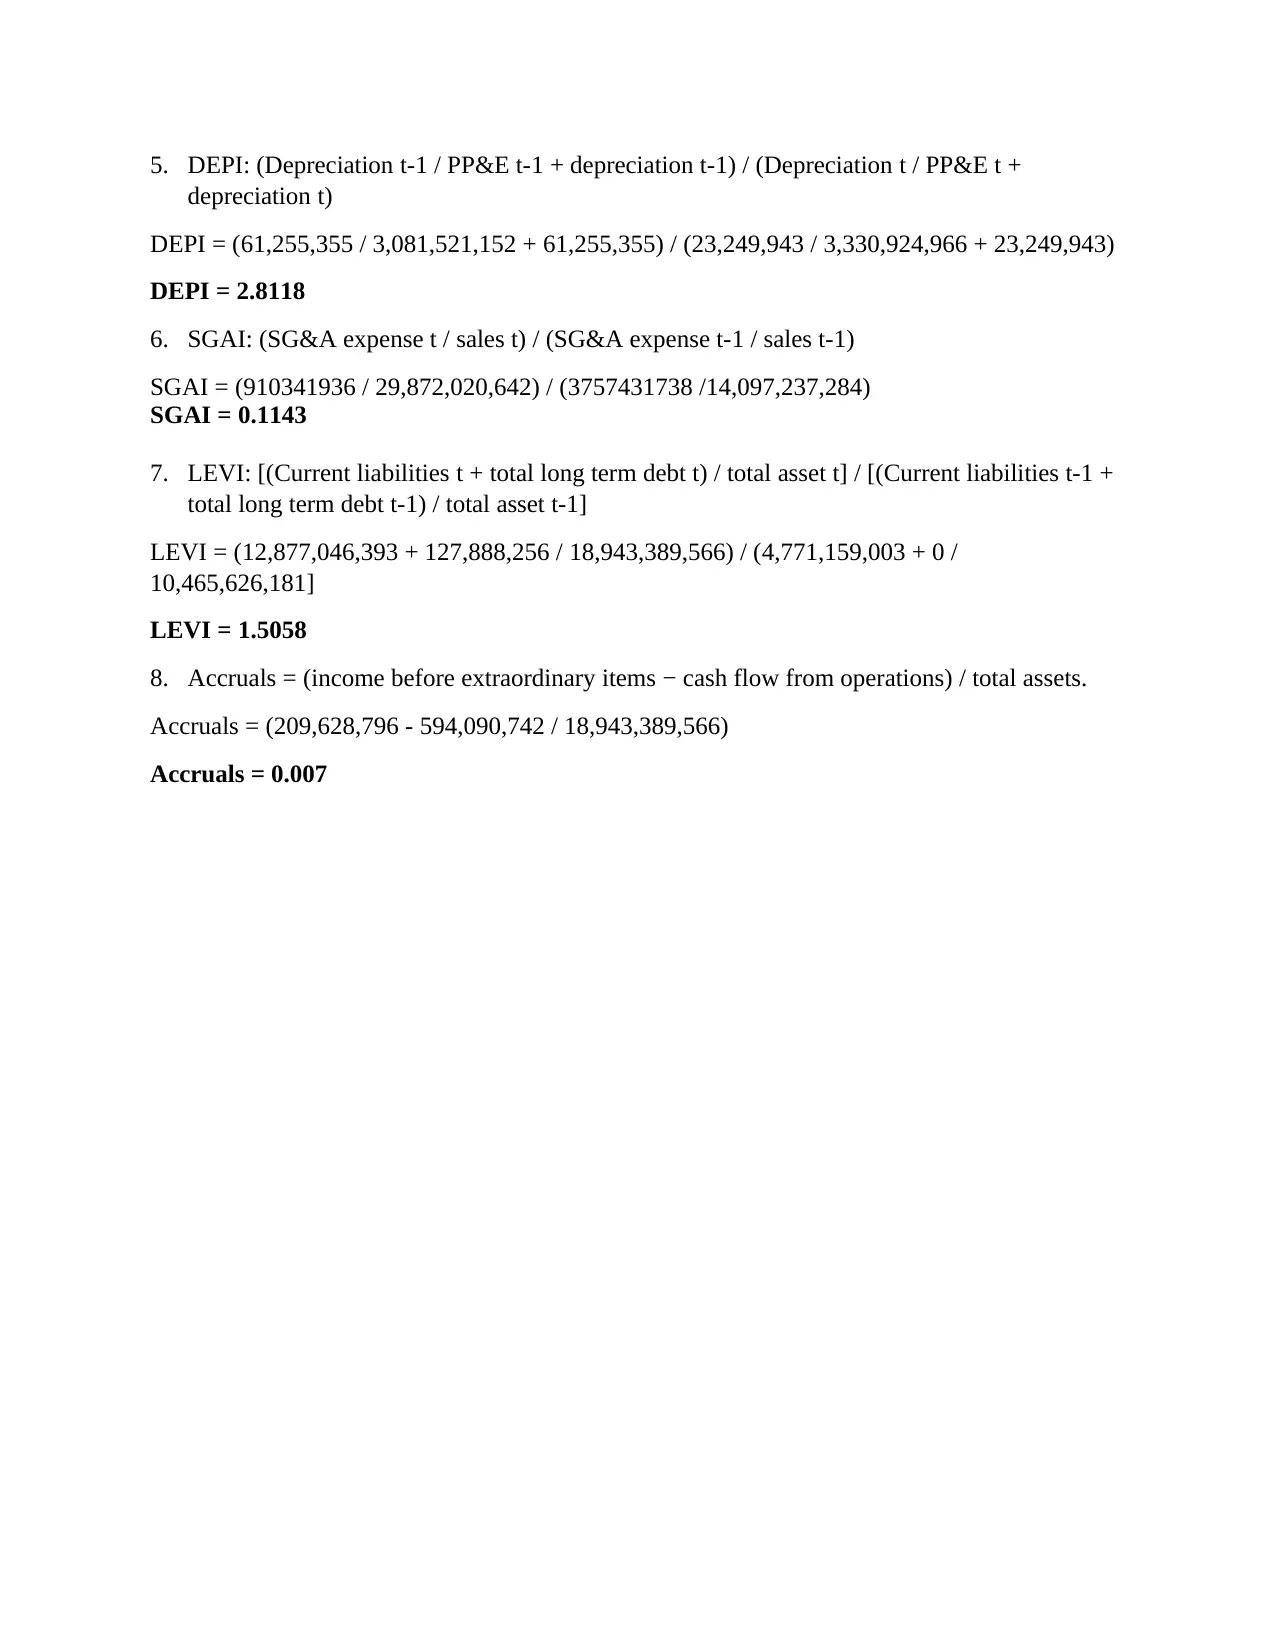
5. DEPI: (Depreciation t-1 / PP&E t-1 + depreciation t-1) / (Depreciation t / PP&E t +
depreciation t)
DEPI = (61,255,355 / 3,081,521,152 + 61,255,355) / (23,249,943 / 3,330,924,966 + 23,249,943)
DEPI = 2.8118
6. SGAI: (SG&A expense t / sales t) / (SG&A expense t-1 / sales t-1)
SGAI = (910341936 / 29,872,020,642) / (3757431738 /14,097,237,284)
SGAI = 0.1143
7. LEVI: [(Current liabilities t + total long term debt t) / total asset t] / [(Current liabilities t-1 +
total long term debt t-1) / total asset t-1]
LEVI = (12,877,046,393 + 127,888,256 / 18,943,389,566) / (4,771,159,003 + 0 /
10,465,626,181]
LEVI = 1.5058
8. Accruals = (income before extraordinary items − cash flow from operations) / total assets.
Accruals = (209,628,796 - 594,090,742 / 18,943,389,566)
Accruals = 0.007
⊘ This is a preview!⊘
Do you want full access?
Subscribe today to unlock all pages.
Trusted by 1+ million students worldwide
1 out of 15
Your All-in-One AI-Powered Toolkit for Academic Success.
+13062052269
info@desklib.com
Available 24*7 on WhatsApp / Email
![[object Object]](/_next/static/media/star-bottom.7253800d.svg)
Unlock your academic potential
Copyright © 2020–2026 A2Z Services. All Rights Reserved. Developed and managed by ZUCOL.