Data Analysis of BIS University Business School Regions Report
VerifiedAdded on 2023/01/11
|18
|2967
|61
Report
AI Summary
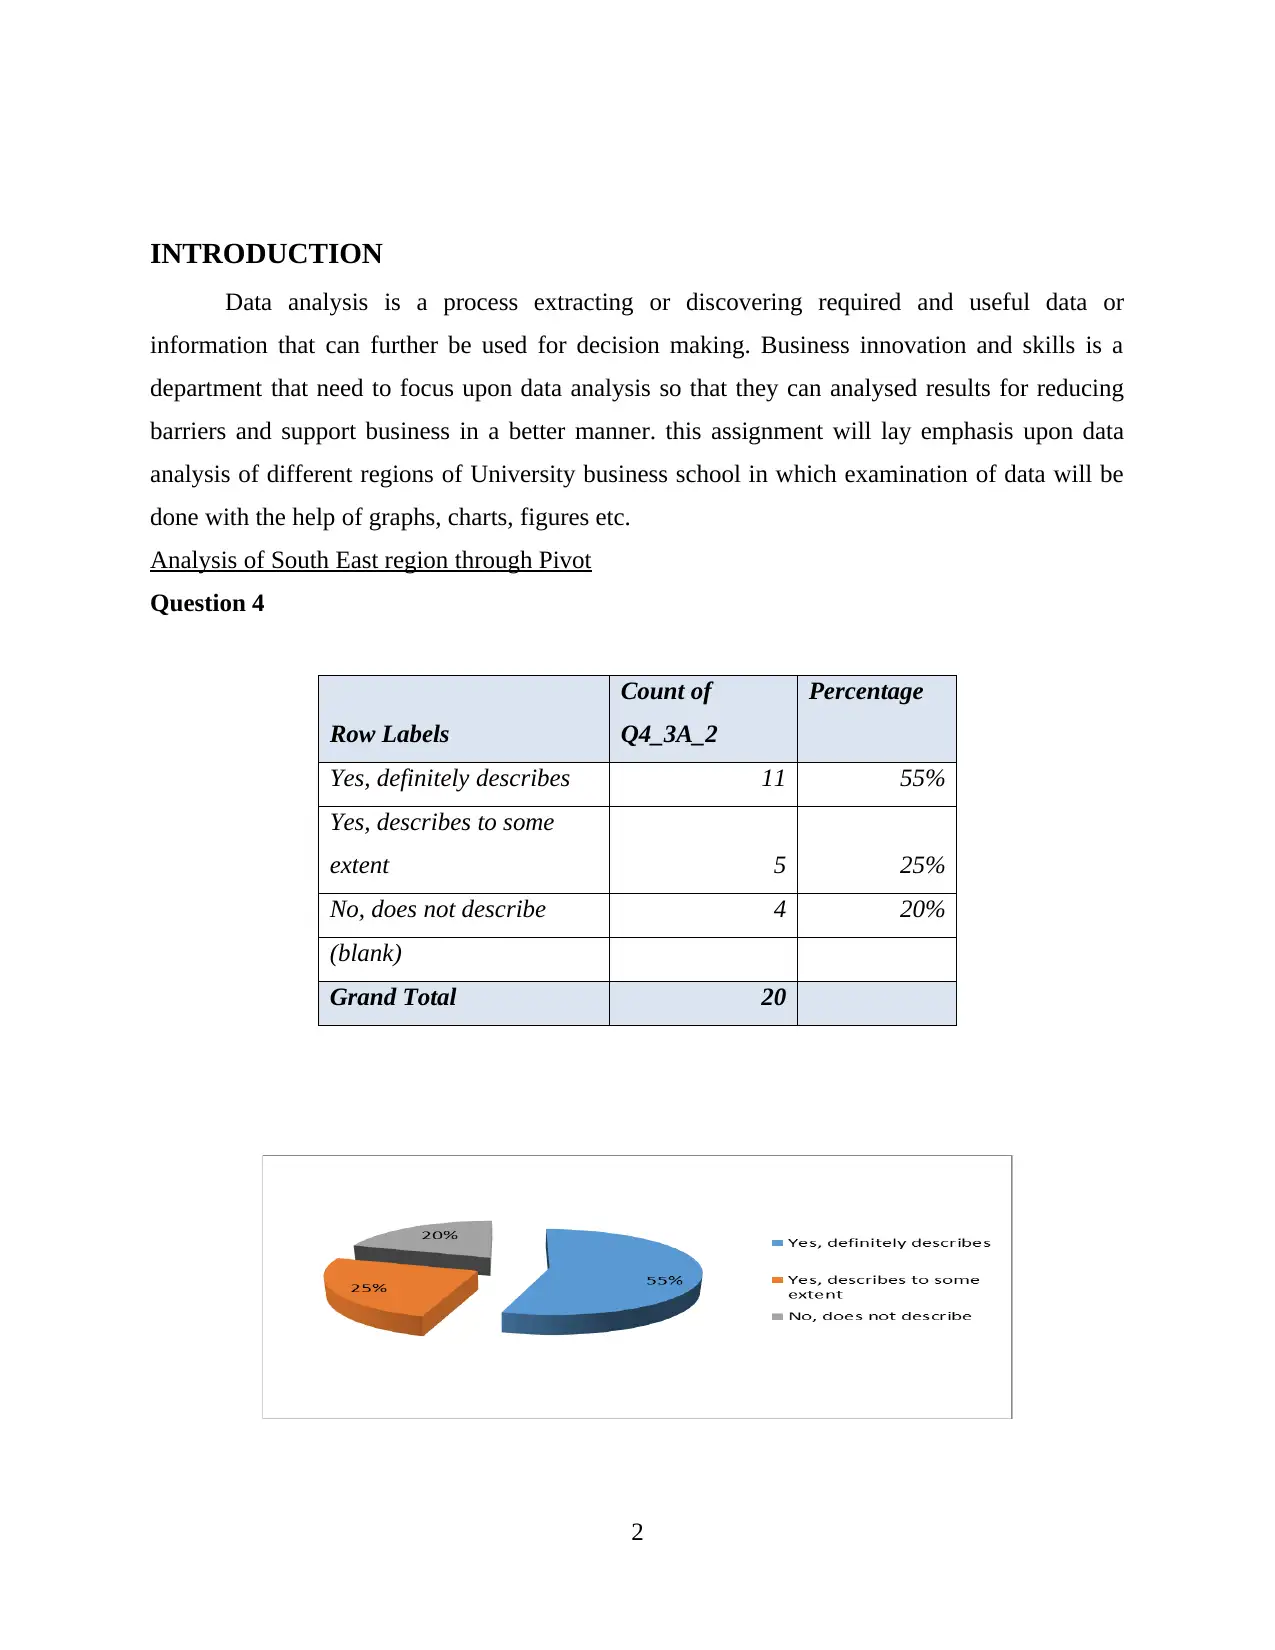
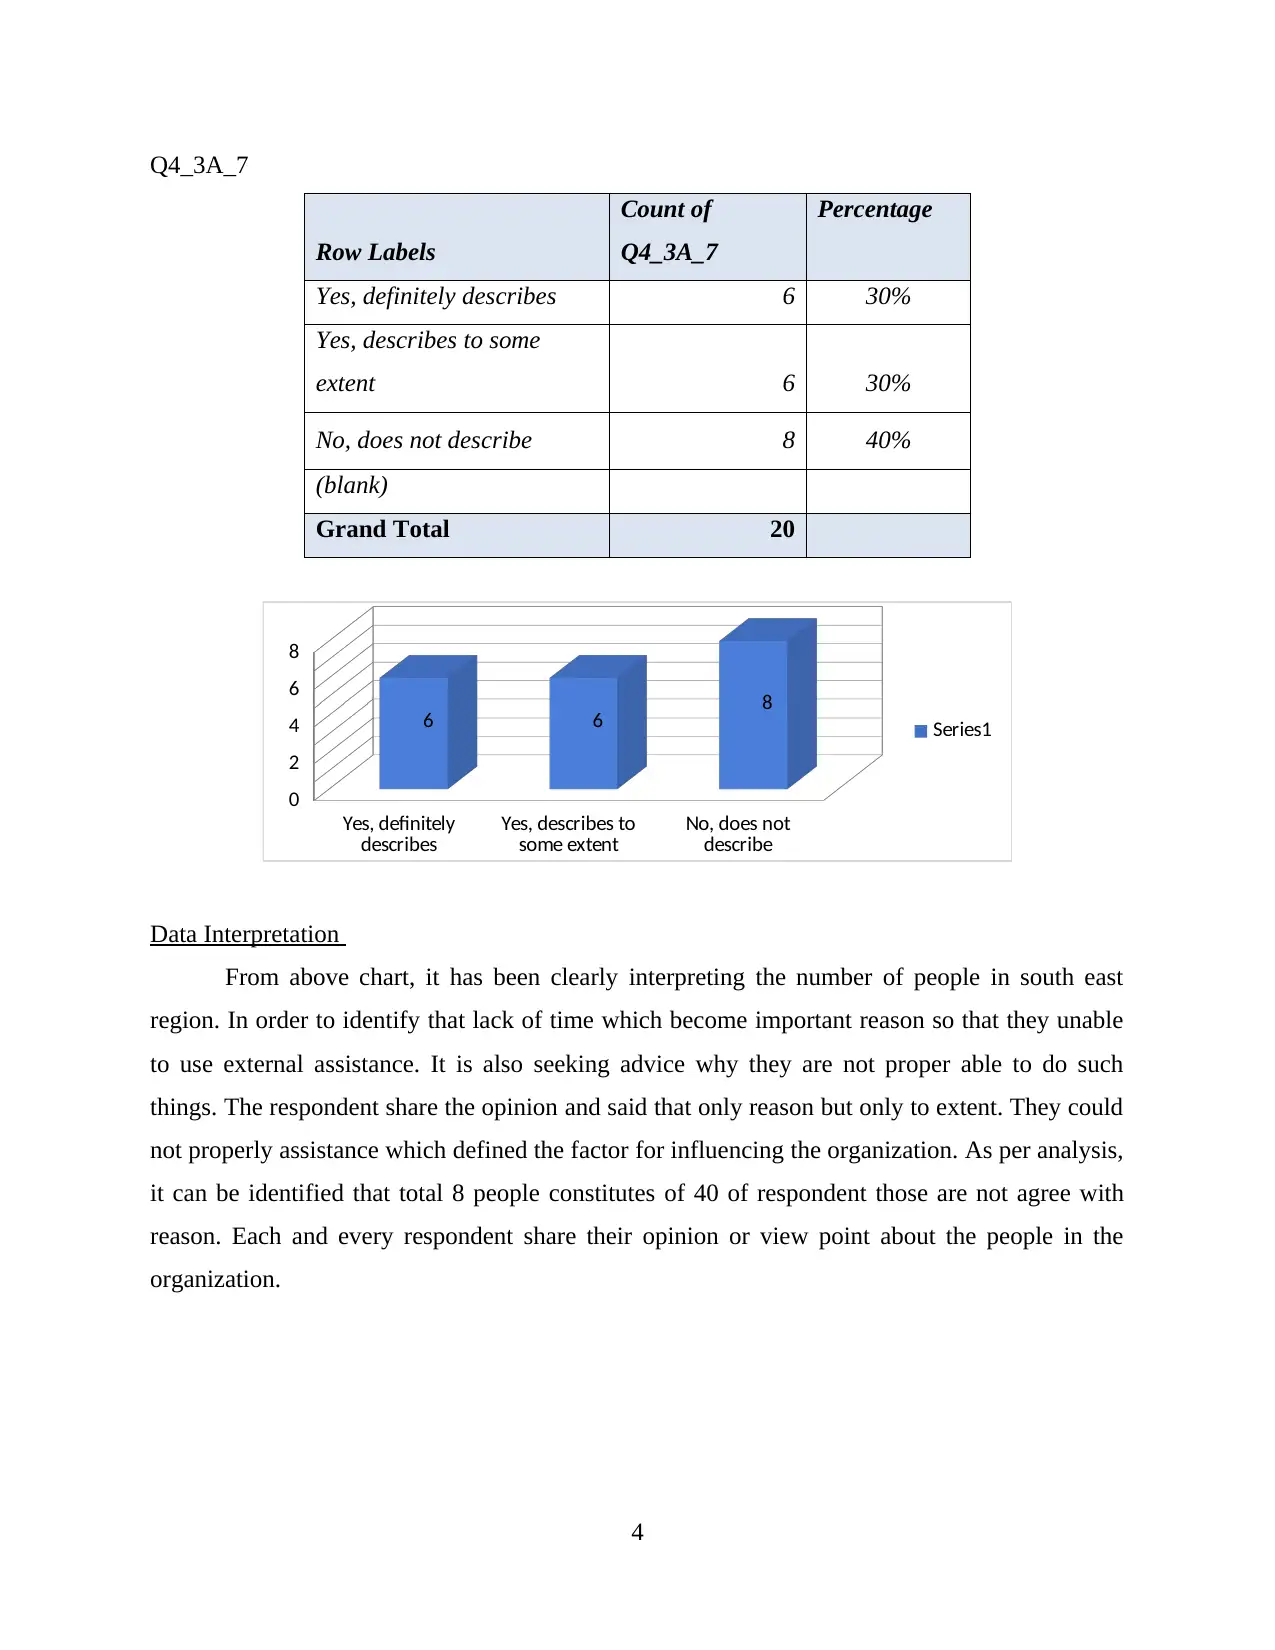
This report presents a data analysis of the University business school, focusing on data from the South East and North West regions. The analysis utilizes pivot tables, charts, and percentages to interpret responses to various questions. The report examines factors influencing business growth, including resource availability, external assistance, profit, market share, and diversification strategies. It also analyzes the number of partners, the role of women directors, and overall business performance. Key findings include insights into regional differences in resource utilization, market strategies, and the impact of various factors on business development. The report provides a detailed breakdown of the data, offering valuable insights into the performance of different regions within the university business school.

BIS Data Analysis
1
1
Secure Best Marks with AI Grader
Need help grading? Try our AI Grader for instant feedback on your assignments.

INTRODUCTION
Data analysis is a process extracting or discovering required and useful data or
information that can further be used for decision making. Business innovation and skills is a
department that need to focus upon data analysis so that they can analysed results for reducing
barriers and support business in a better manner. this assignment will lay emphasis upon data
analysis of different regions of University business school in which examination of data will be
done with the help of graphs, charts, figures etc.
Analysis of South East region through Pivot
Question 4
Row Labels
Count of
Q4_3A_2
Percentage
Yes, definitely describes 11 55%
Yes, describes to some
extent 5 25%
No, does not describe 4 20%
(blank)
Grand Total 20
2

Data Interpretation
As above table, it has been interpreting the data of South east region whereas it can easily
calculating the availability of solidarity. The maximum respondent give their response towards
the south east and said that yes. In order to identify the availability of proper resources. As per
analysis, it has found that 25% of respondent give their own reason but it only approve on the
basis of their perception. On the other hand, 20% respondent has not described the qualifying as
a reason when they have not always support for external advice.
3

Q4_3A_7
Row Labels
Count of
Q4_3A_7
Percentage
Yes, definitely describes 6 30%
Yes, describes to some
extent 6 30%
No, does not describe 8 40%
(blank)
Grand Total 20
Yes, definitely
describes Yes, describes to
some extent No, does not
describe
0
2
4
6
8
6 6 8
Series1
Data Interpretation
From above chart, it has been clearly interpreting the number of people in south east
region. In order to identify that lack of time which become important reason so that they unable
to use external assistance. It is also seeking advice why they are not proper able to do such
things. The respondent share the opinion and said that only reason but only to extent. They could
not properly assistance which defined the factor for influencing the organization. As per analysis,
it can be identified that total 8 people constitutes of 40 of respondent those are not agree with
reason. Each and every respondent share their opinion or view point about the people in the
organization.
4
Secure Best Marks with AI Grader
Need help grading? Try our AI Grader for instant feedback on your assignments.

Q4_3A_12
Row Labels
Count of
Q4_3A_12
Percentage
No other reasons 20 100%
(blank)
Grand Total 20
1
0
5
10
15
20 20
No other reasons
No other reasons
Data Interpretation
In above table, it has been gathered or collected large amount of information related
south east region. Each and every respondent share their own opinion about the concept. It has
been stated that there is not certain reason when accept from another one. It has found that 20
respondent collected show that they were completely agree with reason. As discussed earlier
comprehensive to find out the factor which are responsible for non-compliance. Through chart, it
has been represented the all possible aspects which could affect on the reason when why
respondent will not take any advice.
5

Question 5
Q5_2B
Row Labels Count of Q5_2B Percentage
Profits 66 100%
(blank)
Grand Total 66
Data Interpretation:
As per analysis, it has been raised the question where involves respondent and share their
opinion. It has identified that south east region intend to grow the business while increasing the
demand in global marketplace. The maximum respondent shows positive response towards profit
rate. it would be considered as a primary reason where increasing business operation and
function. It is directly impact on the organizational performance. Generally it has proved that 66
respondent who show response in favour of profit. In order to measure the on the basis of reason
which intend to grow profitability.
6

Q5_2C
Row Labels
Count of
Q5_2C
Percentage
Market Share 23 100%
(blank)
Grand Total 23
1
0
10
20
30 23
Market Share
Market Share
Data Interpretation
From above chart, it has summarised about the growth and development in south east
region. In order to consider the strategies which help for finding the reason behind development.
The respondent share their statement in term of market share and how market strategies support
for enhancing overall business capabilities. it can be determined that 23 respondent give positive
response where they were considered that market share evaluate the decision making in term of
growth. It also promoted the organization to use basic strategies and reach to optimum growth
phase in proper manner.
7
Paraphrase This Document
Need a fresh take? Get an instant paraphrase of this document with our AI Paraphraser

Q5_2G
Row Labels Count of Q5_2G Percentage
Diversify / new
products / range /
services 1
100%
(blank)
Grand Total 1
Data Interpretation
As above table, it has conclude that large set of responsent from south east region those
are participate signiciant role. Afterwards, it can evaluate the business plan for organization
growth as well as development. Analysis has been done on the basis of diverfication and
lauching of new item and service in marketplace. these are collectively help in ascertaining
which allow for business aim to expand bussiness. Each respondent agree that they must
consider the option as an adequate manner in term of growth as well as development.
8

Q5_2I
Row Labels Count of Q5_2I Percentage
(blank) 0%
Grand Total
Data Interpretation
From above table, it has been summarized that there are no such data or information
available. In this way, it also gained the questioned which useful for marketing and advertising.
Sometimes, it is important for considering the adequate option for ascertaining in which
organization could increase or grown. Furthermore, respondent can be said that there will be
large number of respondents who always think about the adequate base for measuring
development as well as growth rate.
Question 6
Q6_3
Row Labels
Count of
Q6_3
Percentage
1 70 32%
2 102 46%
3 26 12%
4 10 5%
5 4 2%
6 2 1%
15 1 0%
997 7 3%
Grand Total 222
9

Data Interpretation:
From above analysis, it has been interptring the data and consider the number of partners.
In order to easily control and maintain the business activities. In another way, it can adequately
said that majority of percentage where 2 number of directors preferred. Afterwards, it has been
representing that people in south east are adequately skill or knowledge about law. They always
tale permission in order to manage business operation and function. Through analysis, it has
been calculating the percentage rate in step by step manner. It provide the overview whereas
counting the rate of percrentage.
Q6_4
Row Labels Count of Q6_4 Percentage
0 103 46%
1 102 46%
2 8 4%
3 3 1%
997 6 3%
Grand Total 222
10
Secure Best Marks with AI Grader
Need help grading? Try our AI Grader for instant feedback on your assignments.

Interpretation: From the above graph it has been analysed that out of 222, 103 people says that
there should be only one women partner whereas 102 respondents says that there should be no
women partner. Rest of the 7 respondents did not responded in the same manner. However, there
was a close relationship between people who says 1 women partner and people who says no
women partner.
Q6_5
Row Labels
Count of
Q6_5
Percentage
Yes 50 23%
No 166 75%
Don’t Know 6 3%
Grand Total 222
11

Interpretation: From the above graph it has been interpreted that approximately 166 of
respondents said that they do not agree with the fact women director manages or owns their
business, 50 people says that their business can be owned and managed by women and only 6
people said that they did not have much knowledge about it.
12
respondents said that they do not agree with the fact women director manages or owns their
business, 50 people says that their business can be owned and managed by women and only 6
people said that they did not have much knowledge about it.
12

Pivot table
Question 4
North west region
Question 4-3A-2
Row Labels Count of
Q4_3A_2
2 2
Grand Total 2
Interpretation-From the above table it has been interpreted that business has sufficient expertise
and resources for running the business in a successful manner. This table also explains that there
are many more resources that that are required to be evaluated and identified for running a
business successfully. There are many resources which is identified and effectively used in it and
making things easy. The people are expertise is using of those resources and help in growth of
business. Thus, in North West region the people are expertise and know how to use resources in
efficient way. This has benefited in growth and development of business.
Question 4-3A-7
Row Labels Count of
Q4_3A_7
2 1
3 1
Grand Total 2
Interpretation-From the above table it has been interpreted that only one person says that to
find external assistance is quite difficult for business resources use because of which it becomes
difficult for business to find assistance for external environment for business and only because of
this overall development of the business as well as its growth can be impacted. In the north west
region no external help was taken because of which their relationship with people of external
environment were not good and were required to be improved in a proper and effective manner.
13
Paraphrase This Document
Need a fresh take? Get an instant paraphrase of this document with our AI Paraphraser

Question 4-3A-12
Row Labels Count of
Q4_3A_12
3 2
Grand
Total
2
Interpretation-From the above table it has been interpreted that 2 people says that in order to
run a business in an independent manner advice from other were not taken. It can also be said
organizational people did not have any particular reason or explanation because of which they
did not seek external advice. This can be because of some reason due to which things are done in
proper way. Also, in North West region people are expertise enough to take decision. It allows in
making things easy and taking effective decision..
Question 5-2B
Row Labels Count of
Q5_2B
1 47
(blank)
Grand
Total
47
Interpretation-From the above table it has been interpreted that overall, 47 people out of total
number of people said that they are using profit in order to expand business in north west region
because it becomes much easier to expand the business in other market. With the help of profit
generated it was easier for the company enter into new market region and develop new and
improved products for the organization which will further help them to increase their overall
profitability and introduction of new products will help them in attracting more number of
customers which will eventually help the company in increasing their overall revenue.
Question 5-2C
14
Row Labels Count of
Q4_3A_12
3 2
Grand
Total
2
Interpretation-From the above table it has been interpreted that 2 people says that in order to
run a business in an independent manner advice from other were not taken. It can also be said
organizational people did not have any particular reason or explanation because of which they
did not seek external advice. This can be because of some reason due to which things are done in
proper way. Also, in North West region people are expertise enough to take decision. It allows in
making things easy and taking effective decision..
Question 5-2B
Row Labels Count of
Q5_2B
1 47
(blank)
Grand
Total
47
Interpretation-From the above table it has been interpreted that overall, 47 people out of total
number of people said that they are using profit in order to expand business in north west region
because it becomes much easier to expand the business in other market. With the help of profit
generated it was easier for the company enter into new market region and develop new and
improved products for the organization which will further help them to increase their overall
profitability and introduction of new products will help them in attracting more number of
customers which will eventually help the company in increasing their overall revenue.
Question 5-2C
14

Row Labels Count of
Q5_2C
1 28
(blank)
Grand
Total
28
Interpretation-From the above table it has been interpreted that overall, 22 people says that
company is majorly focusing upon increasing their overall market share. They are trying to
achieve this objective with the help of IPO and investment. It is also helping the organization to
identify the sectors or areas where growth of the business is weak. This will help them to
increase their overall market share and will also help them to gain competitive advantage and
compete in the existing market environment. Focusing upon increasing market share will also
help the organization to identify opportunities with the help of which business will expand and
grow enormously.
Question 5-2G
Row Labels Count of
Q5_2G
1 2
(blank)
Grand
Total
2
Interpretation- From the above pivot table it can be interpreted that there are two people who
said that business is aiming in development of new products for growth of the business. For this
they are focusing upon increasing or diversifying their range of products that they offer to their
customers within the existing market. It is one of the most effective and best way in their view
point which will help the organization to enhance their overall revenue and attract a greater
number of customers. Not only this diversifying product range will also help customers to
identify new products and distinguish them with other products and their features. This will also
help the business to expand and enter into new market. This will also help the company to
15

increase awareness among people abut the business, their offering and their business in a proper
and effective manner and will further help business to fulfil needs and desire of their customers
in a proper manner and eventually customer base will increase.
Question 6-3
Row Labels Count of
Q6_3
1 46
2 66
3 19
4 6
5 5
7 1
15 1
997 5
Grand
Total
149
Interpretation- From the above table it has been interpreted that out of 149 people, maximum
66 people says that two partner work together for controlling all kinds of day to day business, 46
people says that there is only one person who works in all the day to day operations. However,
19 overall people said that for management of day to day operation there are overall 3 directors
that work together. Rest of the 18 people answered differently to the question i.e. six of them
said that there are 4 people involved in daily operations, five people said that maximum of 5
people are involved for daily operations working, one of them said that at least 6 people are
involved in management of daily operations whereas rest of the 5 people said that more than 6
people manage day to day operations.
16
Secure Best Marks with AI Grader
Need help grading? Try our AI Grader for instant feedback on your assignments.

Row Labels
Count of
Q6_4
0 70
1 62
2 7
3 3
4 2
997 4
998 1
Grand Total 149
Interpretation-by analysing data it is analysed that 70 respondents said that within their
business there are 1 women director. Also, 62 said there ia 2 women director. In addition, 7
people said that there are 3 women director in it and 3 said there are 4. Along with this, it is
identified that 2 people said 5 women director is there in business and 4 said more than 5. Thus,
it is stated that women are appointed as director in business in North West region. They are the
partner who are involved within business. Besides that, women are involved in taking decision
and dealing with business. This is easy to get things done in proper way. In business women are
partner that has helped in growth of it. They have taken decision on how things are done and
supported business in its growth. In North West region there is high contribution of women in it.
Row Labels
Count of
Q6_5
1 35
2 108
3 6
Grand Total 149
Interpretation – by interpreting above table it is evaluated that 35 participants said that they
know there are 50% women owner in business. On contrary 108 said no for it and only 6 said
they do not know this. So, it can be evaluated that in north west region within business there are
few people who are aware about women who are owners. Therefore, most of them know that
17
Count of
Q6_4
0 70
1 62
2 7
3 3
4 2
997 4
998 1
Grand Total 149
Interpretation-by analysing data it is analysed that 70 respondents said that within their
business there are 1 women director. Also, 62 said there ia 2 women director. In addition, 7
people said that there are 3 women director in it and 3 said there are 4. Along with this, it is
identified that 2 people said 5 women director is there in business and 4 said more than 5. Thus,
it is stated that women are appointed as director in business in North West region. They are the
partner who are involved within business. Besides that, women are involved in taking decision
and dealing with business. This is easy to get things done in proper way. In business women are
partner that has helped in growth of it. They have taken decision on how things are done and
supported business in its growth. In North West region there is high contribution of women in it.
Row Labels
Count of
Q6_5
1 35
2 108
3 6
Grand Total 149
Interpretation – by interpreting above table it is evaluated that 35 participants said that they
know there are 50% women owner in business. On contrary 108 said no for it and only 6 said
they do not know this. So, it can be evaluated that in north west region within business there are
few people who are aware about women who are owners. Therefore, most of them know that
17

men are owners. The reason due to which people do not know that there are women owner is
lack of awareness. It allows in making things easy and taking of decision. There are some
women owner in who are director of business but there is change in things. Due to lack of
involvement people are not aware that there are some women owner as well who are running
successfully various types of business. It leads to change in things of how well women are
handling and managing business.
CONCLUSION
From above discussion, it has summarised about the Analysis of South East region and
North Westregion. It has been interpreting the data for identifying the opinion or view point of
respondents towards the availability of solidarity, percentage rate of population, profit or loss.
Through interpretation, it has been determined that consider appropriate resources and manage
the perception of individual towards south east region. Furthermore, it also considered the North
West region which mainly focused on the sufficient expertise and resources for running the
business. In order to determine the existing market value, share in global world. By using data
interpretation, it has been representing the opinion or view point of individual people.
REFLECTION
By doing this i analysed that there are data analysis is process of processing and interpreting
of raw data. I was not having any knowledge in it but with help of expert i did it and obtain
relevant outcomes. Also, i communicated in well manner and presented data properly. But i was
not able to make decision in it and due to that my performance was hampered. I gained
knowledge about how to make pivot tables by segregating data and info. this will help me in my
career.
18
1 out of 18
Related Documents

Your All-in-One AI-Powered Toolkit for Academic Success.
+13062052269
info@desklib.com
Available 24*7 on WhatsApp / Email
Unlock your academic potential
© 2024 | Zucol Services PVT LTD | All rights reserved.