University Economics ECON 17: International Trade Assignment
VerifiedAdded on 2022/09/28
|17
|1722
|18
Homework Assignment
AI Summary
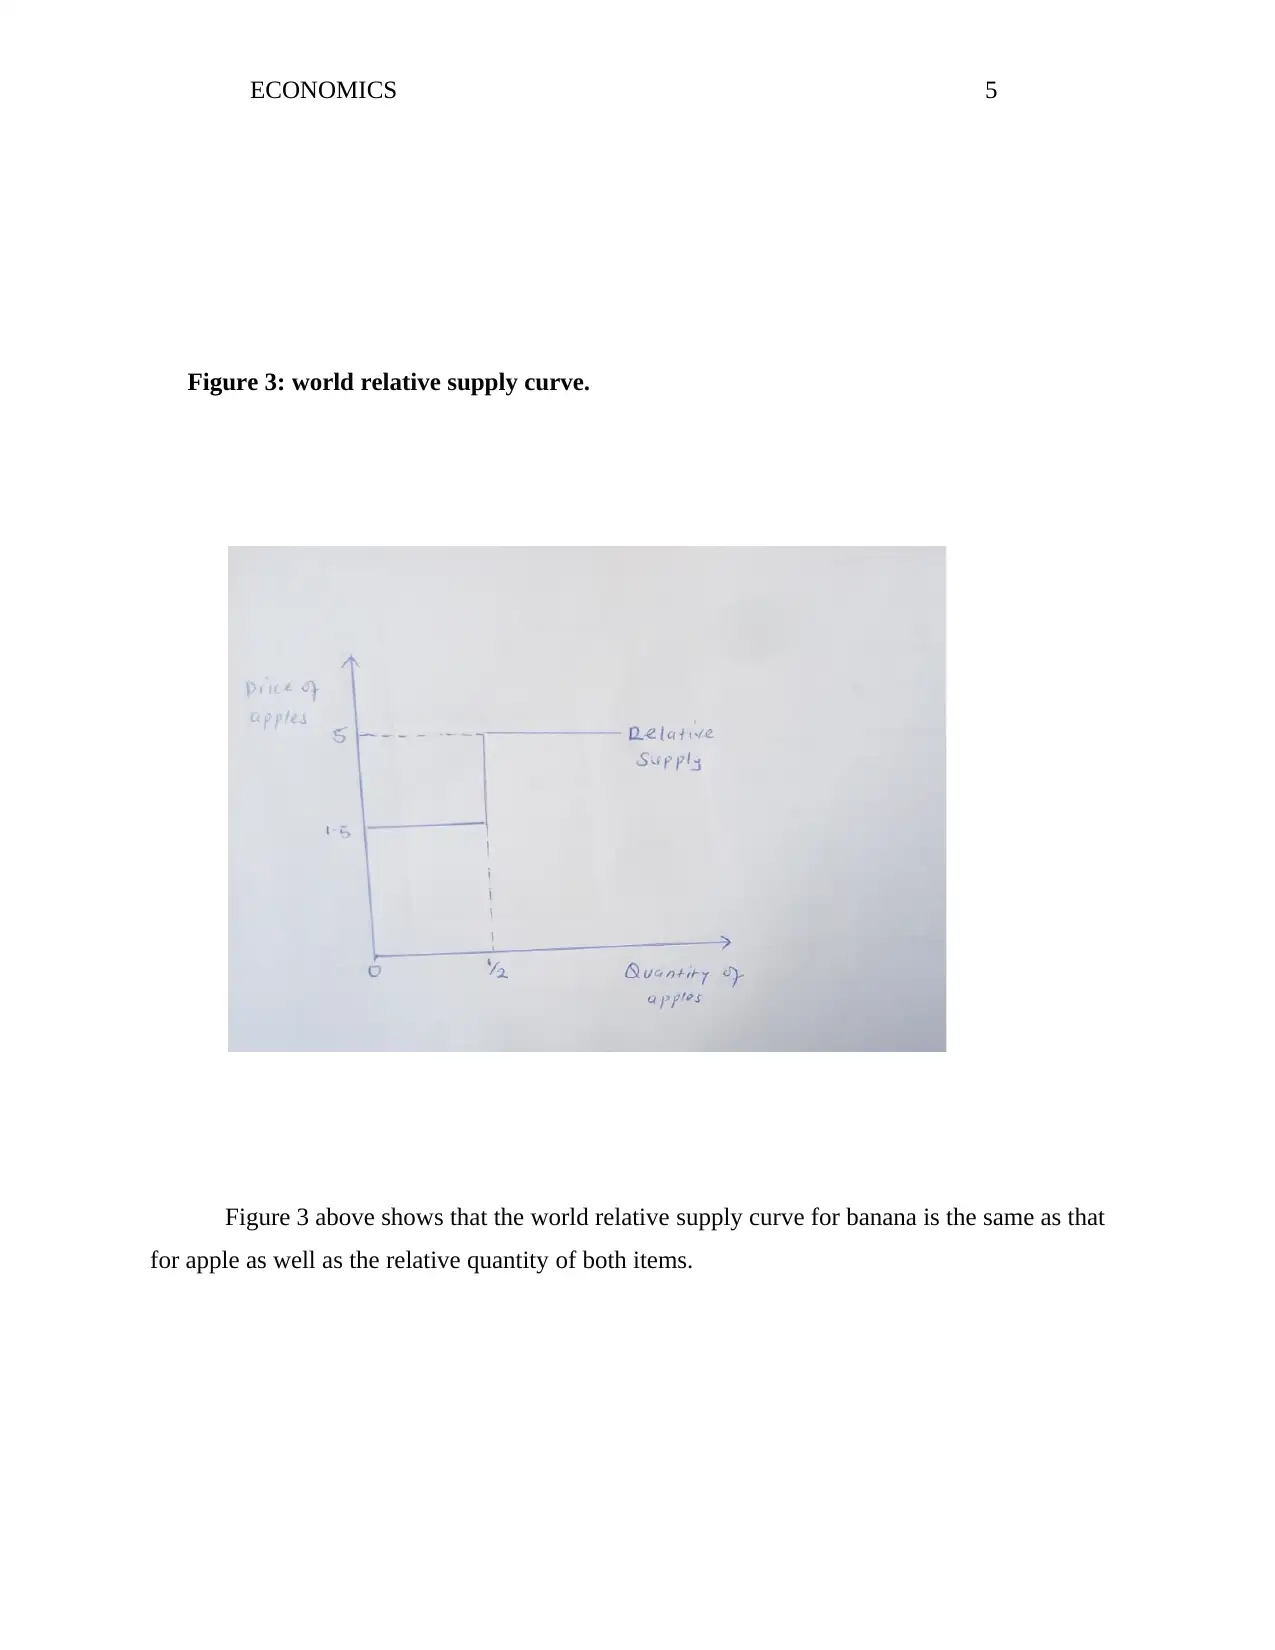
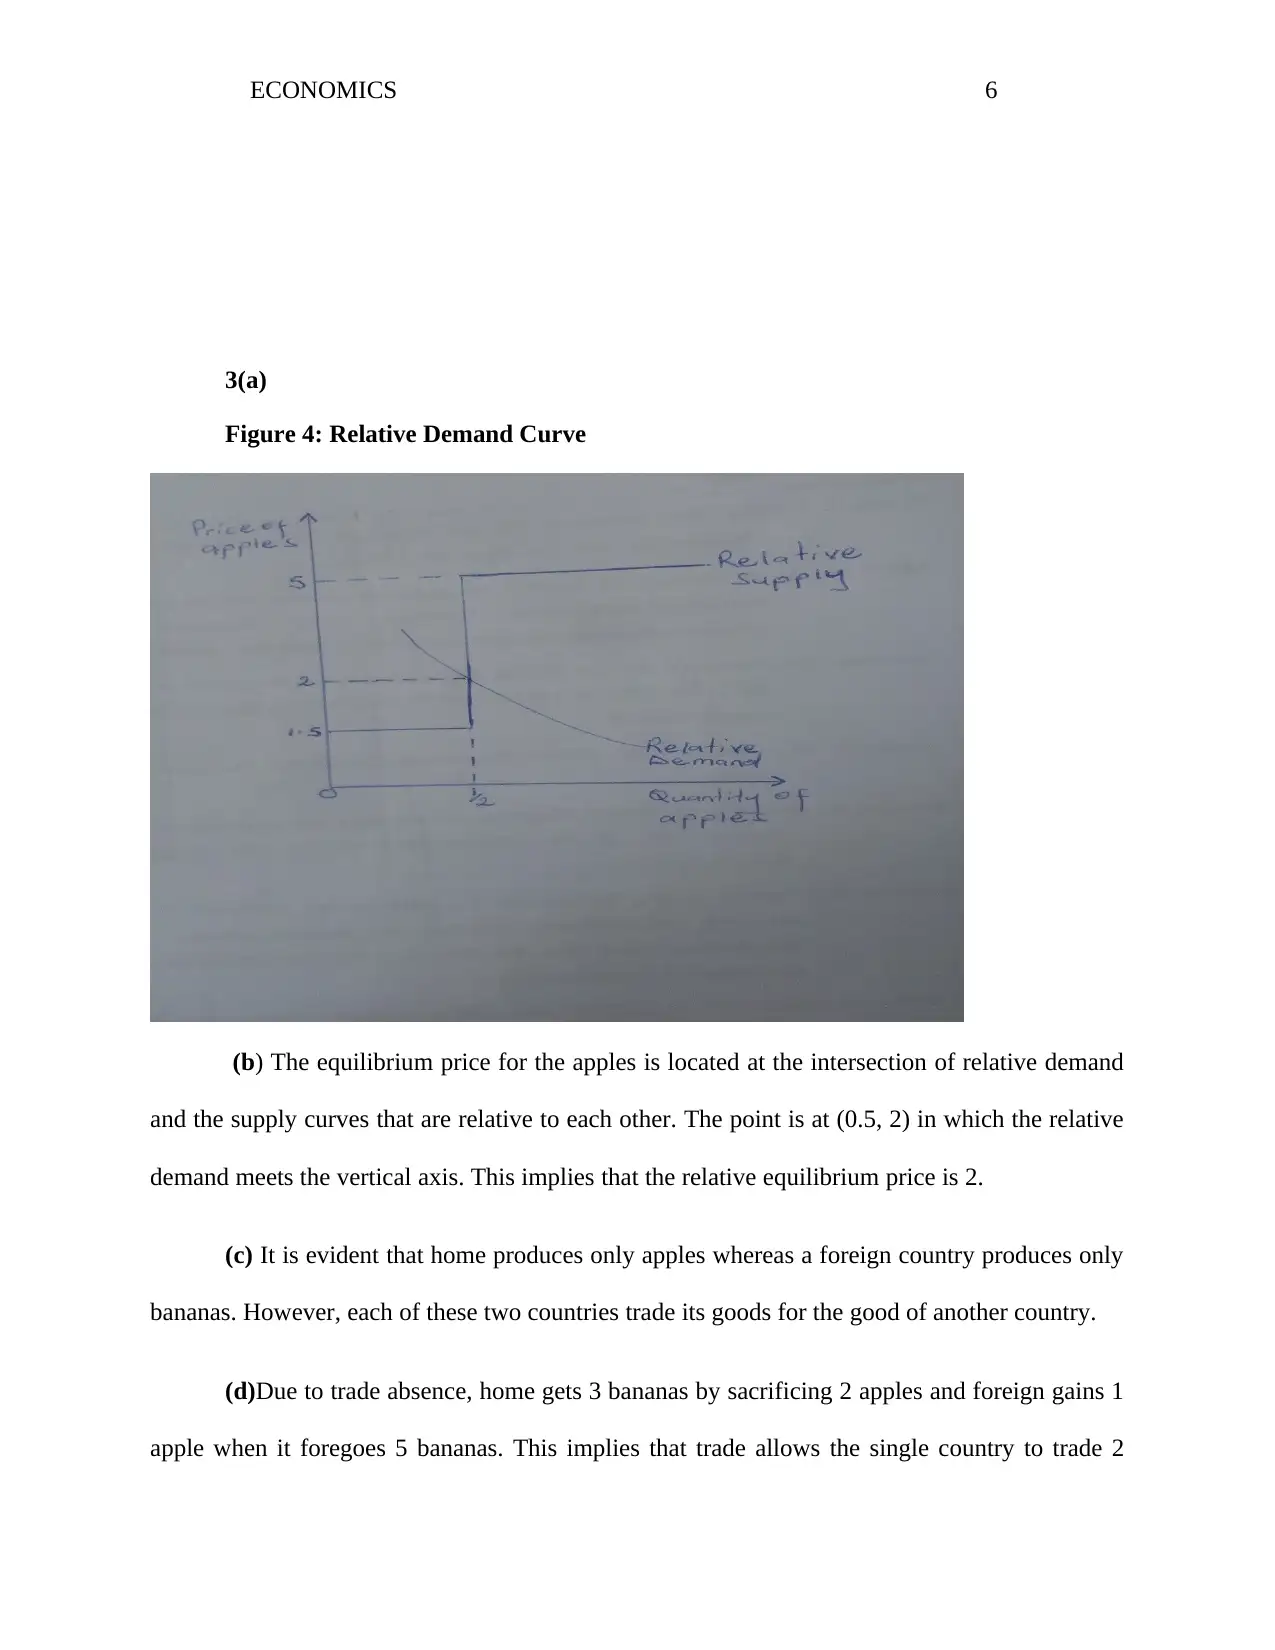
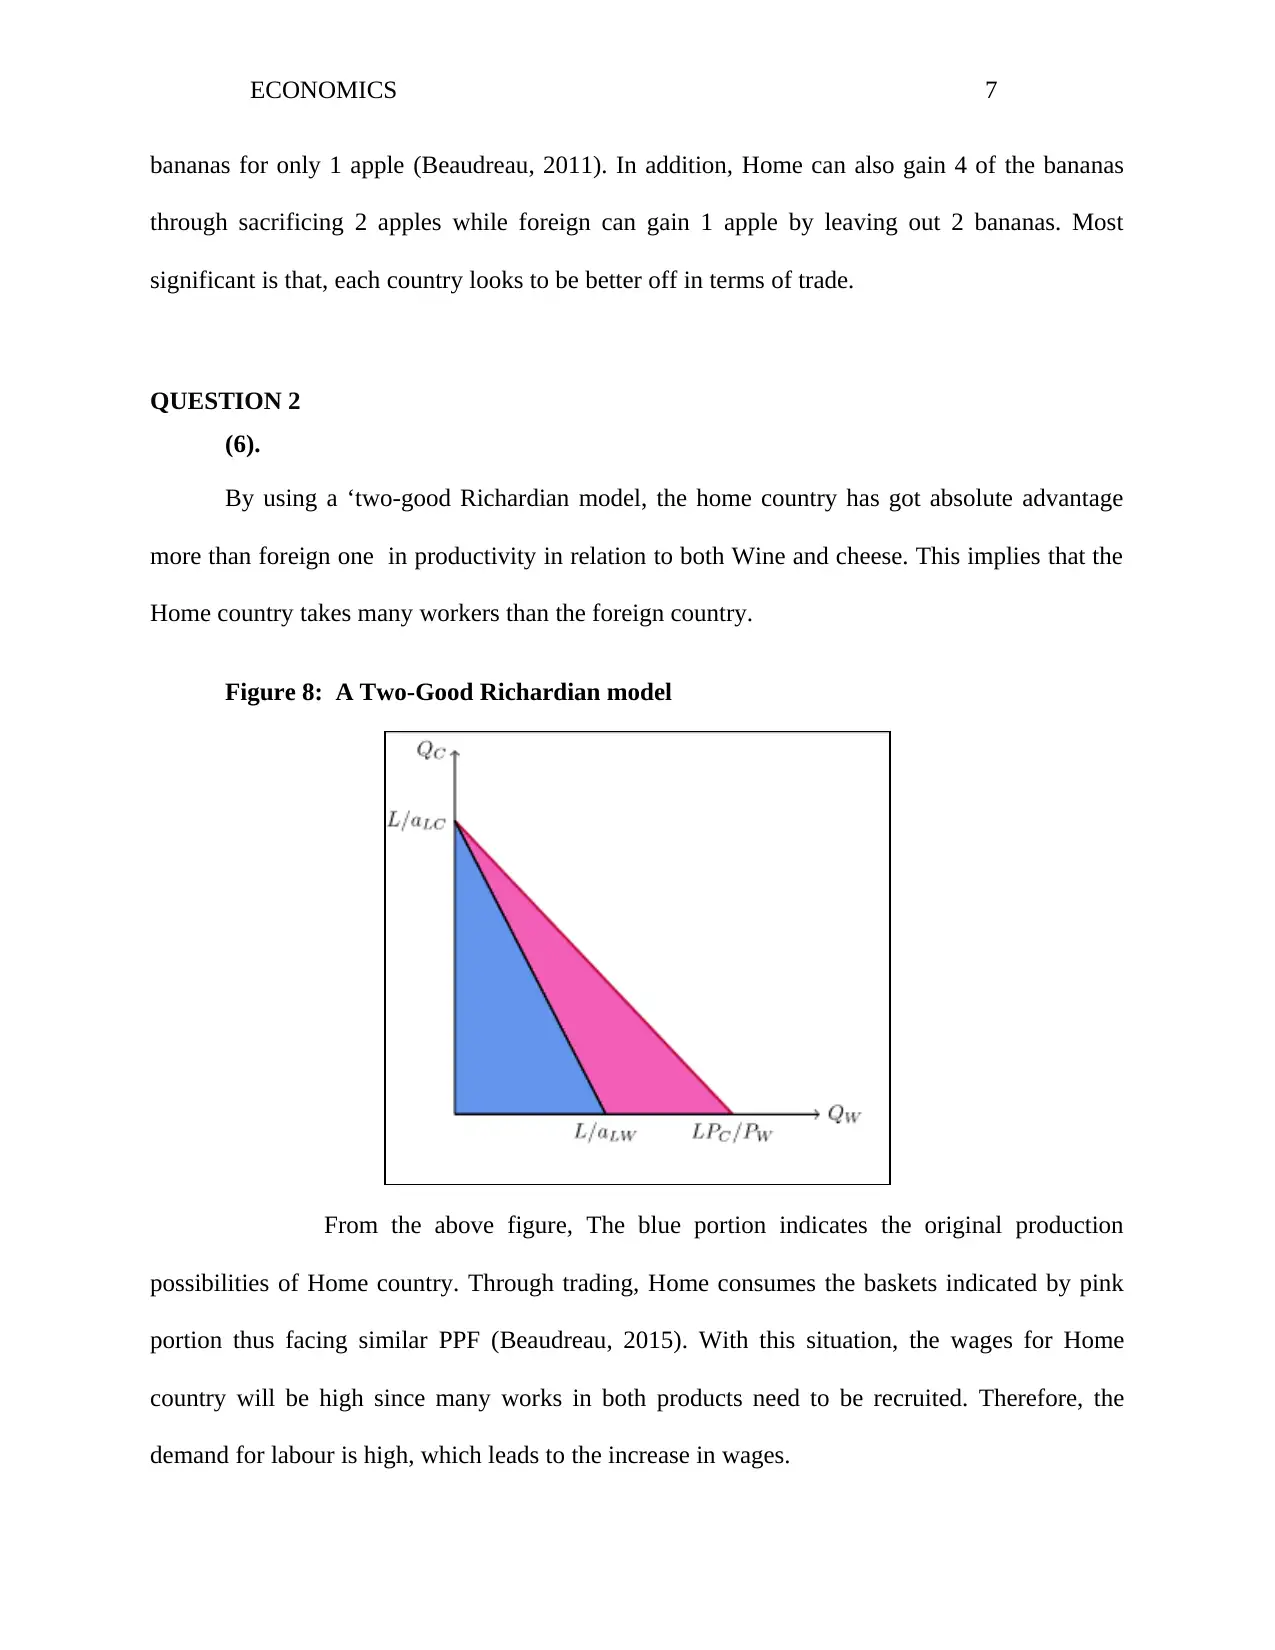
This economics assignment solution analyzes international trade concepts using the Ricardian model. It begins by examining Home's production possibility frontier (PPF) for apples and bananas, calculating opportunity costs and relative prices in the absence of trade. The solution then introduces a Foreign country, constructing both countries' PPFs and the world relative supply curve. The equilibrium relative price is determined by graphing the relative demand curve and the relative supply curve, followed by a description of the trade pattern and demonstration of gains from trade for both countries. The assignment further explores the impact of changes in the labor force and analyzes a two-good Ricardian model, including labor allocation and the effects of changes in relative prices on wages and welfare. The solution incorporates graphs illustrating production functions, PPFs, and labor allocation, and concludes with a discussion of how an increase in capital supply influences the PPF and trade patterns.

Running Head: ECONOMICS 1
International Trade
Name
Institutional Affiliation
Date
International Trade
Name
Institutional Affiliation
Date
Paraphrase This Document
Need a fresh take? Get an instant paraphrase of this document with our AI Paraphraser

ECONOMICS 2
Solution
1. (a)
Total units of labour available∈Home
labour requrement ∈apple production =1200/3 = 400 units
Home consumption has 1200 units of labor when wholly utilized produces 400 apples
Total units of labour available∈ Home
labour requrement∈banana production = 1200/2 = 600 bananas, this means that 6oo bananas
will be produce when all units of labor is utilized.
By putting Apples on vertical axis and bananas on horizontal, the line is connected to link the
two items thus opportunity cost.
Figure 1: Production Possibility Frontier

ECONOMICS 3
(b) The opportunity cost of apples in terms of bananas = Unit labour requirementof apple
labor requirement ∈banana production
= 3/2 = 1.5
Therefore, when the economy foregoes to produce apples, the amount of labor used to produce
bananas will be 1.5
(c) when international trade doesn’t exist, both goods would be produced by Home. But for
Home to produce both Apple and Bananas, the ‘relative price’ of apple in terms of bananas
should be equal to the opportunity cost.
Thus relative price of apple in terms of bananas is equivalent to the relative production labor cost
and so it is given by wage x unit labour requirement for apple
wage x unit labour requirement for bananas
= wage x 3
wage x 2
= 3/2
The reason for this is because when opportunity cost is equal to the ratio of labor units required
in apples and bananas, the relative prices for the products is the labor unit requirement. This is
because labor is considered the only factor of production.
4. The rise in number of workers from 1200 to 2400 at Home forces the ‘relative supply
schedule’ to shift. The equilibrium relative price is now 3/2. In this situation, Foreign still
benefits from trade, however, the opportunity cost for bananas in terms of apples for the Home is
similar minus considering the presence or the absence of trade and so Home does not gain and it
does not lose from trade too (Beaudreau, 2011).
⊘ This is a preview!⊘
Do you want full access?
Subscribe today to unlock all pages.

Trusted by 1+ million students worldwide

ECONOMICS 4
5. The graph is similar to that in solution 3. This is because the total ‘effective labour’ remains
the same since doubling the labour force goes hand in hand with ‘halving’ the labour
productivity.
2 (a)
To graph the Foreign’s PPF, 800/5 = 160 production of apple and 800/1 = 800 bananas
Therefore, this is graphed by putting apples on vertical axis and bananas on the horizontal
axis.
Figure 2: Graph showing Foreign PFF
This implies that a foreign country should forego 5 units of apple which could bring 5
bananas. Therefore, the opportunity cost of a single unit of apple is 5 bananas.
2. (b)
Paraphrase This Document
Need a fresh take? Get an instant paraphrase of this document with our AI Paraphraser

ECONOMICS 5
Figure 3: world relative supply curve.
Figure 3 above shows that the world relative supply curve for banana is the same as that
for apple as well as the relative quantity of both items.
Figure 3: world relative supply curve.
Figure 3 above shows that the world relative supply curve for banana is the same as that
for apple as well as the relative quantity of both items.

ECONOMICS 6
3(a)
Figure 4: Relative Demand Curve
(b) The equilibrium price for the apples is located at the intersection of relative demand
and the supply curves that are relative to each other. The point is at (0.5, 2) in which the relative
demand meets the vertical axis. This implies that the relative equilibrium price is 2.
(c) It is evident that home produces only apples whereas a foreign country produces only
bananas. However, each of these two countries trade its goods for the good of another country.
(d)Due to trade absence, home gets 3 bananas by sacrificing 2 apples and foreign gains 1
apple when it foregoes 5 bananas. This implies that trade allows the single country to trade 2
⊘ This is a preview!⊘
Do you want full access?
Subscribe today to unlock all pages.

Trusted by 1+ million students worldwide

ECONOMICS 7
bananas for only 1 apple (Beaudreau, 2011). In addition, Home can also gain 4 of the bananas
through sacrificing 2 apples while foreign can gain 1 apple by leaving out 2 bananas. Most
significant is that, each country looks to be better off in terms of trade.
QUESTION 2
(6).
By using a ‘two-good Richardian model, the home country has got absolute advantage
more than foreign one in productivity in relation to both Wine and cheese. This implies that the
Home country takes many workers than the foreign country.
Figure 8: A Two-Good Richardian model
From the above figure, The blue portion indicates the original production
possibilities of Home country. Through trading, Home consumes the baskets indicated by pink
portion thus facing similar PPF (Beaudreau, 2015). With this situation, the wages for Home
country will be high since many works in both products need to be recruited. Therefore, the
demand for labour is high, which leads to the increase in wages.
Paraphrase This Document
Need a fresh take? Get an instant paraphrase of this document with our AI Paraphraser

ECONOMICS 8
Question 3
Question 3
2(a)
The production functions of good 1 is graphed by using labor units and output units.
Since capital is provided as fixed, it cannot change the output units but labor units can change the
output units and so only labor can bring out the shape of a production curve. The graph below
portrays the production function of good 1 taking labor to be on the horizontal axis and output
units on the vertical axis
Figure 5: Production function for Good 1
Question 3
Question 3
2(a)
The production functions of good 1 is graphed by using labor units and output units.
Since capital is provided as fixed, it cannot change the output units but labor units can change the
output units and so only labor can bring out the shape of a production curve. The graph below
portrays the production function of good 1 taking labor to be on the horizontal axis and output
units on the vertical axis
Figure 5: Production function for Good 1

ECONOMICS 9
⊘ This is a preview!⊘
Do you want full access?
Subscribe today to unlock all pages.

Trusted by 1+ million students worldwide

ECONOMICS 10
Figure 6: production function of good 2
(b) The production possibility frontier refers to a graph that portrays a combination of
two commodities that may be produced using the same amount of resources. Labor is a variable
factor that differs in production of good 1 to good 2. The graph below is a production possibility
frontier that shows good 1 on the x axis and good 2 on the y axis.
Paraphrase This Document
Need a fresh take? Get an instant paraphrase of this document with our AI Paraphraser

ECONOMICS 11
Figure 7: Production possibility frontier
The PPC curve is curved because the opportunity cost is increasing. This means that in
order to produce more of good 1, more resources have to be provided for the production.
(3) a.
By considering the assumption of labor that is mobile between the sectors, therefore, labour
moves from a sector that pays low wage until when the wages are put into equilibrium
(Cinquetti, 2018). Therefore, for equilibrium, the rate of wage is equaled to the value of marginal
product for labour.
P1 * MPL1 = P2*MPL2
=P2/P1 = 2
Figure 8: The Labour Allocation

ECONOMICS 12
The Points’ abscissa for intersection that is illustrated above should lie between the coordinate of
(20, 30). This is because the exact and appropriate answer should be found so that the linear
function is employed. Therefore, the labour allocation between the sectors is estimated to 73
units with the corresponding wage rate is 0.98.
(b)
Figure 9: The PPF for Relative Price
⊘ This is a preview!⊘
Do you want full access?
Subscribe today to unlock all pages.

Trusted by 1+ million students worldwide
1 out of 17
Related Documents

Your All-in-One AI-Powered Toolkit for Academic Success.
+13062052269
info@desklib.com
Available 24*7 on WhatsApp / Email
Unlock your academic potential
Copyright © 2020–2025 A2Z Services. All Rights Reserved. Developed and managed by ZUCOL.