Economics Report: Analyzing GDP and Life Satisfaction Relationship

Verified

Added on  2022/08/13

|14
|1953
|12
Report
AI Summary
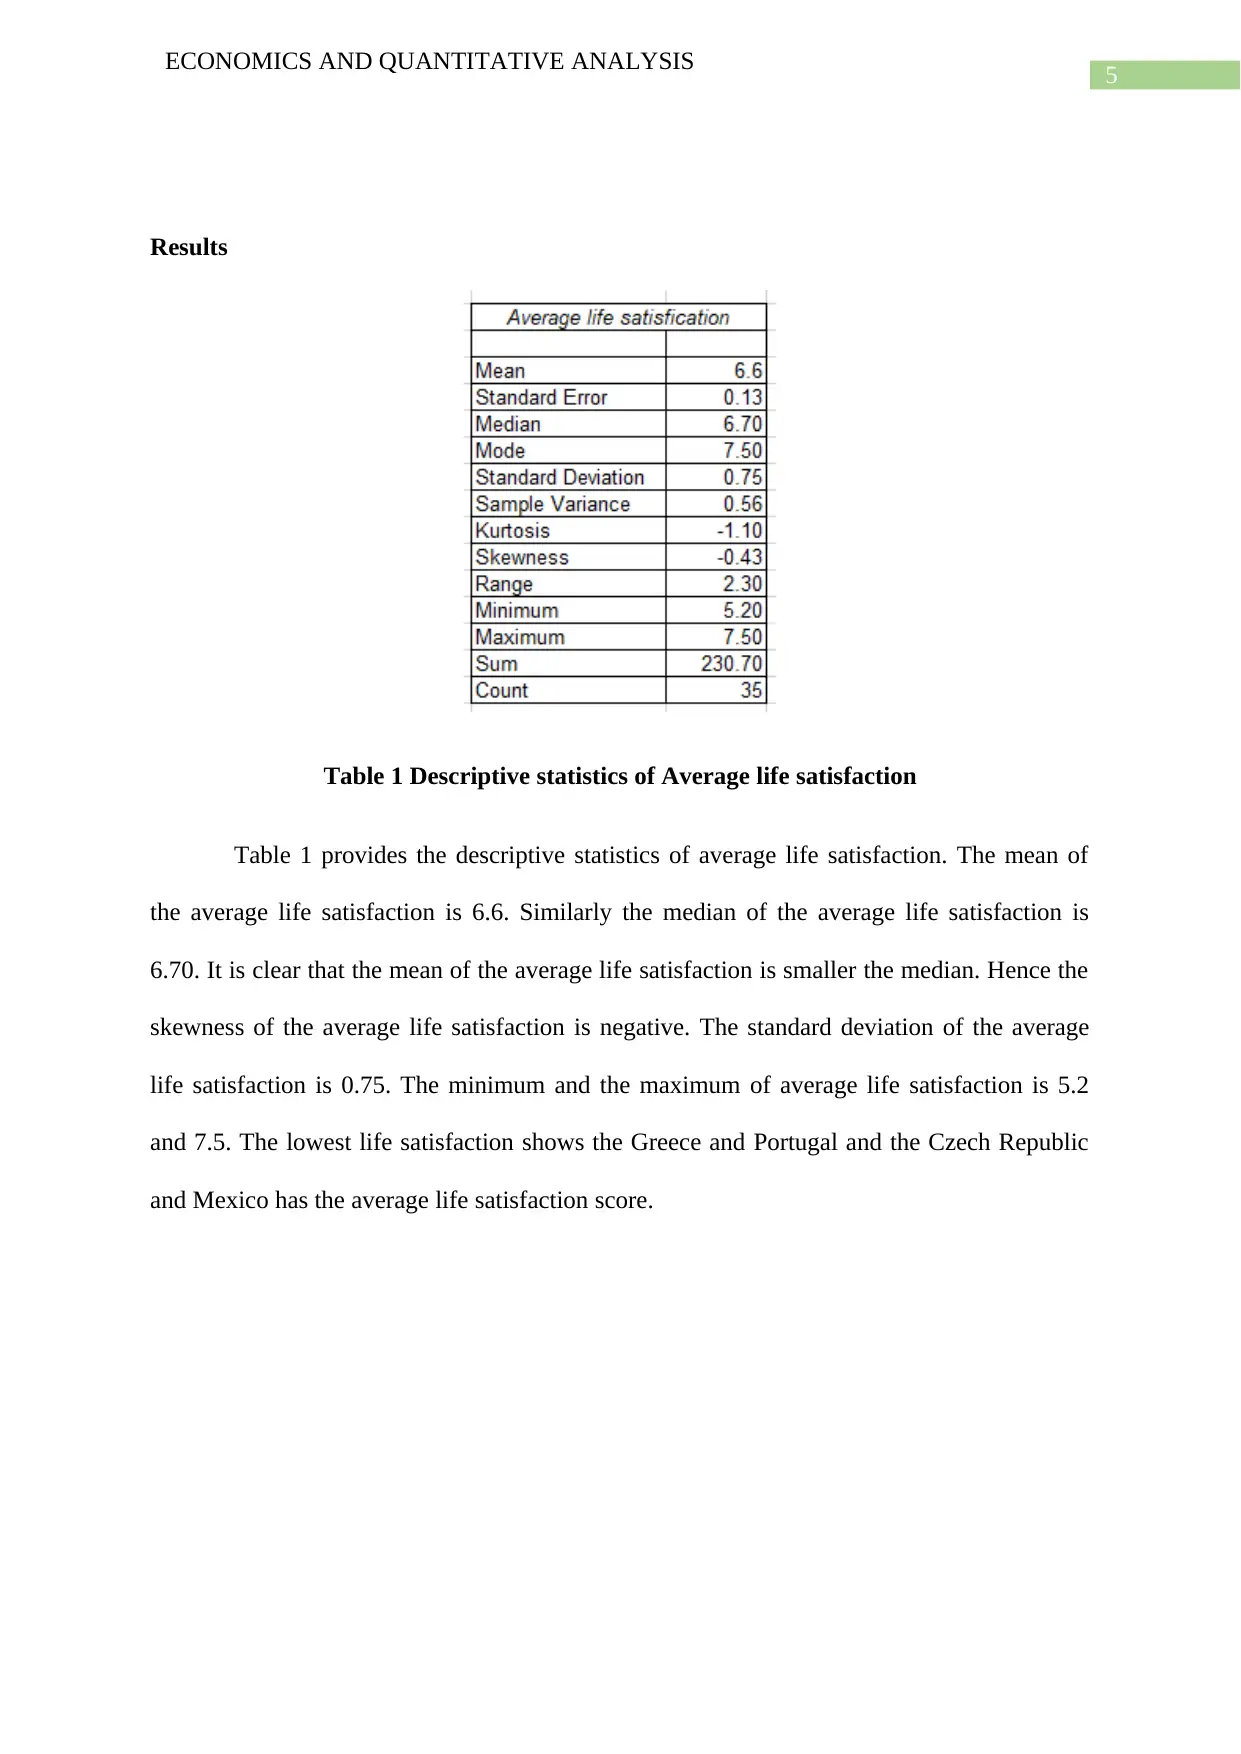
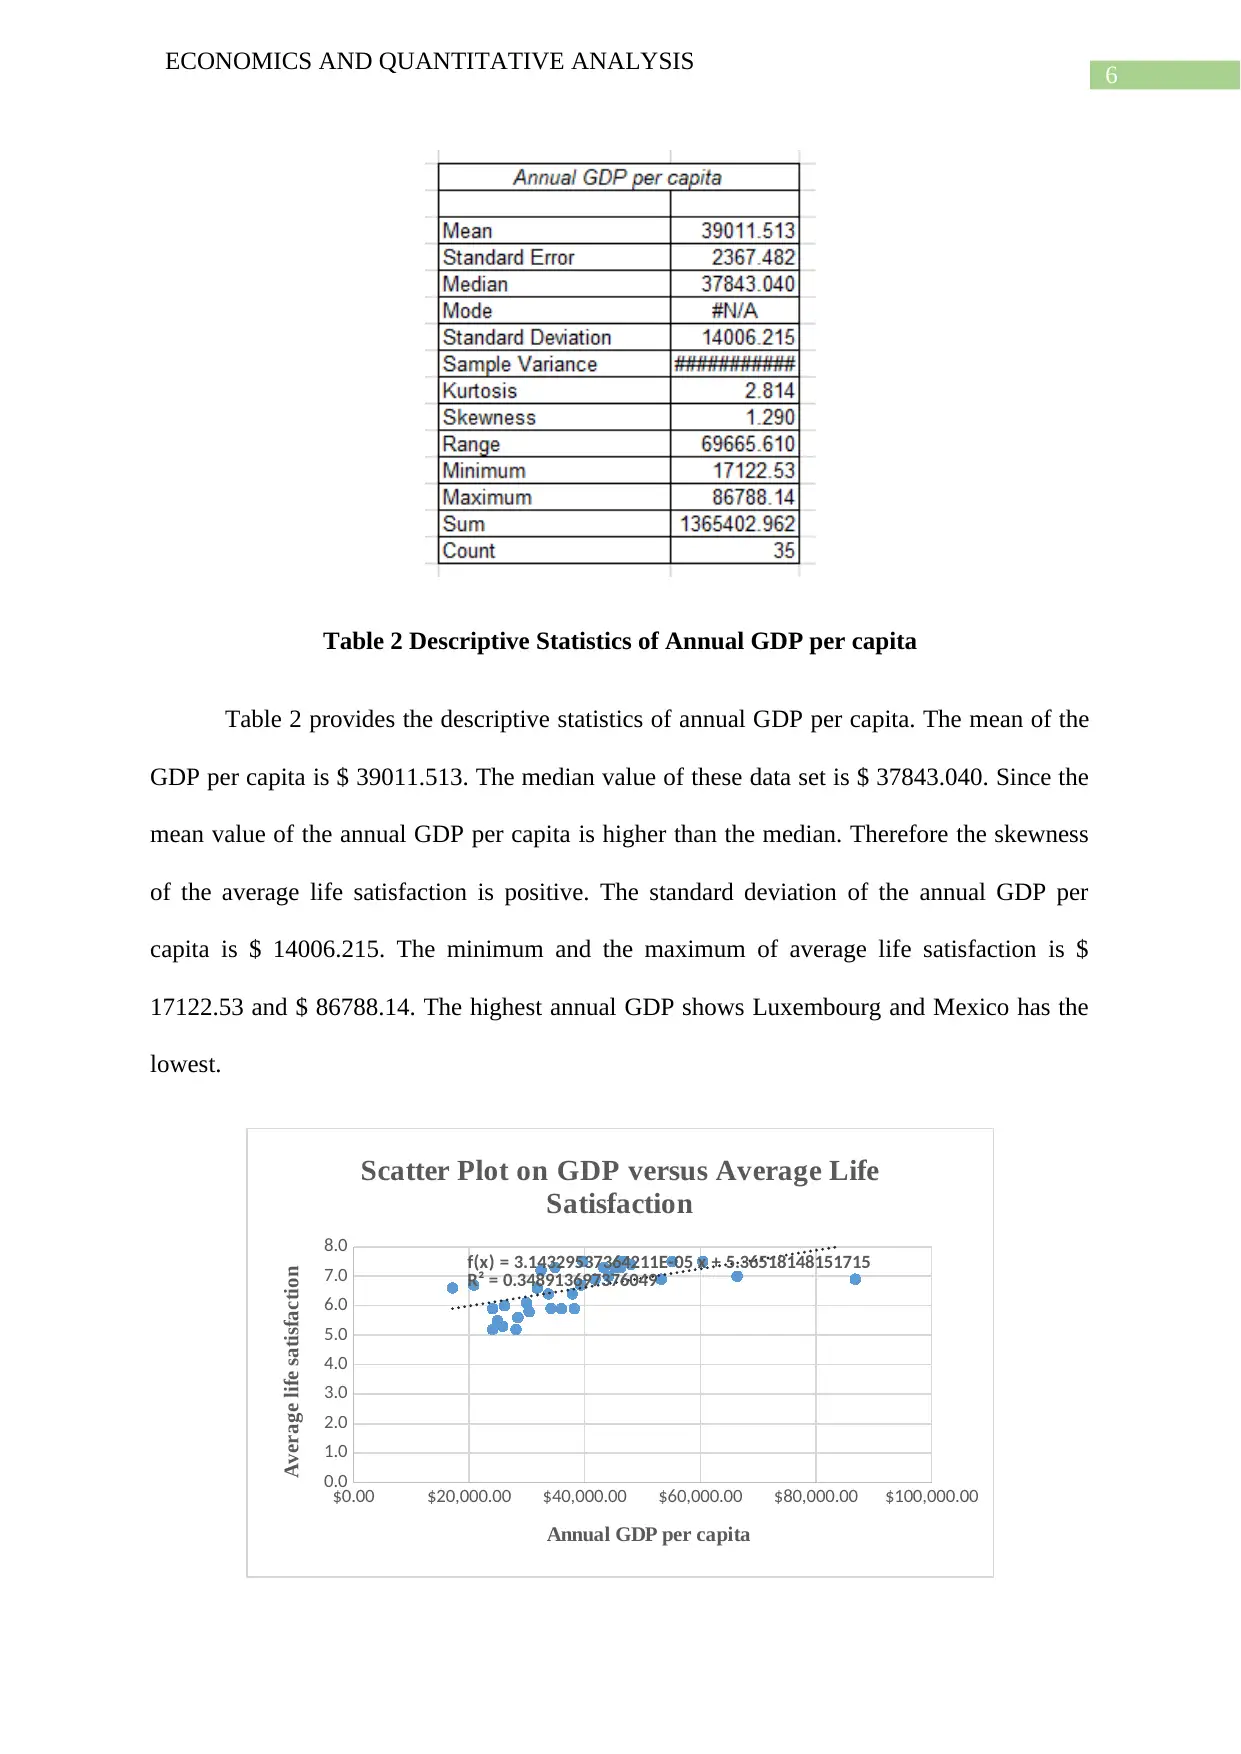
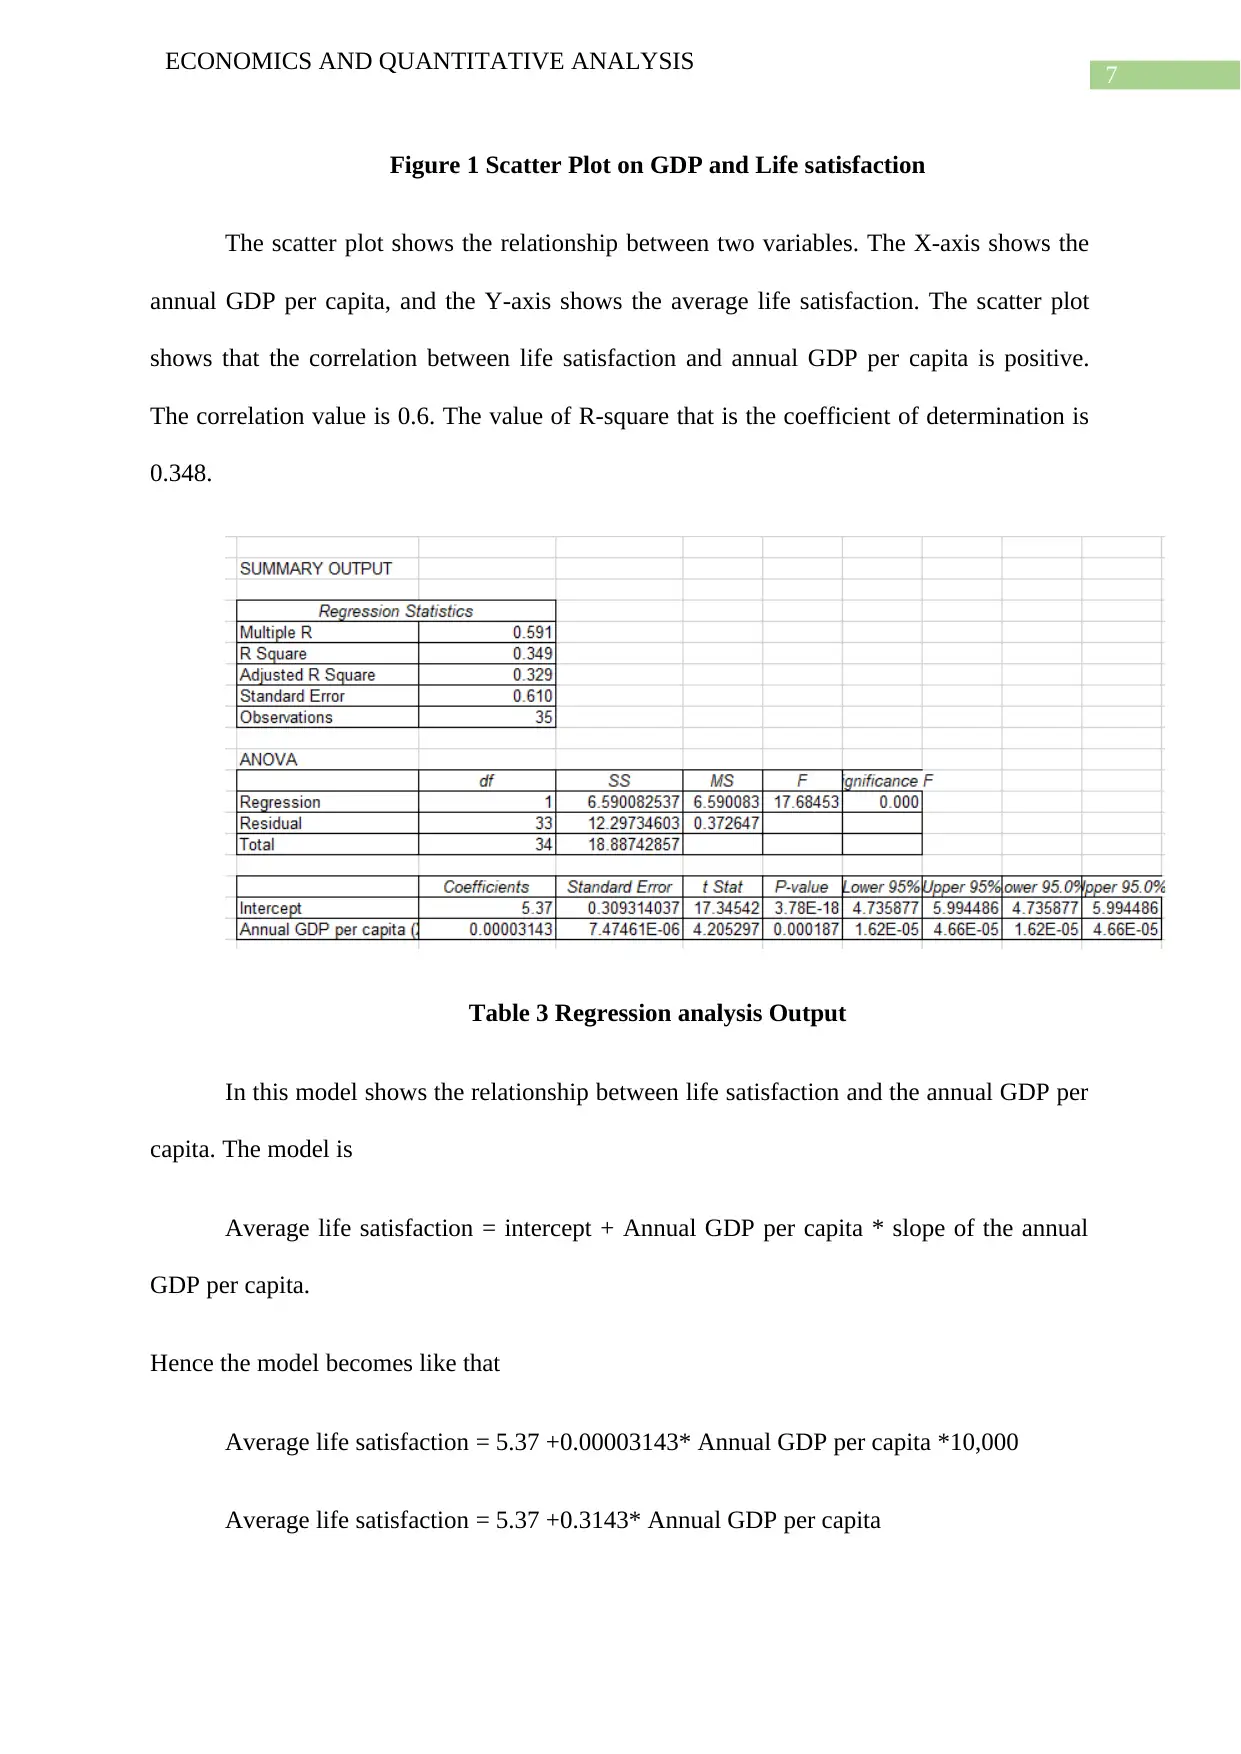
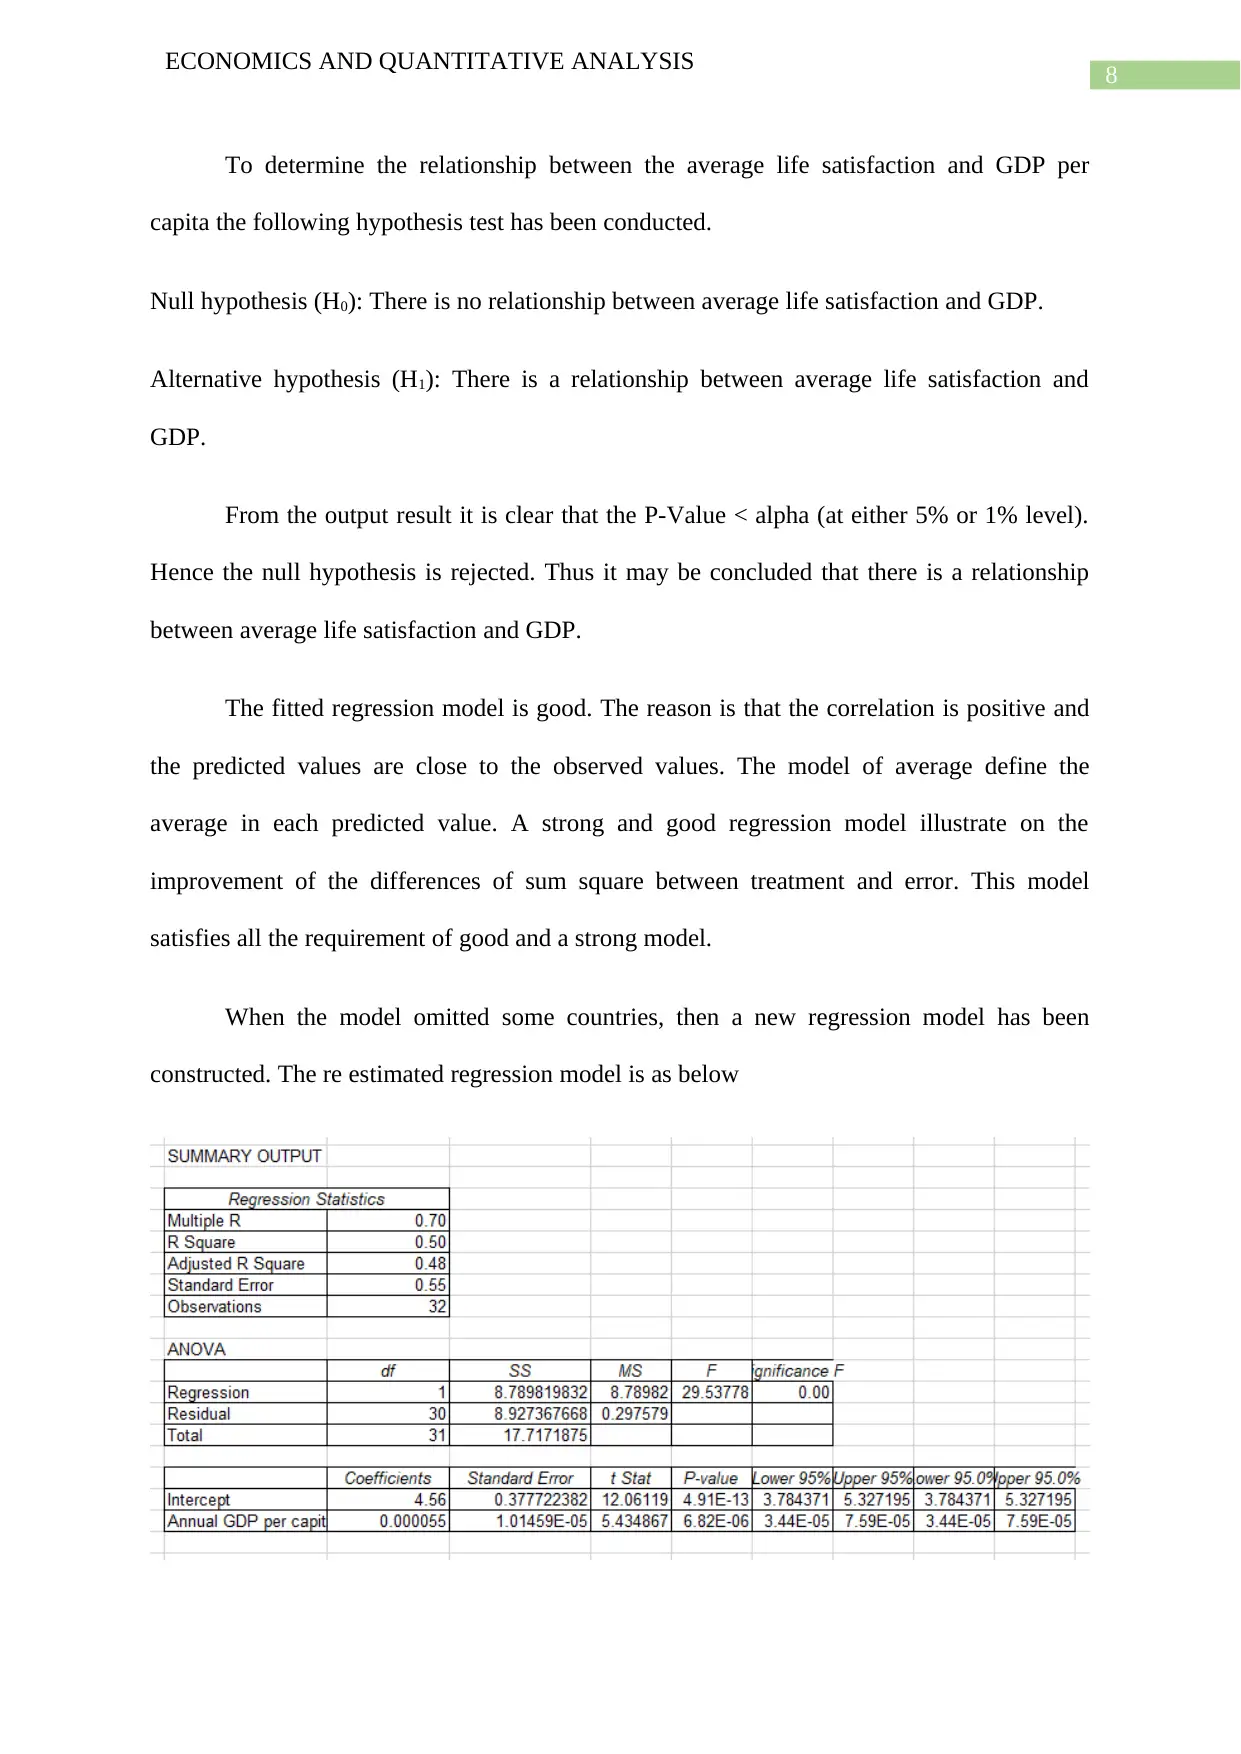
This report examines the statistical association between average life satisfaction and GDP per capita, focusing on data from 35 selected countries in 2017. The study employs descriptive statistics (mean, median, standard deviation) and inferential statistics (linear regression) to analyze the relationship between these two variables. The findings reveal a positive correlation between GDP and life satisfaction, with a correlation value of 0.6 and an R-squared value of 0.348. The report includes a discussion on the policy implications, limitations (e.g., effect of outliers), and recommendations for further research. The re-estimated regression model improved results. The analysis highlights the importance of factors beyond GDP, such as human capital and structural development, in achieving life satisfaction, especially in countries like Greece, which have low life satisfaction scores despite their GDP.
tabler-icon-diamond-filled.svg

Contribute Materials

Your contribution can guide someone’s learning journey. Share your documents today.
Document Page
Running head: ECONOMICS AND QUANTITATIVE ANALYSIS
Economics and Quantitative Analysis
Name of the student:
Name of the University:
Author note:
tabler-icon-diamond-filled.svg

Secure Best Marks with AI Grader

Need help grading? Try our AI Grader for instant feedback on your assignments.
Document Page
1
ECONOMICS AND QUANTITATIVE ANALYSIS
Table of Contents
Purpose.......................................................................................................................................2
Background................................................................................................................................3
Method.......................................................................................................................................4
Results........................................................................................................................................5
Discussion................................................................................................................................10
Recommendation......................................................................................................................11
References and Bibliography...................................................................................................12
Document Page
2
ECONOMICS AND QUANTITATIVE ANALYSIS
Purpose
The purpose of this study is to determine and signify statistically of some variables.
These variables are the average life satisfaction and Gross Domestic Product (GDP) per
capita. This study illustrates the descriptive statistics that is the summary measure and the
inferential statistics that is the linear regression model has been defined based on the average
life satisfaction and Gross Domestic Product (GDP).
Document Page
3
ECONOMICS AND QUANTITATIVE ANALYSIS
Background
The life satisfaction is the determination of life of a person instead of present feelings.
It is also called the monotonic increasing function in the presence of income of a person or a
nation at some point (Proto and Rustichini 2013). The major aim of this study is to determine
the relationship between the life satisfaction and the gross domestic product per capita. The
purchasing power of parity defines that when a nation has a gross domestic product of fewer
than 15,000 USD, then this reflect the riches power of the country is on the downward
direction. This study illustrates the life satisfaction and gross domestic product per capita
among different countries of the world. The most noticeable point of this study is that the
there are some factors which is depends on the different countries. It has been seen from the
purchasing power of parity that the probability of maximum level of satisfaction of life is
more than 12% or less in the nations in respect of a poor per capita gross domestic product
which is fewer than 5,600 USD in the comparison with the countries with per capita GDP
15,000 USD (Balestra, Boarini and Tosetto 2018). The definition of life satisfaction is
different on different countries, which is based on the USD level is different among the high
or low GDP of a country (Brown, Oueslati and Silva 2016). The study on life satisfaction and
GDP per capita helps to the economist that to signify the presence of high or low gross
domestic product and their differentiation with respect to life satisfaction among the selected
different countries.
tabler-icon-diamond-filled.svg

Secure Best Marks with AI Grader

Need help grading? Try our AI Grader for instant feedback on your assignments.
Document Page
4
ECONOMICS AND QUANTITATIVE ANALYSIS
Method
The study on life satisfaction versus gross domestic product per capita has been done
based upon 35 selected countries. The descriptive and the inferential analysis has been
conducted to determine the relationship between the two variables. The central tendency,
measure of dispersion has been illustrated on the section of descriptive statistics. Moreover
the simple linear regression model has been established among these two variables on the
section of inferential statistics among 35 selected countries. The sample observation has been
selected on the period of 2017. The life satisfaction has been measured on the scale of 5 to 8.
Moreover the unit of gross domestic product has been applied at dollar scale. In the excel
sheet using the data analysis tool pack the mean, median, mode, variance, standard deviation,
rage and simple linear regression has been determined. The general simple linear linear
regression model is as below
Dependent variable = Intercept + Independent variables * slope of the independent
variable (Chatterjee and Hadi 2015)
The life satisfaction has been taken as a dependent variable and the gross domestic
product has been taken as independent variable. The inferential statistics that in the regression
the coefficient of determination, correlation, standard error, test statistic, confidence interval
and critical value has been shown.
Document Page
5
ECONOMICS AND QUANTITATIVE ANALYSIS
Results
Table 1 Descriptive statistics of Average life satisfaction
Table 1 provides the descriptive statistics of average life satisfaction. The mean of
the average life satisfaction is 6.6. Similarly the median of the average life satisfaction is
6.70. It is clear that the mean of the average life satisfaction is smaller the median. Hence the
skewness of the average life satisfaction is negative. The standard deviation of the average
life satisfaction is 0.75. The minimum and the maximum of average life satisfaction is 5.2
and 7.5. The lowest life satisfaction shows the Greece and Portugal and the Czech Republic
and Mexico has the average life satisfaction score.
Document Page
6
ECONOMICS AND QUANTITATIVE ANALYSIS
Table 2 Descriptive Statistics of Annual GDP per capita
Table 2 provides the descriptive statistics of annual GDP per capita. The mean of the
GDP per capita is $ 39011.513. The median value of these data set is $ 37843.040. Since the
mean value of the annual GDP per capita is higher than the median. Therefore the skewness
of the average life satisfaction is positive. The standard deviation of the annual GDP per
capita is $ 14006.215. The minimum and the maximum of average life satisfaction is $
17122.53 and $ 86788.14. The highest annual GDP shows Luxembourg and Mexico has the
lowest.
$0.00 $20,000.00 $40,000.00 $60,000.00 $80,000.00 $100,000.00
0.0
1.0
2.0
3.0
4.0
5.0
6.0
7.0
8.0 f(x) = 3.14329537364211E-05 x + 5.36518148151715
R² = 0.348913697376049
Scatter Plot on GDP versus Average Life
Satisfaction
Annual GDP per capita
Average life satisfaction
tabler-icon-diamond-filled.svg

Paraphrase This Document

Need a fresh take? Get an instant paraphrase of this document with our AI Paraphraser
Document Page
7
ECONOMICS AND QUANTITATIVE ANALYSIS
Figure 1 Scatter Plot on GDP and Life satisfaction
The scatter plot shows the relationship between two variables. The X-axis shows the
annual GDP per capita, and the Y-axis shows the average life satisfaction. The scatter plot
shows that the correlation between life satisfaction and annual GDP per capita is positive.
The correlation value is 0.6. The value of R-square that is the coefficient of determination is
0.348.
Table 3 Regression analysis Output
In this model shows the relationship between life satisfaction and the annual GDP per
capita. The model is
Average life satisfaction = intercept + Annual GDP per capita * slope of the annual
GDP per capita.
Hence the model becomes like that
Average life satisfaction = 5.37 +0.00003143* Annual GDP per capita *10,000
Average life satisfaction = 5.37 +0.3143* Annual GDP per capita
Document Page
8
ECONOMICS AND QUANTITATIVE ANALYSIS
To determine the relationship between the average life satisfaction and GDP per
capita the following hypothesis test has been conducted.
Null hypothesis (H0): There is no relationship between average life satisfaction and GDP.
Alternative hypothesis (H1): There is a relationship between average life satisfaction and
GDP.
From the output result it is clear that the P-Value < alpha (at either 5% or 1% level).
Hence the null hypothesis is rejected. Thus it may be concluded that there is a relationship
between average life satisfaction and GDP.
The fitted regression model is good. The reason is that the correlation is positive and
the predicted values are close to the observed values. The model of average define the
average in each predicted value. A strong and good regression model illustrate on the
improvement of the differences of sum square between treatment and error. This model
satisfies all the requirement of good and a strong model.
When the model omitted some countries, then a new regression model has been
constructed. The re estimated regression model is as below
Document Page
9
ECONOMICS AND QUANTITATIVE ANALYSIS
Table 4 Re-Estimated Regression Output
Average life satisfaction = 4.56 +0.000055* Annual GDP per capita
It has been seen that the coefficient of determination on the re-estimated model is
increased. Thus the new model is better model as compared to the table 3 regression model.
tabler-icon-diamond-filled.svg

Secure Best Marks with AI Grader

Need help grading? Try our AI Grader for instant feedback on your assignments.
Document Page
10
ECONOMICS AND QUANTITATIVE ANALYSIS
Discussion
In the economic and quantitative analysis on annual GDP per capita and the average
life satisfaction provides the following results.
The lowest average life satisfaction shows the Greece and Portugal and the average
life satisfaction score shows the Czech Republic and Mexico.
The highest annual GDP per capita shows Luxembourg and the Mexico shows the
lowest.
The relationship on the average life satisfaction and GDP per capita is positive and the
coefficient of correlation is 0.6 and the R- square value is 0.348.
The re-estimated model is strong and better as compared to the original model.
To determine the relationship between two variables the scatter plot and the regression
model is the better method. This is the strength of these studies. The effect of outliers is the
limitations of this study. This is the reason that re estimate the regression model.
This studies provides a consistent result, which similar to the scientific database US
report. These two studies illustrate that there is a positive relationship between life
satisfaction and GDP (Graafland and Lous 2018).
Yes, the finding of this study has clear on the policy implications. But it is also
observed that there some countries which GDP per capita is not sufficient to achieve the life
satisfactions. The factors like human capital and structural development are also an important
Document Page
11
ECONOMICS AND QUANTITATIVE ANALYSIS
factors. Therefore this kind of factors has also been taken into consideration to achieve the
life satisfaction (Balestra, Boarini and Tosetto 2018).
Recommendation
From this study it has been shown that the Greece has lowest life satisfaction scores
among all the 35 selected OECD countries. It is to recommend that the government should
take some role to increase the confident on the population and investors (Brown, Oueslati and
Silva 2016). When the income of a country increases, then the happiness increases. In the
life satisfaction of UK, the significance on the growth in GDP per capita, there was no such
improvements. At that situation the country should focuses on other factors. The environment
is the most important factor which influence the life satisfaction (Brown, Oueslati and Silva
2016).
Document Page
12
ECONOMICS AND QUANTITATIVE ANALYSIS
References and Bibliography
Amrhein, V., Trafimow, D. and Greenland, S., 2019. Inferential statistics as descriptive
statistics: There is no replication crisis if we don’t expect replication. The American
Statistician, 73(sup1), pp.262-270.
Balestra, C., Boarini, R. and Tosetto, E., 2018. What matters most to people? Evidence from
the OECD better life index users’ responses. Social Indicators Research, 136(3), pp.907-930.
Brown, Z.S., Oueslati, W. and Silva, J., 2016. Links between urban structure and life
satisfaction in a cross-section of OECD metro areas. Ecological economics, 129, pp.112-121.
Cameron, A.C. and Trivedi, P.K., 2013. Regression analysis of count data (Vol. 53).
Cambridge university press.
Chatterjee, S. and Hadi, A.S., 2015. Regression analysis by example. John Wiley & Sons.
Graafland, J. and Lous, B., 2018. Economic freedom, income inequality and life satisfaction
in OECD countries. Journal of Happiness Studies, 19(7), pp.2071-2093.
Gunst, R.F., 2018. Regression analysis and its application: a data-oriented approach.
Routledge.
Ho, A.D. and Yu, C.C., 2015. Descriptive statistics for modern test score distributions:
Skewness, kurtosis, discreteness, and ceiling effects. Educational and Psychological
Measurement, 75(3), pp.365-388.
tabler-icon-diamond-filled.svg

Paraphrase This Document

Need a fresh take? Get an instant paraphrase of this document with our AI Paraphraser
Document Page
13
ECONOMICS AND QUANTITATIVE ANALYSIS
Holcomb, Z.C., 2016. Fundamentals of descriptive statistics. Routledge.
Proto, E. and Rustichini, A., 2013. A reassessment of the relationship between GDP and life
satisfaction. PloS one, 8(11).
chevron_up_icon
1 out of 14
circle_padding
hide_on_mobile
zoom_out_icon
logo.png

Your All-in-One AI-Powered Toolkit for Academic Success.

Available 24*7 on WhatsApp / Email

[object Object]