University Finance Report: ACT202/ACT204 - Comprehensive Analysis
VerifiedAdded on 2021/05/31
|24
|2209
|47
Report
AI Summary
This comprehensive report delves into several key areas of management accounting. Part A focuses on the preparation of a master budget, outlining sales, production, direct materials, direct labor, and manufacturing overhead budgets, as well as cash flow projections and an income statement. Part B analyzes a sales manager's investment decision, evaluating the financial implications of expanding the business through a new production site, utilizing flexible budgeting. Part C contrasts participative and imposed budgeting approaches, highlighting the behavioral implications of each. Further, the report addresses impairment of assets, defining a cash-generating unit and outlining the impairment testing process. It then provides a detailed analysis of financial ratios, including liquidity, profitability, and efficiency metrics, to assess a company's financial health. Finally, it discusses the translation of foreign currency transactions in Australian dollars, explaining the current rate method and accounting for foreign exchange gains and losses.
Running head: MANAGEMENT ACCOUNTING
MANAGEMENT ACCOUNTING
Name of the Student:
Name of the University:
Author’s Note:
MANAGEMENT ACCOUNTING
Name of the Student:
Name of the University:
Author’s Note:
Paraphrase This Document
Need a fresh take? Get an instant paraphrase of this document with our AI Paraphraser
1
MANAGEMENT ACCOUNTING
Table of Contents
Assignment Code: ACT202.............................................................................................................2
Part A...........................................................................................................................................2
Preparation of Master Budget......................................................................................................2
Part B...........................................................................................................................................8
Part C...........................................................................................................................................9
Assignment Code: ACT 204..........................................................................................................11
Answer to Question 1................................................................................................................11
Answer to Question 2................................................................................................................12
Answer to Question 3................................................................................................................15
Answer to Question 4:...............................................................................................................16
Reference.......................................................................................................................................21
2
MANAGEMENT ACCOUNTING
Assignment Code: ACT202
Part A
Preparation of Master Budget
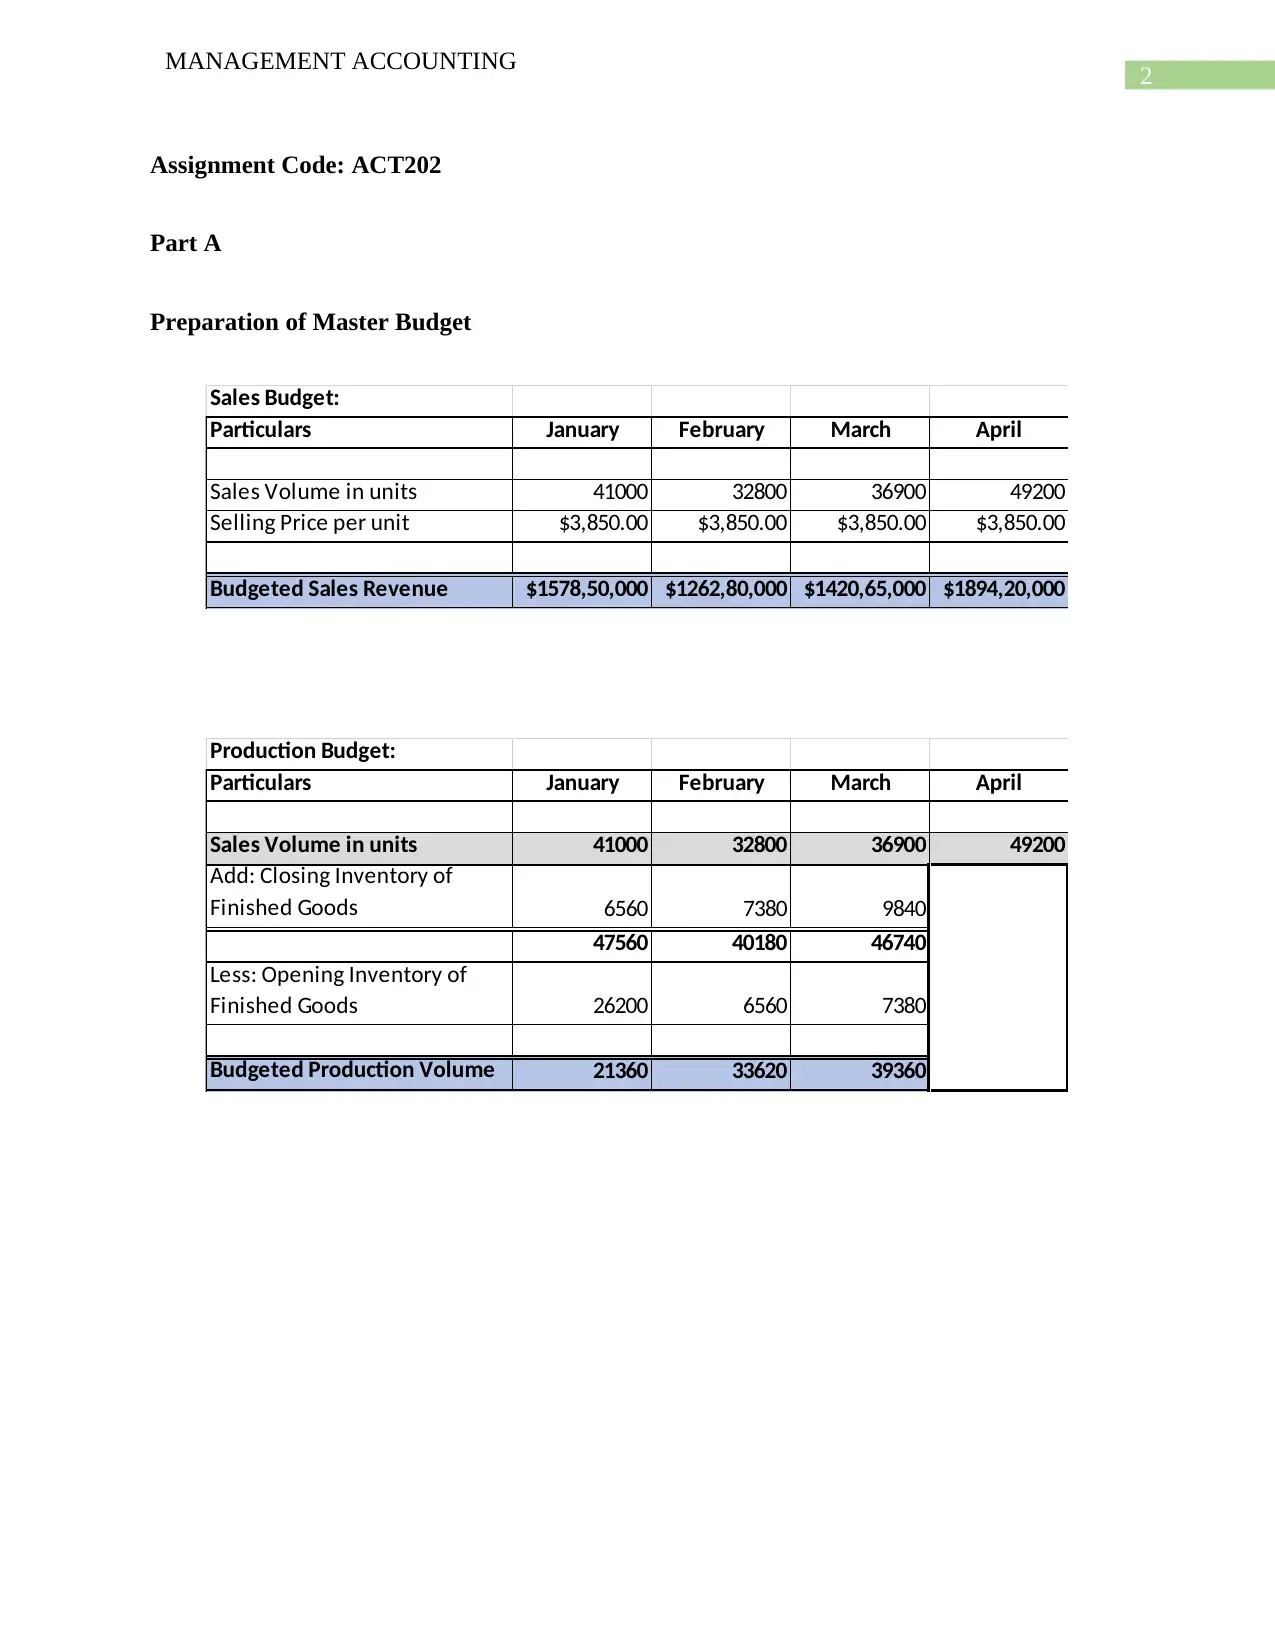
Sales Budget:
Particulars January February March April
Sales Volume in units 41000 32800 36900 49200
Selling Price per unit $3,850.00 $3,850.00 $3,850.00 $3,850.00
Budgeted Sales Revenue $1578,50,000 $1262,80,000 $1420,65,000 $1894,20,000
Production Budget:
Particulars January February March April
Sales Volume in units 41000 32800 36900 49200
Add: Closing Inventory of
Finished Goods 6560 7380 9840
47560 40180 46740
Less: Opening Inventory of
Finished Goods 26200 6560 7380
Budgeted Production Volume 21360 33620 39360
MANAGEMENT ACCOUNTING
Assignment Code: ACT202
Part A
Preparation of Master Budget
Sales Budget:
Particulars January February March April
Sales Volume in units 41000 32800 36900 49200
Selling Price per unit $3,850.00 $3,850.00 $3,850.00 $3,850.00
Budgeted Sales Revenue $1578,50,000 $1262,80,000 $1420,65,000 $1894,20,000
Production Budget:
Particulars January February March April
Sales Volume in units 41000 32800 36900 49200
Add: Closing Inventory of
Finished Goods 6560 7380 9840
47560 40180 46740
Less: Opening Inventory of
Finished Goods 26200 6560 7380
Budgeted Production Volume 21360 33620 39360
⊘ This is a preview!⊘
Do you want full access?
Subscribe today to unlock all pages.
Trusted by 1+ million students worldwide
3
MANAGEMENT ACCOUNTING
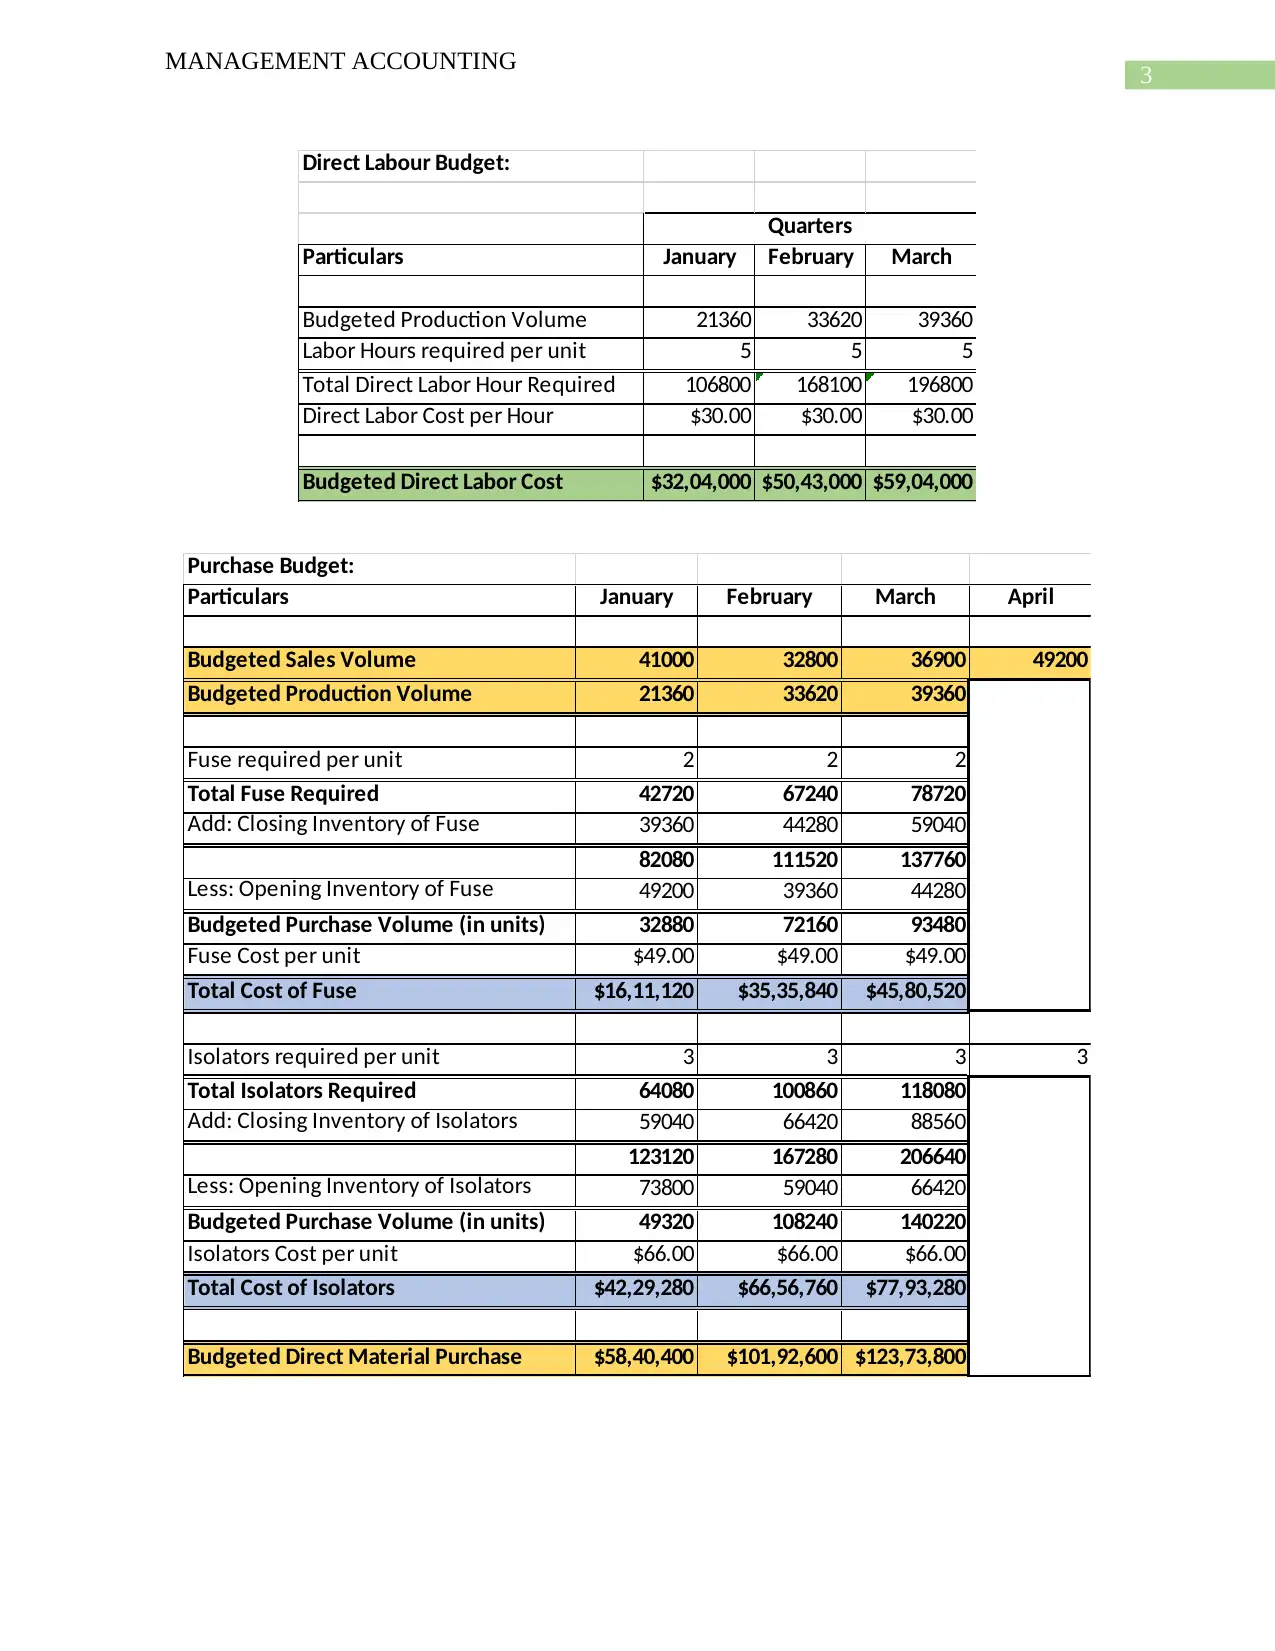
Direct Labour Budget:
Particulars January February March
Budgeted Production Volume 21360 33620 39360
Labor Hours required per unit 5 5 5
Total Direct Labor Hour Required 106800 168100 196800
Direct Labor Cost per Hour $30.00 $30.00 $30.00
Budgeted Direct Labor Cost $32,04,000 $50,43,000 $59,04,000
Quarters
Purchase Budget:
Particulars January February March April
Budgeted Sales Volume 41000 32800 36900 49200
Budgeted Production Volume 21360 33620 39360
Fuse required per unit 2 2 2
Total Fuse Required 42720 67240 78720
Add: Closing Inventory of Fuse 39360 44280 59040
82080 111520 137760
Less: Opening Inventory of Fuse 49200 39360 44280
Budgeted Purchase Volume (in units) 32880 72160 93480
Fuse Cost per unit $49.00 $49.00 $49.00
Total Cost of Fuse $16,11,120 $35,35,840 $45,80,520
Isolators required per unit 3 3 3 3
Total Isolators Required 64080 100860 118080
Add: Closing Inventory of Isolators 59040 66420 88560
123120 167280 206640
Less: Opening Inventory of Isolators 73800 59040 66420
Budgeted Purchase Volume (in units) 49320 108240 140220
Isolators Cost per unit $66.00 $66.00 $66.00
Total Cost of Isolators $42,29,280 $66,56,760 $77,93,280
Budgeted Direct Material Purchase $58,40,400 $101,92,600 $123,73,800
MANAGEMENT ACCOUNTING
Direct Labour Budget:
Particulars January February March
Budgeted Production Volume 21360 33620 39360
Labor Hours required per unit 5 5 5
Total Direct Labor Hour Required 106800 168100 196800
Direct Labor Cost per Hour $30.00 $30.00 $30.00
Budgeted Direct Labor Cost $32,04,000 $50,43,000 $59,04,000
Quarters
Purchase Budget:
Particulars January February March April
Budgeted Sales Volume 41000 32800 36900 49200
Budgeted Production Volume 21360 33620 39360
Fuse required per unit 2 2 2
Total Fuse Required 42720 67240 78720
Add: Closing Inventory of Fuse 39360 44280 59040
82080 111520 137760
Less: Opening Inventory of Fuse 49200 39360 44280
Budgeted Purchase Volume (in units) 32880 72160 93480
Fuse Cost per unit $49.00 $49.00 $49.00
Total Cost of Fuse $16,11,120 $35,35,840 $45,80,520
Isolators required per unit 3 3 3 3
Total Isolators Required 64080 100860 118080
Add: Closing Inventory of Isolators 59040 66420 88560
123120 167280 206640
Less: Opening Inventory of Isolators 73800 59040 66420
Budgeted Purchase Volume (in units) 49320 108240 140220
Isolators Cost per unit $66.00 $66.00 $66.00
Total Cost of Isolators $42,29,280 $66,56,760 $77,93,280
Budgeted Direct Material Purchase $58,40,400 $101,92,600 $123,73,800
Paraphrase This Document
Need a fresh take? Get an instant paraphrase of this document with our AI Paraphraser
4
MANAGEMENT ACCOUNTING
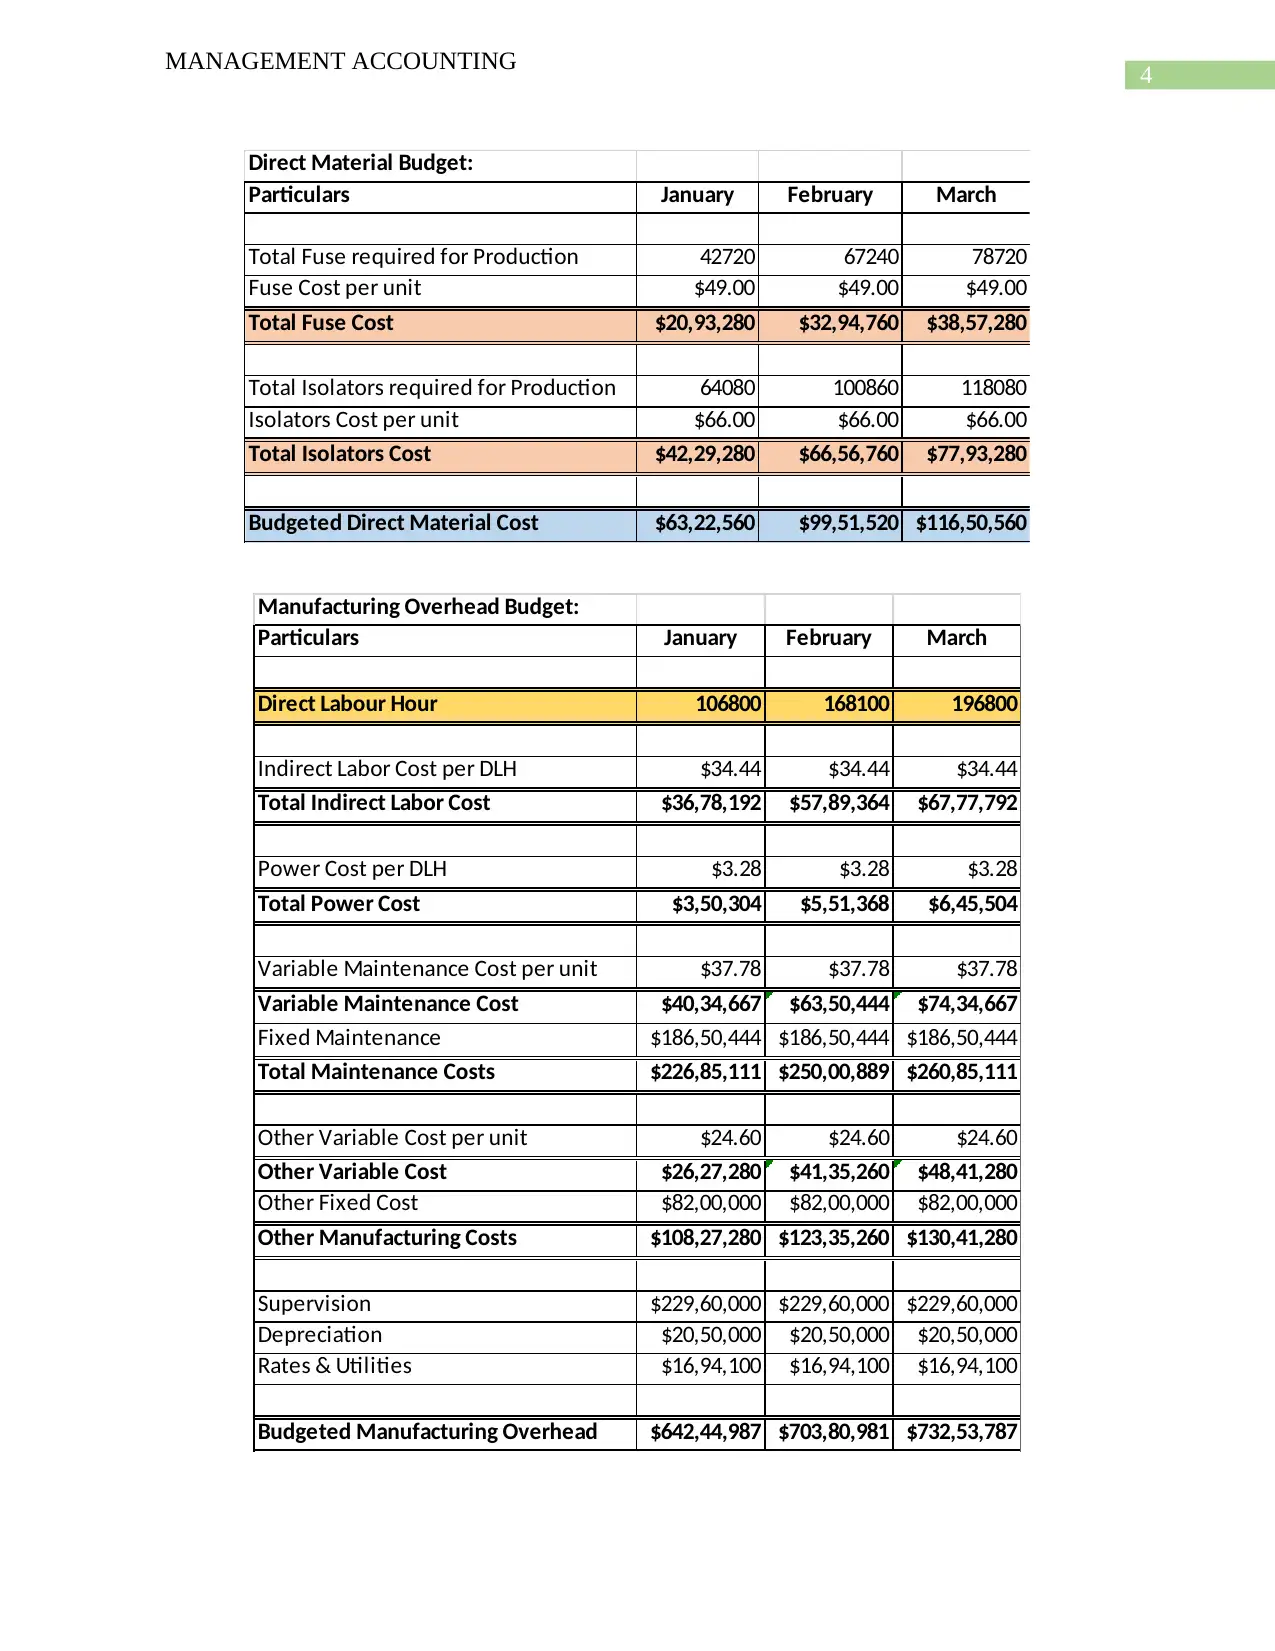
Direct Material Budget:
Particulars January February March
Total Fuse required for Production 42720 67240 78720
Fuse Cost per unit $49.00 $49.00 $49.00
Total Fuse Cost $20,93,280 $32,94,760 $38,57,280
Total Isolators required for Production 64080 100860 118080
Isolators Cost per unit $66.00 $66.00 $66.00
Total Isolators Cost $42,29,280 $66,56,760 $77,93,280
Budgeted Direct Material Cost $63,22,560 $99,51,520 $116,50,560
Manufacturing Overhead Budget:
Particulars January February March
Direct Labour Hour 106800 168100 196800
Indirect Labor Cost per DLH $34.44 $34.44 $34.44
Total Indirect Labor Cost $36,78,192 $57,89,364 $67,77,792
Power Cost per DLH $3.28 $3.28 $3.28
Total Power Cost $3,50,304 $5,51,368 $6,45,504
Variable Maintenance Cost per unit $37.78 $37.78 $37.78
Variable Maintenance Cost $40,34,667 $63,50,444 $74,34,667
Fixed Maintenance $186,50,444 $186,50,444 $186,50,444
Total Maintenance Costs $226,85,111 $250,00,889 $260,85,111
Other Variable Cost per unit $24.60 $24.60 $24.60
Other Variable Cost $26,27,280 $41,35,260 $48,41,280
Other Fixed Cost $82,00,000 $82,00,000 $82,00,000
Other Manufacturing Costs $108,27,280 $123,35,260 $130,41,280
Supervision $229,60,000 $229,60,000 $229,60,000
Depreciation $20,50,000 $20,50,000 $20,50,000
Rates & Utilities $16,94,100 $16,94,100 $16,94,100
Budgeted Manufacturing Overhead $642,44,987 $703,80,981 $732,53,787
MANAGEMENT ACCOUNTING
Direct Material Budget:
Particulars January February March
Total Fuse required for Production 42720 67240 78720
Fuse Cost per unit $49.00 $49.00 $49.00
Total Fuse Cost $20,93,280 $32,94,760 $38,57,280
Total Isolators required for Production 64080 100860 118080
Isolators Cost per unit $66.00 $66.00 $66.00
Total Isolators Cost $42,29,280 $66,56,760 $77,93,280
Budgeted Direct Material Cost $63,22,560 $99,51,520 $116,50,560
Manufacturing Overhead Budget:
Particulars January February March
Direct Labour Hour 106800 168100 196800
Indirect Labor Cost per DLH $34.44 $34.44 $34.44
Total Indirect Labor Cost $36,78,192 $57,89,364 $67,77,792
Power Cost per DLH $3.28 $3.28 $3.28
Total Power Cost $3,50,304 $5,51,368 $6,45,504
Variable Maintenance Cost per unit $37.78 $37.78 $37.78
Variable Maintenance Cost $40,34,667 $63,50,444 $74,34,667
Fixed Maintenance $186,50,444 $186,50,444 $186,50,444
Total Maintenance Costs $226,85,111 $250,00,889 $260,85,111
Other Variable Cost per unit $24.60 $24.60 $24.60
Other Variable Cost $26,27,280 $41,35,260 $48,41,280
Other Fixed Cost $82,00,000 $82,00,000 $82,00,000
Other Manufacturing Costs $108,27,280 $123,35,260 $130,41,280
Supervision $229,60,000 $229,60,000 $229,60,000
Depreciation $20,50,000 $20,50,000 $20,50,000
Rates & Utilities $16,94,100 $16,94,100 $16,94,100
Budgeted Manufacturing Overhead $642,44,987 $703,80,981 $732,53,787
5
MANAGEMENT ACCOUNTING
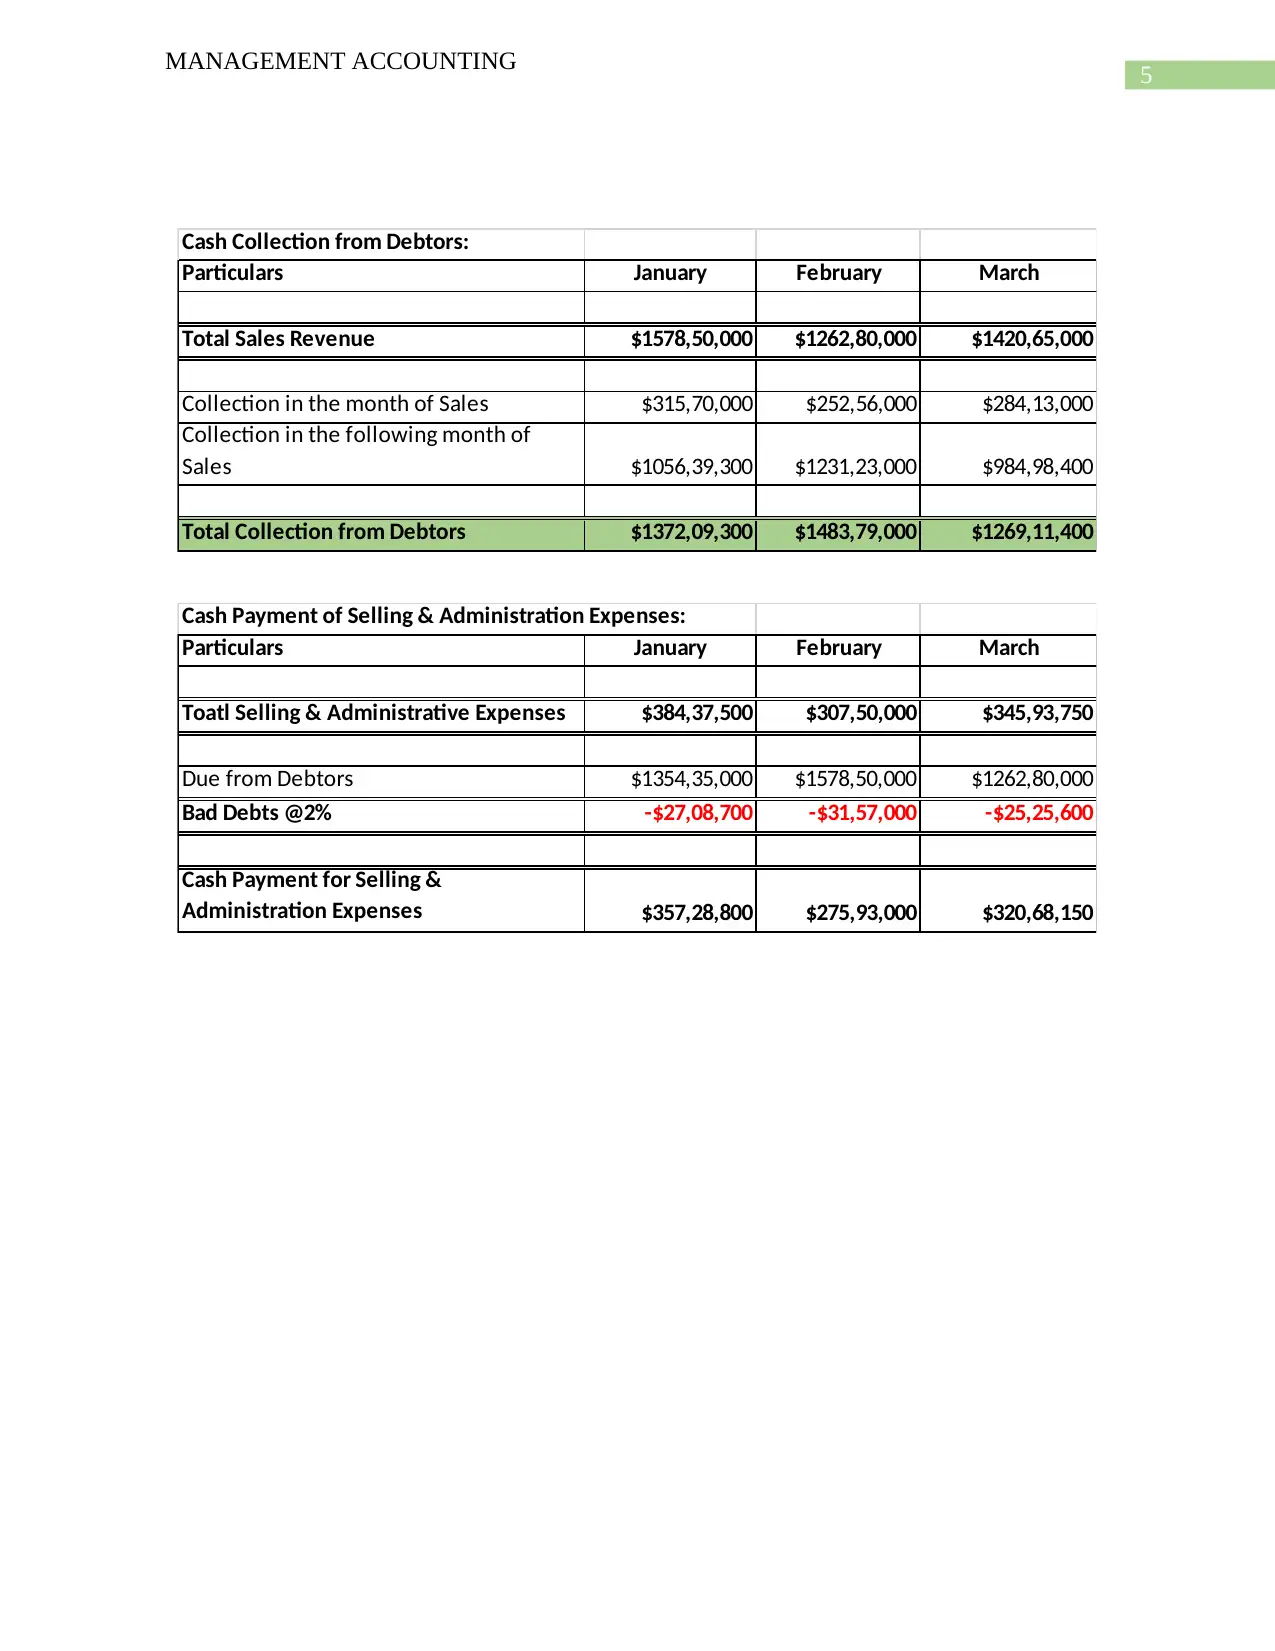
Cash Collection from Debtors:
Particulars January February March
Total Sales Revenue $1578,50,000 $1262,80,000 $1420,65,000
Collection in the month of Sales $315,70,000 $252,56,000 $284,13,000
Collection in the following month of
Sales $1056,39,300 $1231,23,000 $984,98,400
Total Collection from Debtors $1372,09,300 $1483,79,000 $1269,11,400
Cash Payment of Selling & Administration Expenses:
Particulars January February March
Toatl Selling & Administrative Expenses $384,37,500 $307,50,000 $345,93,750
Due from Debtors $1354,35,000 $1578,50,000 $1262,80,000
Bad Debts @2% -$27,08,700 -$31,57,000 -$25,25,600
Cash Payment for Selling &
Administration Expenses $357,28,800 $275,93,000 $320,68,150
MANAGEMENT ACCOUNTING
Cash Collection from Debtors:
Particulars January February March
Total Sales Revenue $1578,50,000 $1262,80,000 $1420,65,000
Collection in the month of Sales $315,70,000 $252,56,000 $284,13,000
Collection in the following month of
Sales $1056,39,300 $1231,23,000 $984,98,400
Total Collection from Debtors $1372,09,300 $1483,79,000 $1269,11,400
Cash Payment of Selling & Administration Expenses:
Particulars January February March
Toatl Selling & Administrative Expenses $384,37,500 $307,50,000 $345,93,750
Due from Debtors $1354,35,000 $1578,50,000 $1262,80,000
Bad Debts @2% -$27,08,700 -$31,57,000 -$25,25,600
Cash Payment for Selling &
Administration Expenses $357,28,800 $275,93,000 $320,68,150
⊘ This is a preview!⊘
Do you want full access?
Subscribe today to unlock all pages.
Trusted by 1+ million students worldwide
6
MANAGEMENT ACCOUNTING
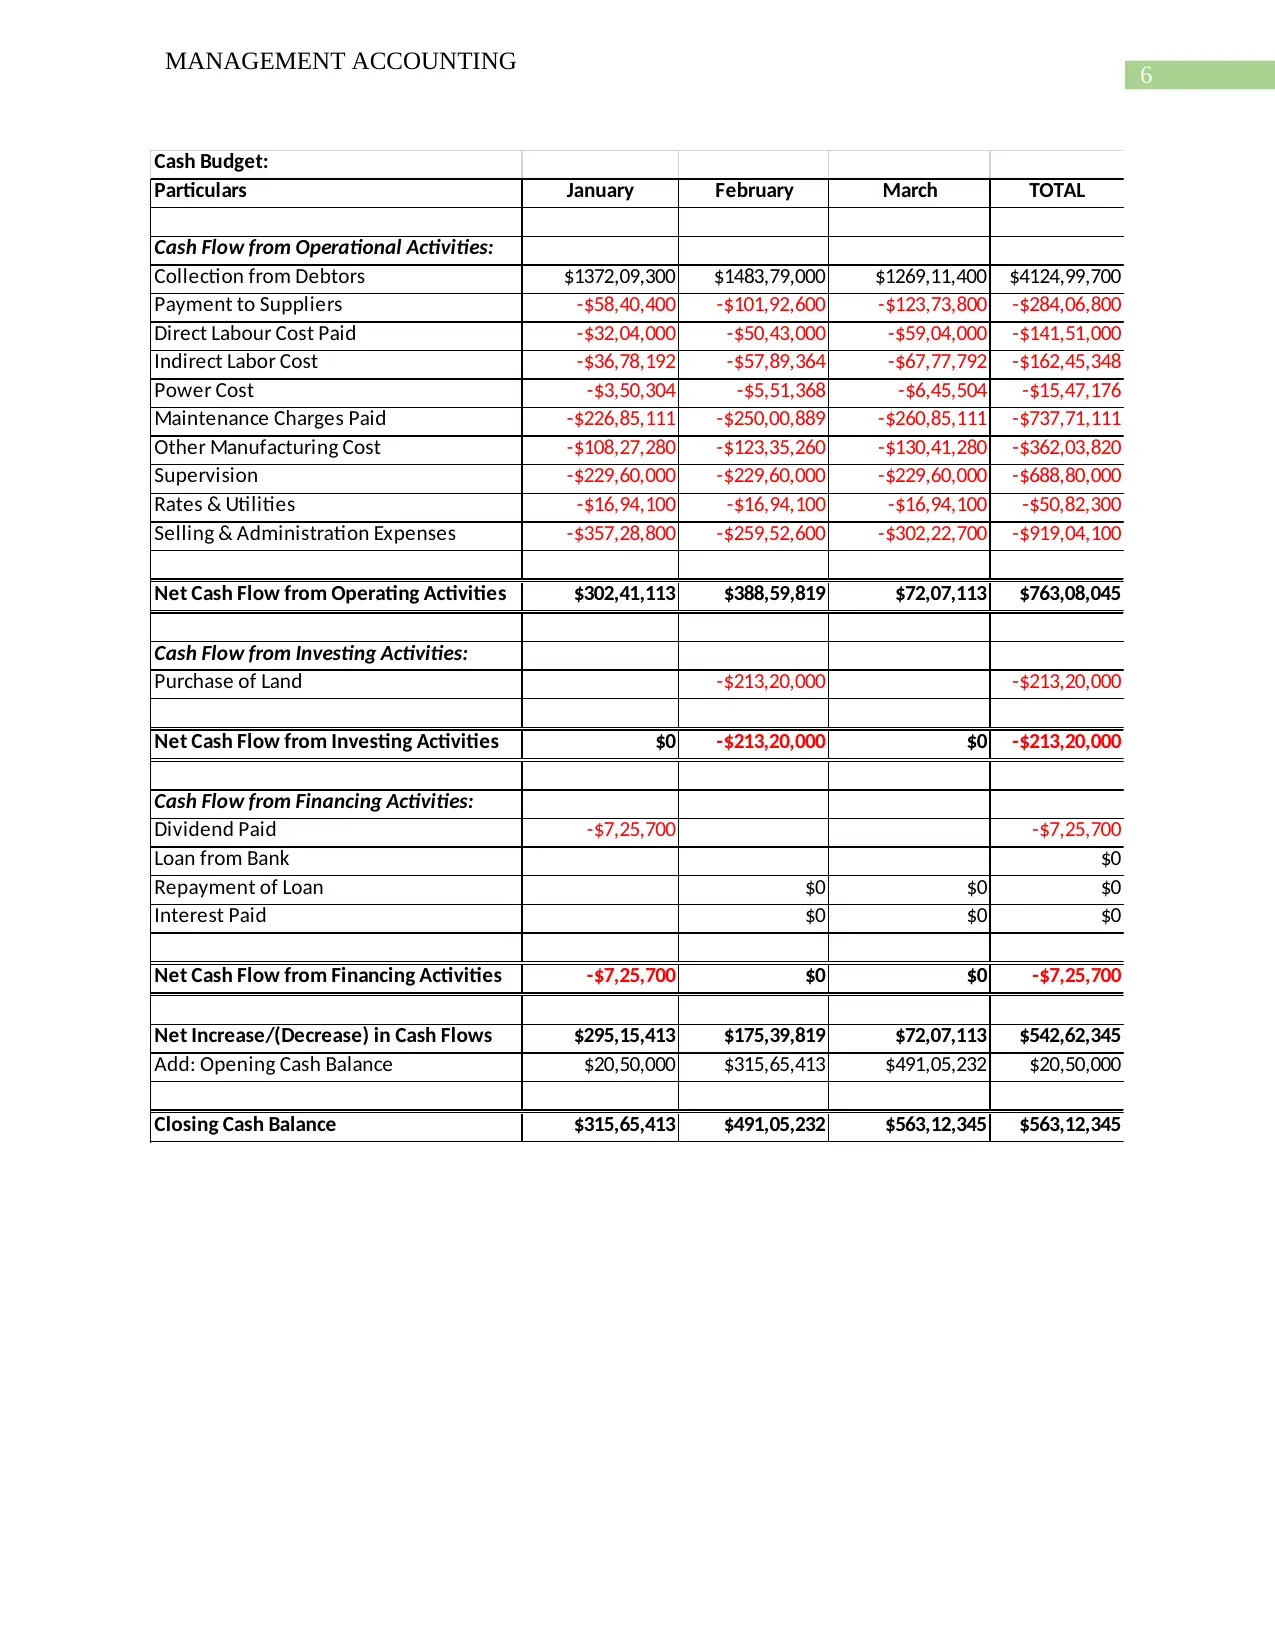
Cash Budget:
Particulars January February March TOTAL
Cash Flow from Operational Activities:
Collection from Debtors $1372,09,300 $1483,79,000 $1269,11,400 $4124,99,700
Payment to Suppliers -$58,40,400 -$101,92,600 -$123,73,800 -$284,06,800
Direct Labour Cost Paid -$32,04,000 -$50,43,000 -$59,04,000 -$141,51,000
Indirect Labor Cost -$36,78,192 -$57,89,364 -$67,77,792 -$162,45,348
Power Cost -$3,50,304 -$5,51,368 -$6,45,504 -$15,47,176
Maintenance Charges Paid -$226,85,111 -$250,00,889 -$260,85,111 -$737,71,111
Other Manufacturing Cost -$108,27,280 -$123,35,260 -$130,41,280 -$362,03,820
Supervision -$229,60,000 -$229,60,000 -$229,60,000 -$688,80,000
Rates & Utilities -$16,94,100 -$16,94,100 -$16,94,100 -$50,82,300
Selling & Administration Expenses -$357,28,800 -$259,52,600 -$302,22,700 -$919,04,100
Net Cash Flow from Operating Activities $302,41,113 $388,59,819 $72,07,113 $763,08,045
Cash Flow from Investing Activities:
Purchase of Land -$213,20,000 -$213,20,000
Net Cash Flow from Investing Activities $0 -$213,20,000 $0 -$213,20,000
Cash Flow from Financing Activities:
Dividend Paid -$7,25,700 -$7,25,700
Loan from Bank $0
Repayment of Loan $0 $0 $0
Interest Paid $0 $0 $0
Net Cash Flow from Financing Activities -$7,25,700 $0 $0 -$7,25,700
Net Increase/(Decrease) in Cash Flows $295,15,413 $175,39,819 $72,07,113 $542,62,345
Add: Opening Cash Balance $20,50,000 $315,65,413 $491,05,232 $20,50,000
Closing Cash Balance $315,65,413 $491,05,232 $563,12,345 $563,12,345
MANAGEMENT ACCOUNTING
Cash Budget:
Particulars January February March TOTAL
Cash Flow from Operational Activities:
Collection from Debtors $1372,09,300 $1483,79,000 $1269,11,400 $4124,99,700
Payment to Suppliers -$58,40,400 -$101,92,600 -$123,73,800 -$284,06,800
Direct Labour Cost Paid -$32,04,000 -$50,43,000 -$59,04,000 -$141,51,000
Indirect Labor Cost -$36,78,192 -$57,89,364 -$67,77,792 -$162,45,348
Power Cost -$3,50,304 -$5,51,368 -$6,45,504 -$15,47,176
Maintenance Charges Paid -$226,85,111 -$250,00,889 -$260,85,111 -$737,71,111
Other Manufacturing Cost -$108,27,280 -$123,35,260 -$130,41,280 -$362,03,820
Supervision -$229,60,000 -$229,60,000 -$229,60,000 -$688,80,000
Rates & Utilities -$16,94,100 -$16,94,100 -$16,94,100 -$50,82,300
Selling & Administration Expenses -$357,28,800 -$259,52,600 -$302,22,700 -$919,04,100
Net Cash Flow from Operating Activities $302,41,113 $388,59,819 $72,07,113 $763,08,045
Cash Flow from Investing Activities:
Purchase of Land -$213,20,000 -$213,20,000
Net Cash Flow from Investing Activities $0 -$213,20,000 $0 -$213,20,000
Cash Flow from Financing Activities:
Dividend Paid -$7,25,700 -$7,25,700
Loan from Bank $0
Repayment of Loan $0 $0 $0
Interest Paid $0 $0 $0
Net Cash Flow from Financing Activities -$7,25,700 $0 $0 -$7,25,700
Net Increase/(Decrease) in Cash Flows $295,15,413 $175,39,819 $72,07,113 $542,62,345
Add: Opening Cash Balance $20,50,000 $315,65,413 $491,05,232 $20,50,000
Closing Cash Balance $315,65,413 $491,05,232 $563,12,345 $563,12,345
Paraphrase This Document
Need a fresh take? Get an instant paraphrase of this document with our AI Paraphraser
7
MANAGEMENT ACCOUNTING
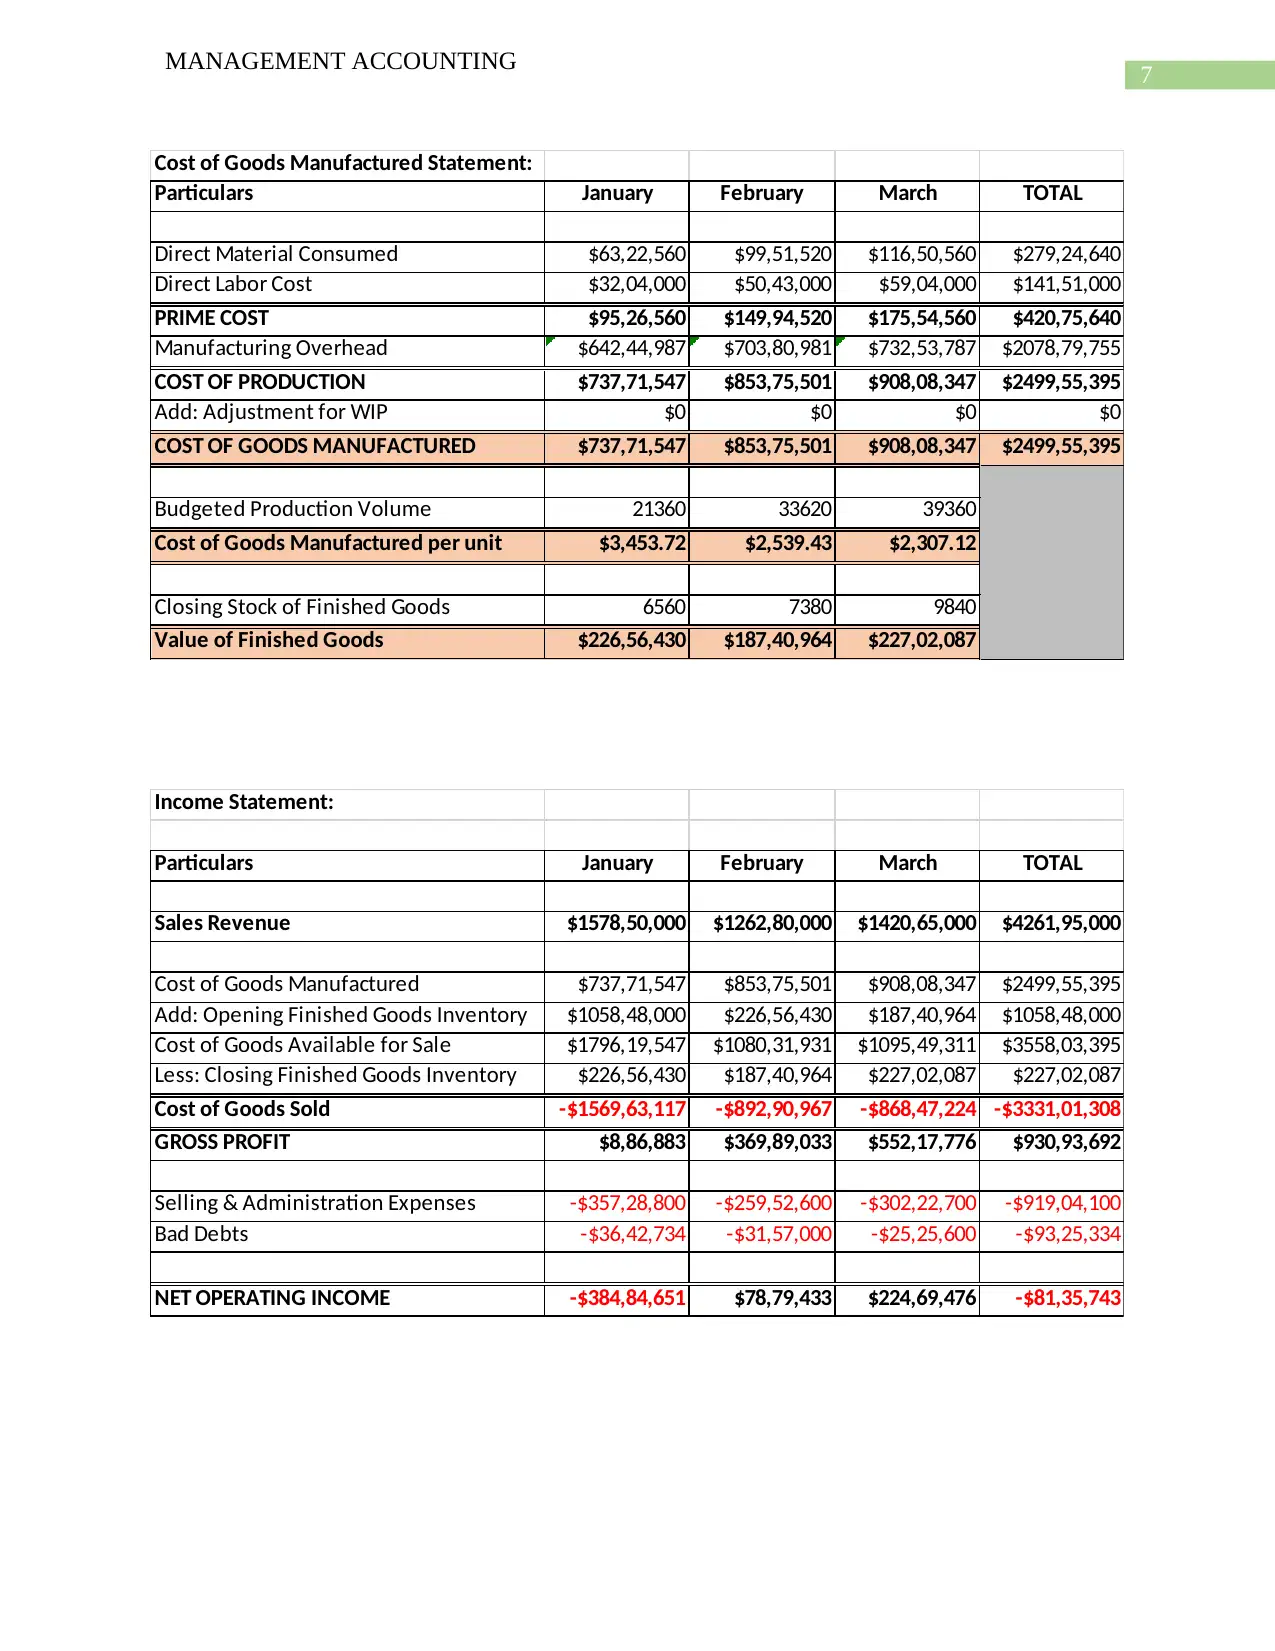
Cost of Goods Manufactured Statement:
Particulars January February March TOTAL
Direct Material Consumed $63,22,560 $99,51,520 $116,50,560 $279,24,640
Direct Labor Cost $32,04,000 $50,43,000 $59,04,000 $141,51,000
PRIME COST $95,26,560 $149,94,520 $175,54,560 $420,75,640
Manufacturing Overhead $642,44,987 $703,80,981 $732,53,787 $2078,79,755
COST OF PRODUCTION $737,71,547 $853,75,501 $908,08,347 $2499,55,395
Add: Adjustment for WIP $0 $0 $0 $0
COST OF GOODS MANUFACTURED $737,71,547 $853,75,501 $908,08,347 $2499,55,395
Budgeted Production Volume 21360 33620 39360
Cost of Goods Manufactured per unit $3,453.72 $2,539.43 $2,307.12
Closing Stock of Finished Goods 6560 7380 9840
Value of Finished Goods $226,56,430 $187,40,964 $227,02,087
Income Statement:
Particulars January February March TOTAL
Sales Revenue $1578,50,000 $1262,80,000 $1420,65,000 $4261,95,000
Cost of Goods Manufactured $737,71,547 $853,75,501 $908,08,347 $2499,55,395
Add: Opening Finished Goods Inventory $1058,48,000 $226,56,430 $187,40,964 $1058,48,000
Cost of Goods Available for Sale $1796,19,547 $1080,31,931 $1095,49,311 $3558,03,395
Less: Closing Finished Goods Inventory $226,56,430 $187,40,964 $227,02,087 $227,02,087
Cost of Goods Sold -$1569,63,117 -$892,90,967 -$868,47,224 -$3331,01,308
GROSS PROFIT $8,86,883 $369,89,033 $552,17,776 $930,93,692
Selling & Administration Expenses -$357,28,800 -$259,52,600 -$302,22,700 -$919,04,100
Bad Debts -$36,42,734 -$31,57,000 -$25,25,600 -$93,25,334
NET OPERATING INCOME -$384,84,651 $78,79,433 $224,69,476 -$81,35,743
MANAGEMENT ACCOUNTING
Cost of Goods Manufactured Statement:
Particulars January February March TOTAL
Direct Material Consumed $63,22,560 $99,51,520 $116,50,560 $279,24,640
Direct Labor Cost $32,04,000 $50,43,000 $59,04,000 $141,51,000
PRIME COST $95,26,560 $149,94,520 $175,54,560 $420,75,640
Manufacturing Overhead $642,44,987 $703,80,981 $732,53,787 $2078,79,755
COST OF PRODUCTION $737,71,547 $853,75,501 $908,08,347 $2499,55,395
Add: Adjustment for WIP $0 $0 $0 $0
COST OF GOODS MANUFACTURED $737,71,547 $853,75,501 $908,08,347 $2499,55,395
Budgeted Production Volume 21360 33620 39360
Cost of Goods Manufactured per unit $3,453.72 $2,539.43 $2,307.12
Closing Stock of Finished Goods 6560 7380 9840
Value of Finished Goods $226,56,430 $187,40,964 $227,02,087
Income Statement:
Particulars January February March TOTAL
Sales Revenue $1578,50,000 $1262,80,000 $1420,65,000 $4261,95,000
Cost of Goods Manufactured $737,71,547 $853,75,501 $908,08,347 $2499,55,395
Add: Opening Finished Goods Inventory $1058,48,000 $226,56,430 $187,40,964 $1058,48,000
Cost of Goods Available for Sale $1796,19,547 $1080,31,931 $1095,49,311 $3558,03,395
Less: Closing Finished Goods Inventory $226,56,430 $187,40,964 $227,02,087 $227,02,087
Cost of Goods Sold -$1569,63,117 -$892,90,967 -$868,47,224 -$3331,01,308
GROSS PROFIT $8,86,883 $369,89,033 $552,17,776 $930,93,692
Selling & Administration Expenses -$357,28,800 -$259,52,600 -$302,22,700 -$919,04,100
Bad Debts -$36,42,734 -$31,57,000 -$25,25,600 -$93,25,334
NET OPERATING INCOME -$384,84,651 $78,79,433 $224,69,476 -$81,35,743
8
MANAGEMENT ACCOUNTING
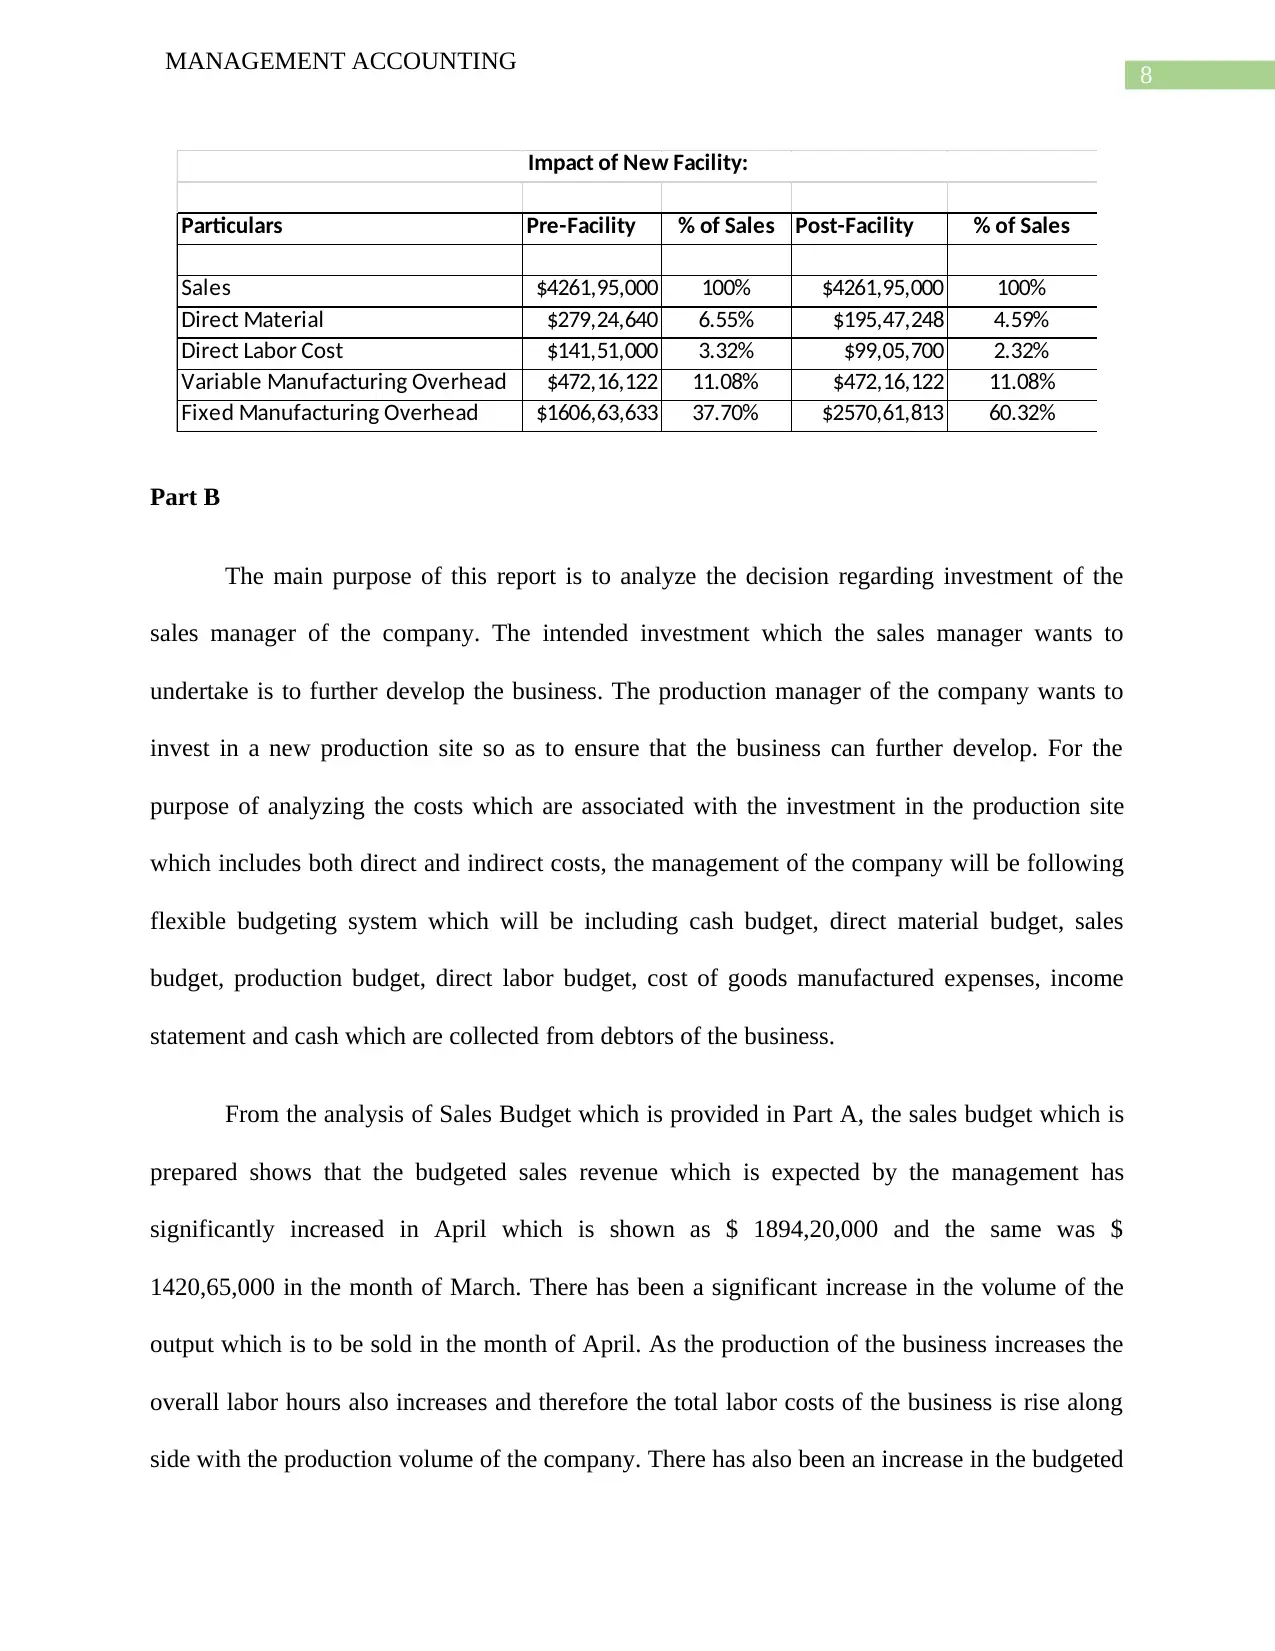
Particulars Pre-Facility % of Sales Post-Facility % of Sales
Sales $4261,95,000 100% $4261,95,000 100%
Direct Material $279,24,640 6.55% $195,47,248 4.59%
Direct Labor Cost $141,51,000 3.32% $99,05,700 2.32%
Variable Manufacturing Overhead $472,16,122 11.08% $472,16,122 11.08%
Fixed Manufacturing Overhead $1606,63,633 37.70% $2570,61,813 60.32%
Impact of New Facility:
Part B
The main purpose of this report is to analyze the decision regarding investment of the
sales manager of the company. The intended investment which the sales manager wants to
undertake is to further develop the business. The production manager of the company wants to
invest in a new production site so as to ensure that the business can further develop. For the
purpose of analyzing the costs which are associated with the investment in the production site
which includes both direct and indirect costs, the management of the company will be following
flexible budgeting system which will be including cash budget, direct material budget, sales
budget, production budget, direct labor budget, cost of goods manufactured expenses, income
statement and cash which are collected from debtors of the business.
From the analysis of Sales Budget which is provided in Part A, the sales budget which is
prepared shows that the budgeted sales revenue which is expected by the management has
significantly increased in April which is shown as $ 1894,20,000 and the same was $
1420,65,000 in the month of March. There has been a significant increase in the volume of the
output which is to be sold in the month of April. As the production of the business increases the
overall labor hours also increases and therefore the total labor costs of the business is rise along
side with the production volume of the company. There has also been an increase in the budgeted
MANAGEMENT ACCOUNTING
Particulars Pre-Facility % of Sales Post-Facility % of Sales
Sales $4261,95,000 100% $4261,95,000 100%
Direct Material $279,24,640 6.55% $195,47,248 4.59%
Direct Labor Cost $141,51,000 3.32% $99,05,700 2.32%
Variable Manufacturing Overhead $472,16,122 11.08% $472,16,122 11.08%
Fixed Manufacturing Overhead $1606,63,633 37.70% $2570,61,813 60.32%
Impact of New Facility:
Part B
The main purpose of this report is to analyze the decision regarding investment of the
sales manager of the company. The intended investment which the sales manager wants to
undertake is to further develop the business. The production manager of the company wants to
invest in a new production site so as to ensure that the business can further develop. For the
purpose of analyzing the costs which are associated with the investment in the production site
which includes both direct and indirect costs, the management of the company will be following
flexible budgeting system which will be including cash budget, direct material budget, sales
budget, production budget, direct labor budget, cost of goods manufactured expenses, income
statement and cash which are collected from debtors of the business.
From the analysis of Sales Budget which is provided in Part A, the sales budget which is
prepared shows that the budgeted sales revenue which is expected by the management has
significantly increased in April which is shown as $ 1894,20,000 and the same was $
1420,65,000 in the month of March. There has been a significant increase in the volume of the
output which is to be sold in the month of April. As the production of the business increases the
overall labor hours also increases and therefore the total labor costs of the business is rise along
side with the production volume of the company. There has also been an increase in the budgeted
⊘ This is a preview!⊘
Do you want full access?
Subscribe today to unlock all pages.
Trusted by 1+ million students worldwide
9
MANAGEMENT ACCOUNTING
sales volume and budgeted production volume. The direct material budget shows that the total
fuse production has increased over the months and the consumption of direct material for the
month of March is Maximum. The manufacturing expenses which are predicted by the business
have also increased from January which was $ 642,44,987 and it is shown as $ 732,53,787 in the
month of march. The increase in the labor hours which are indirect in nature have contributed to
the increasing manufacturing overhead. It is estimated by the management that the management
will be selling its products in credit as well for which a suitable debtors collection policy is to be
adopted. However, it is estimated collection from debtors will take place a part in the\ month of
January and another part in the month of February. The cash budget which is prepared by the
management shows that the cash generated from operations has reduced in the month of March
which is shown as $ 72,07,113. The closing cash balance shows that the cash balance has
increased from $ 491,05,232 in February to $ 563,12,345 in the month of March. The income
statement which is prepared by the management in respect for month of January shows a
significant amount of loss and the aggregate results for the month of January, February and
March shows a loss figure of $ 81,35,743.
Even though some of the expenses are reduced, however the income statement shows that
the combined results for the first three months will bring about a loss on an aggregate. Therefore,
the business should not invest in the plan as it is not profitable.
Part C
Participative Budgets are prepared considering the people who are impacted or likely to
be impacted with the budget are involved in the preparation of the budget (Heinle, Ross and
Saouma 2013). The general benefits which a participatory budget has is reflected in the overall
Paraphrase This Document
Need a fresh take? Get an instant paraphrase of this document with our AI Paraphraser
10
MANAGEMENT ACCOUNTING
performance of the budget preparers. The implications which a participatory budget has on the
behavior is measured in terms of communication, goal congruence and motivation level of the
employees. The involvement of employees and collective collaboration in the preparation of the
budget is one of the major advantages of participatory budget (Derfuss 2016). Such type of
budgeting approach focuses on undesirable behavior prevention and encouraging congruence of
goals.
Imposed Budgeting Approach refers to the budgeting system which is imposed by the
senior management of the company and various performance standards and targets are
incorporated in such a budget. The basic calculations which are required in a budget are done by
the middle level and lower level management (Chohan and Jacobs 2017). The lower level
management and middle level management does not have any inputs in the budget preparation
process which is set by the top-level management.
From the above discussion it is clear that participative budgets are more effective in
addressing behavioral implications whereas imposed budgets is not much effective in this aspect
as there is not much two way communication between the top level management and even
between departments. Preparation of budget by involving staffs from lower to upper
management will help the management to produce an overall positive result.
11
MANAGEMENT ACCOUNTING
Assignment Code: ACT 204
Answer to Question 1
Requirement A
As per para 6 of AASB 136 “Impairment of Assets”, a cash generating unit may be
defined as the smallest group of assets which are identifiable which are capable of generating
cash and are independent from other groups of assets (Bond, Govendir and Wells 2016).
Requirement B
The impairment test for any asset requires comparison of the recoverable amount of asset
with higher of assets value in use and fair value from which the cost of disposals is excluded.
Value in use requires an accurate estimate of the future cash flows which can be derived
from the asset, expectations of the timings of the cash inflows and the price for bearing the
uncertainty inherent in the use of asset. It is to be considered that the cash flows are based on the
financial forecasts and budgets. The reason for conducting impairment tests on the basis of cash
generating units is because some assets are not able to generate cash flows independently unless
they are combined in a group (Baboukardos and Rimmel 2014). For example, in a dairy farm, a
milking machine and a machine which can separate milk from cream cannot generate cash flows
of their own unless they are used together for the production of some dairy product. The value in
use of such machinery us much greater than independent value that is if they are sold off
independently.
Requirement C
⊘ This is a preview!⊘
Do you want full access?
Subscribe today to unlock all pages.
Trusted by 1+ million students worldwide
1 out of 24
Related Documents


Your All-in-One AI-Powered Toolkit for Academic Success.
+13062052269
info@desklib.com
Available 24*7 on WhatsApp / Email
![[object Object]](/_next/static/media/star-bottom.7253800d.svg)
Unlock your academic potential
Copyright © 2020–2026 A2Z Services. All Rights Reserved. Developed and managed by ZUCOL.