Financial Management Coursework Report: Bond and Stock Valuation

Verified

Added on  2019/12/03

|20
|4022
|111
Report
AI Summary
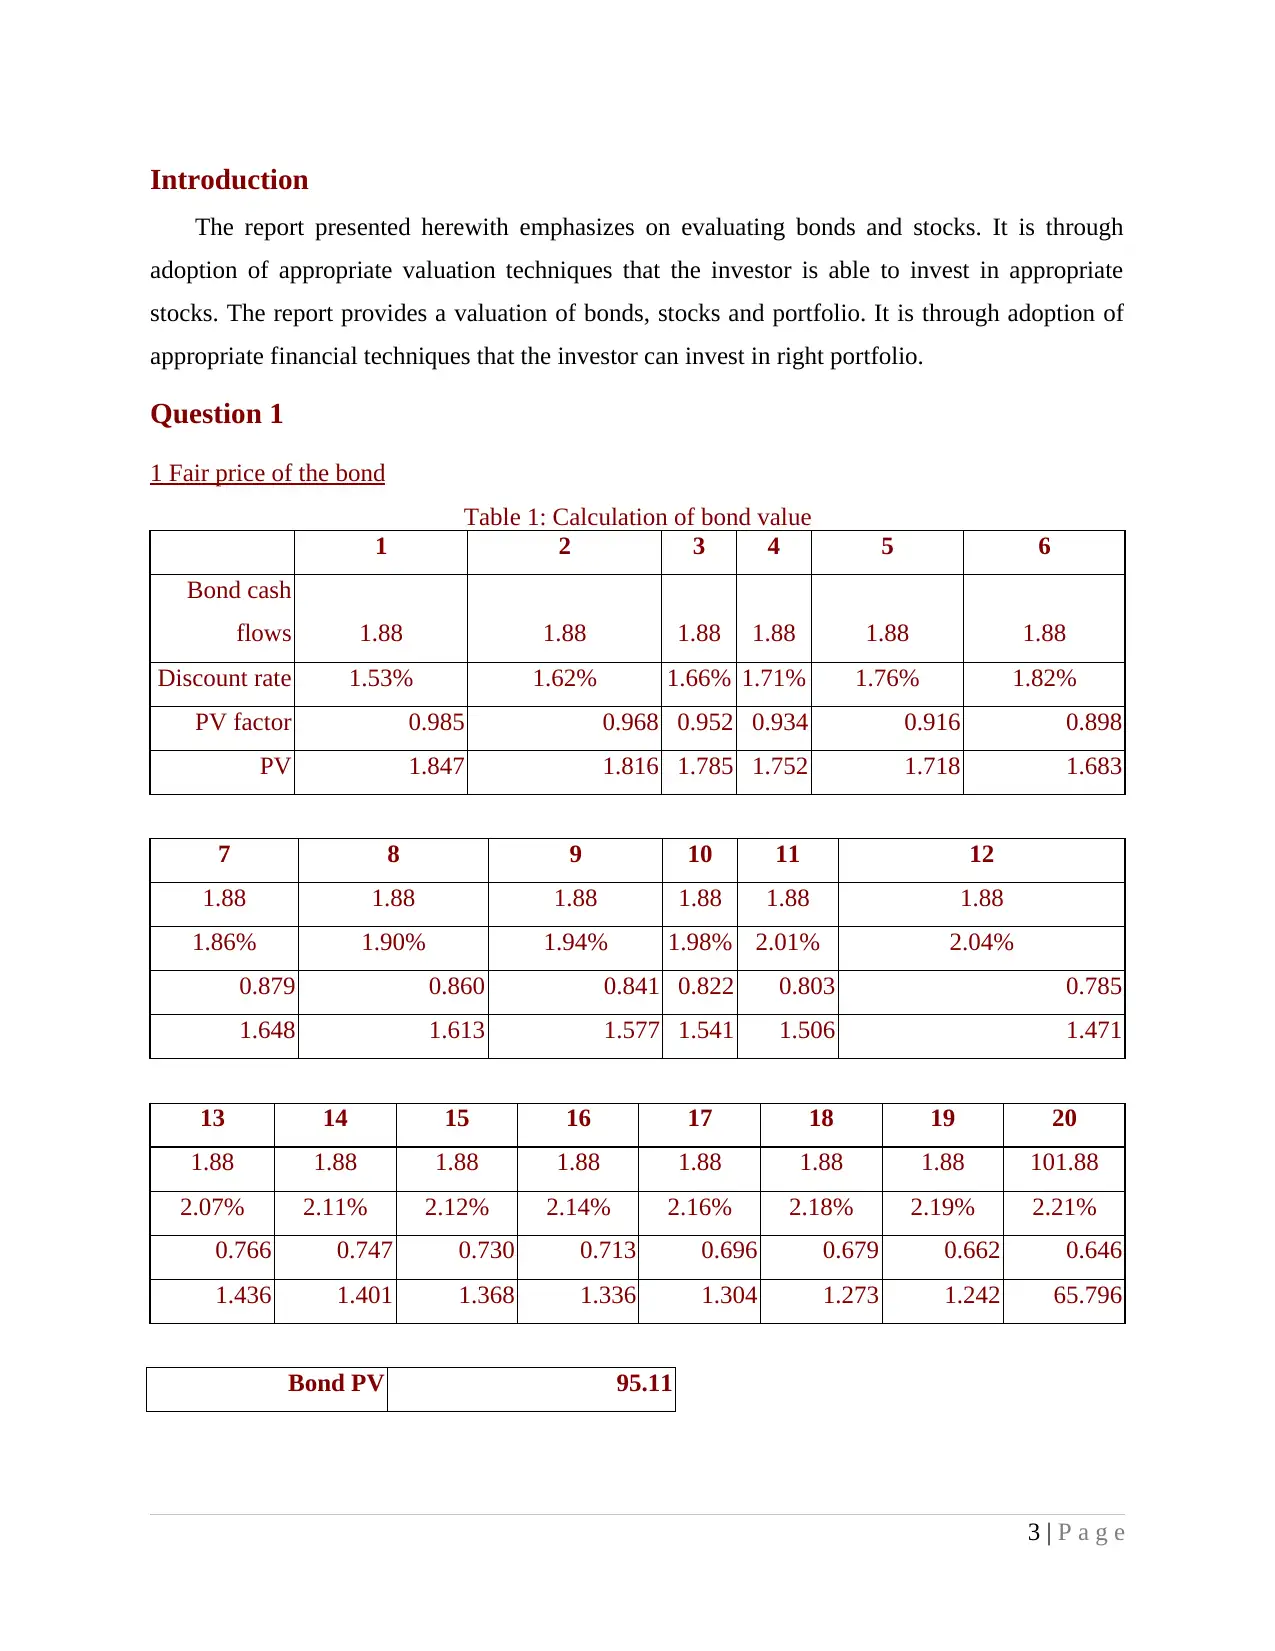
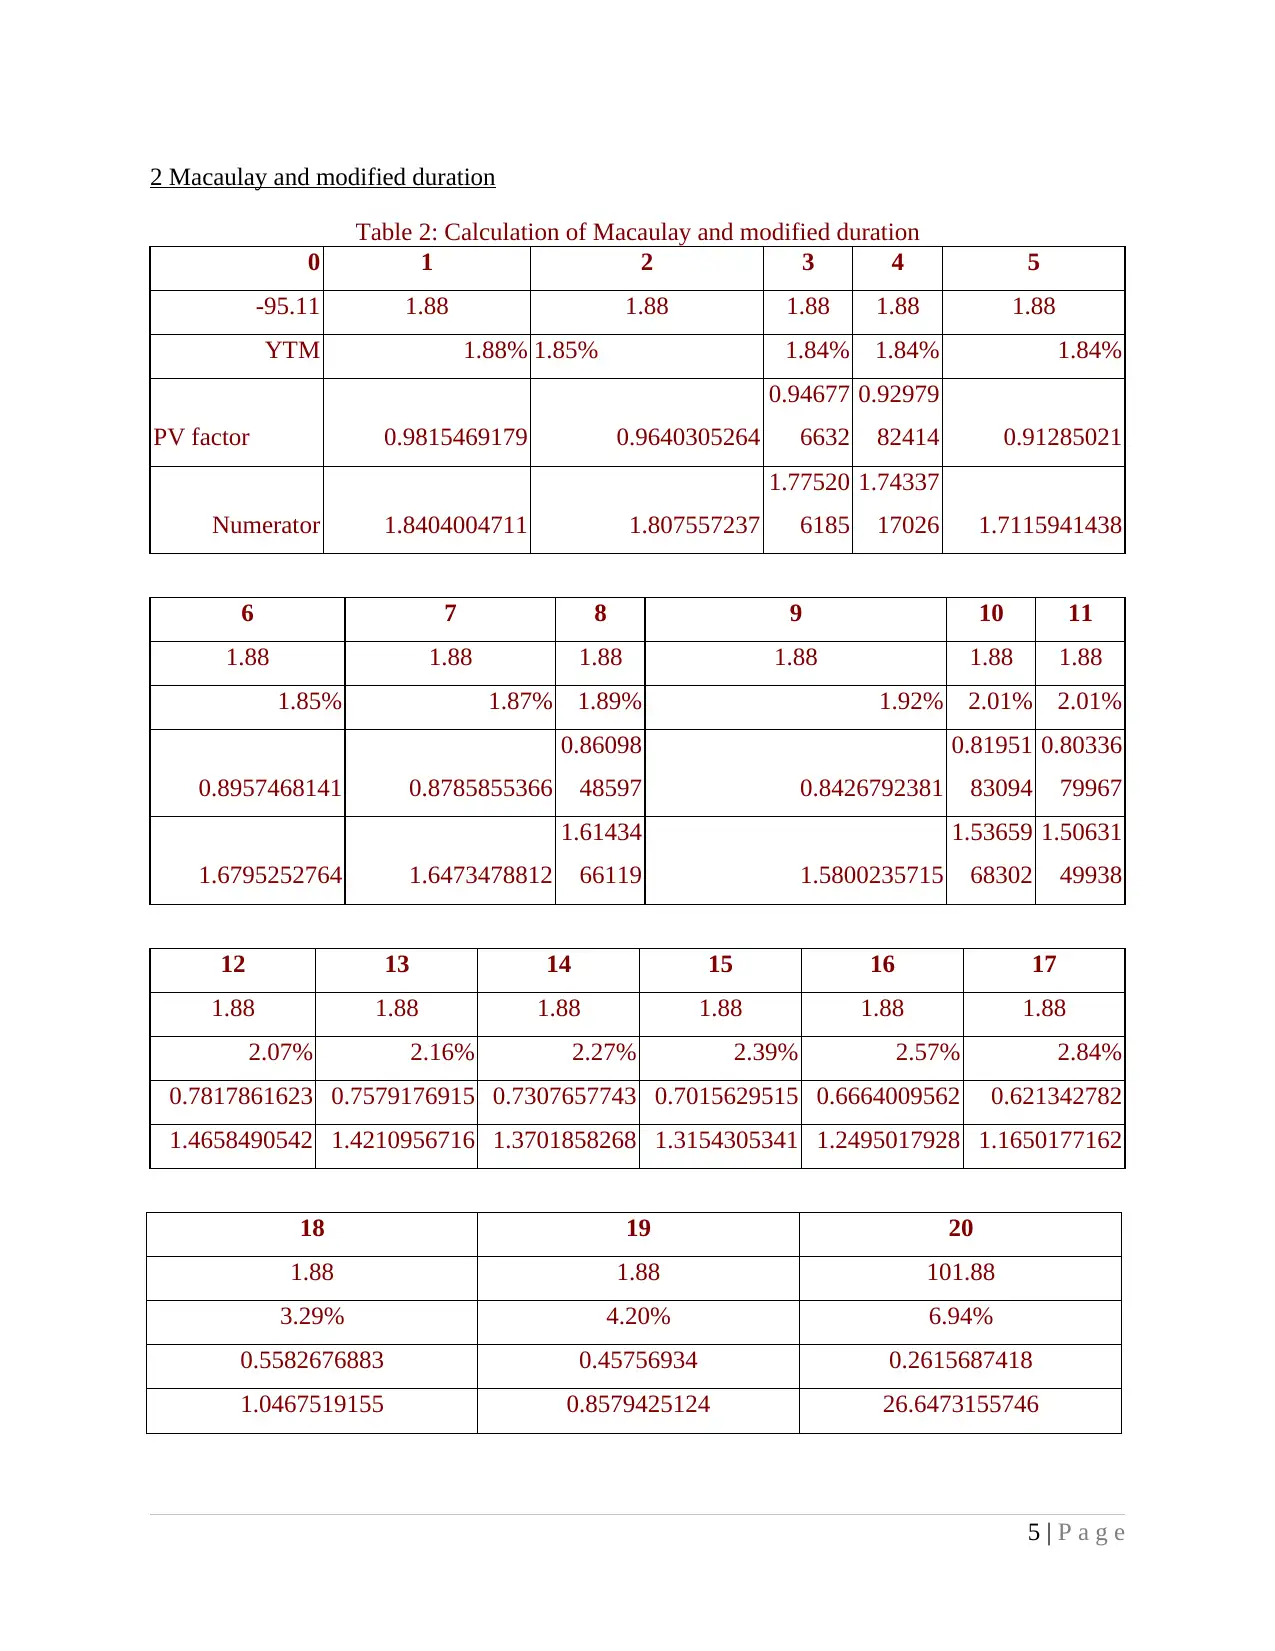
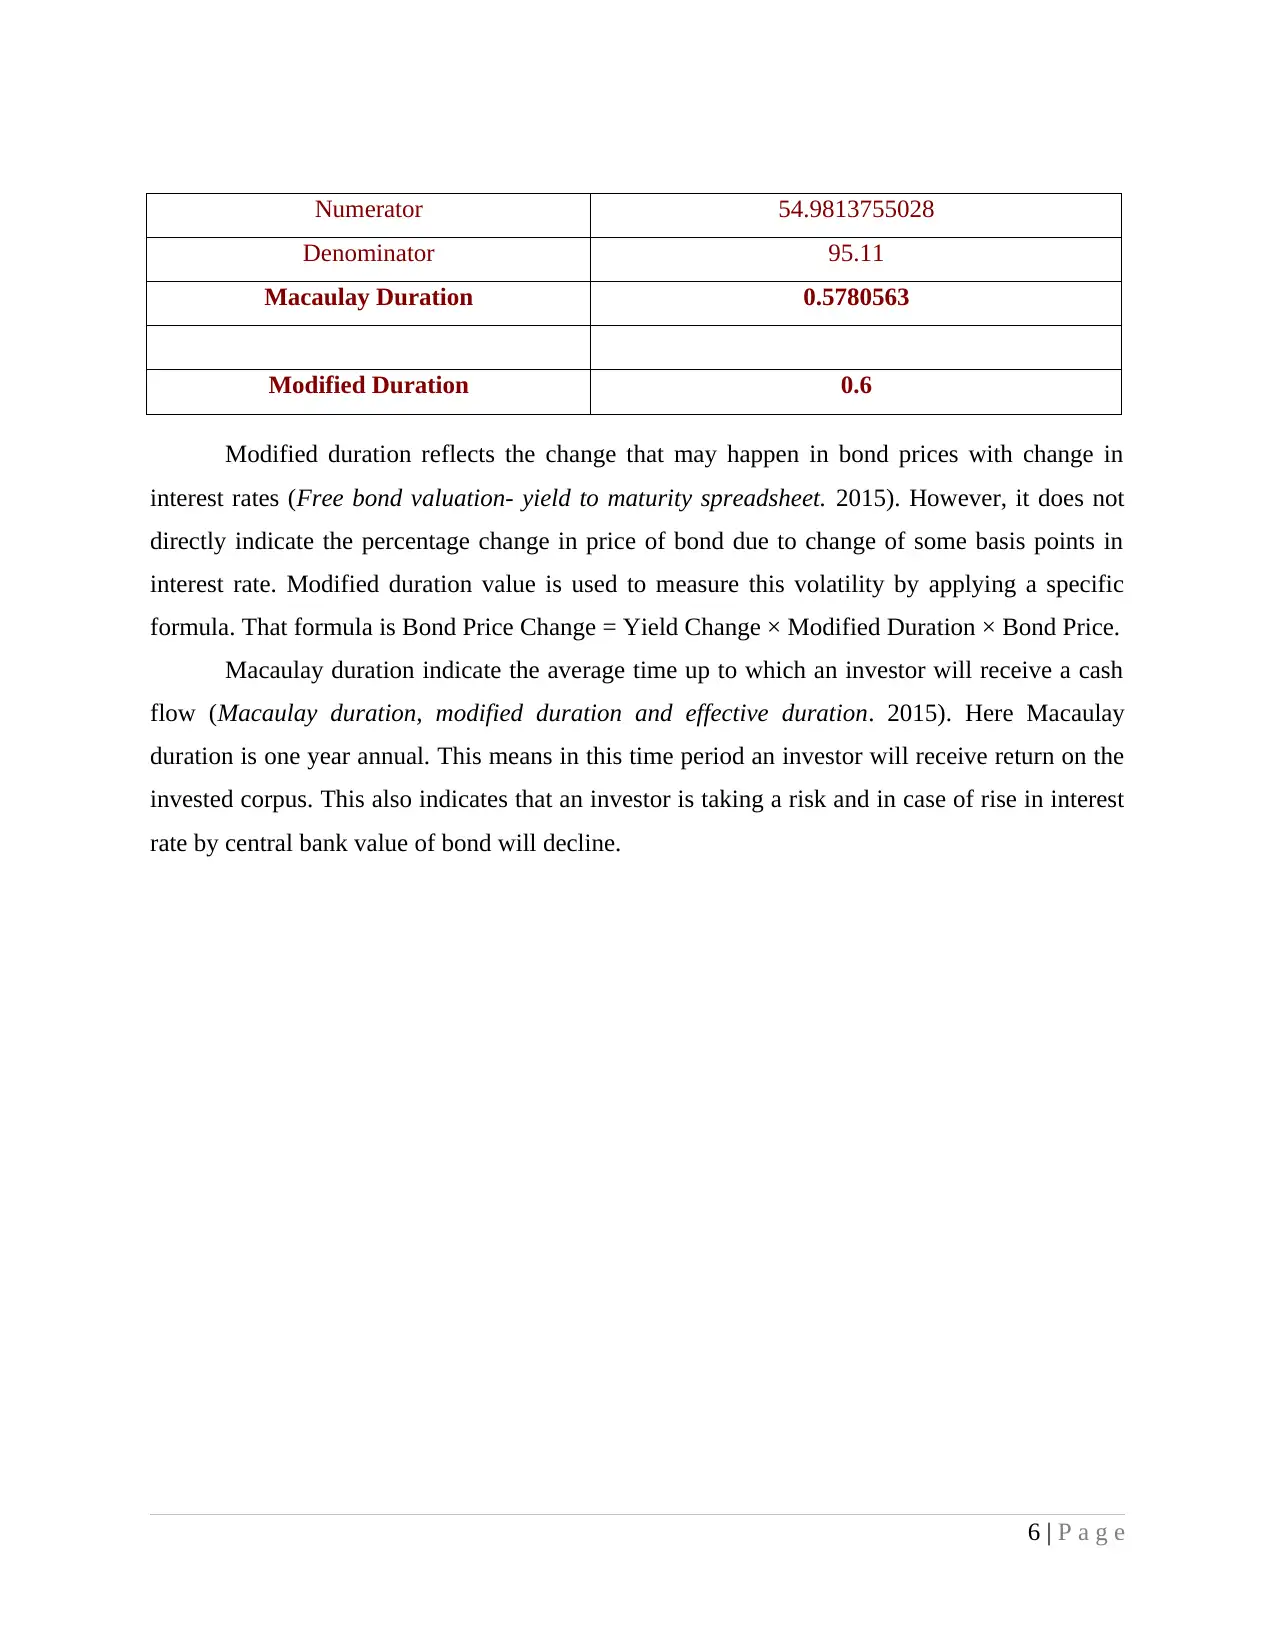
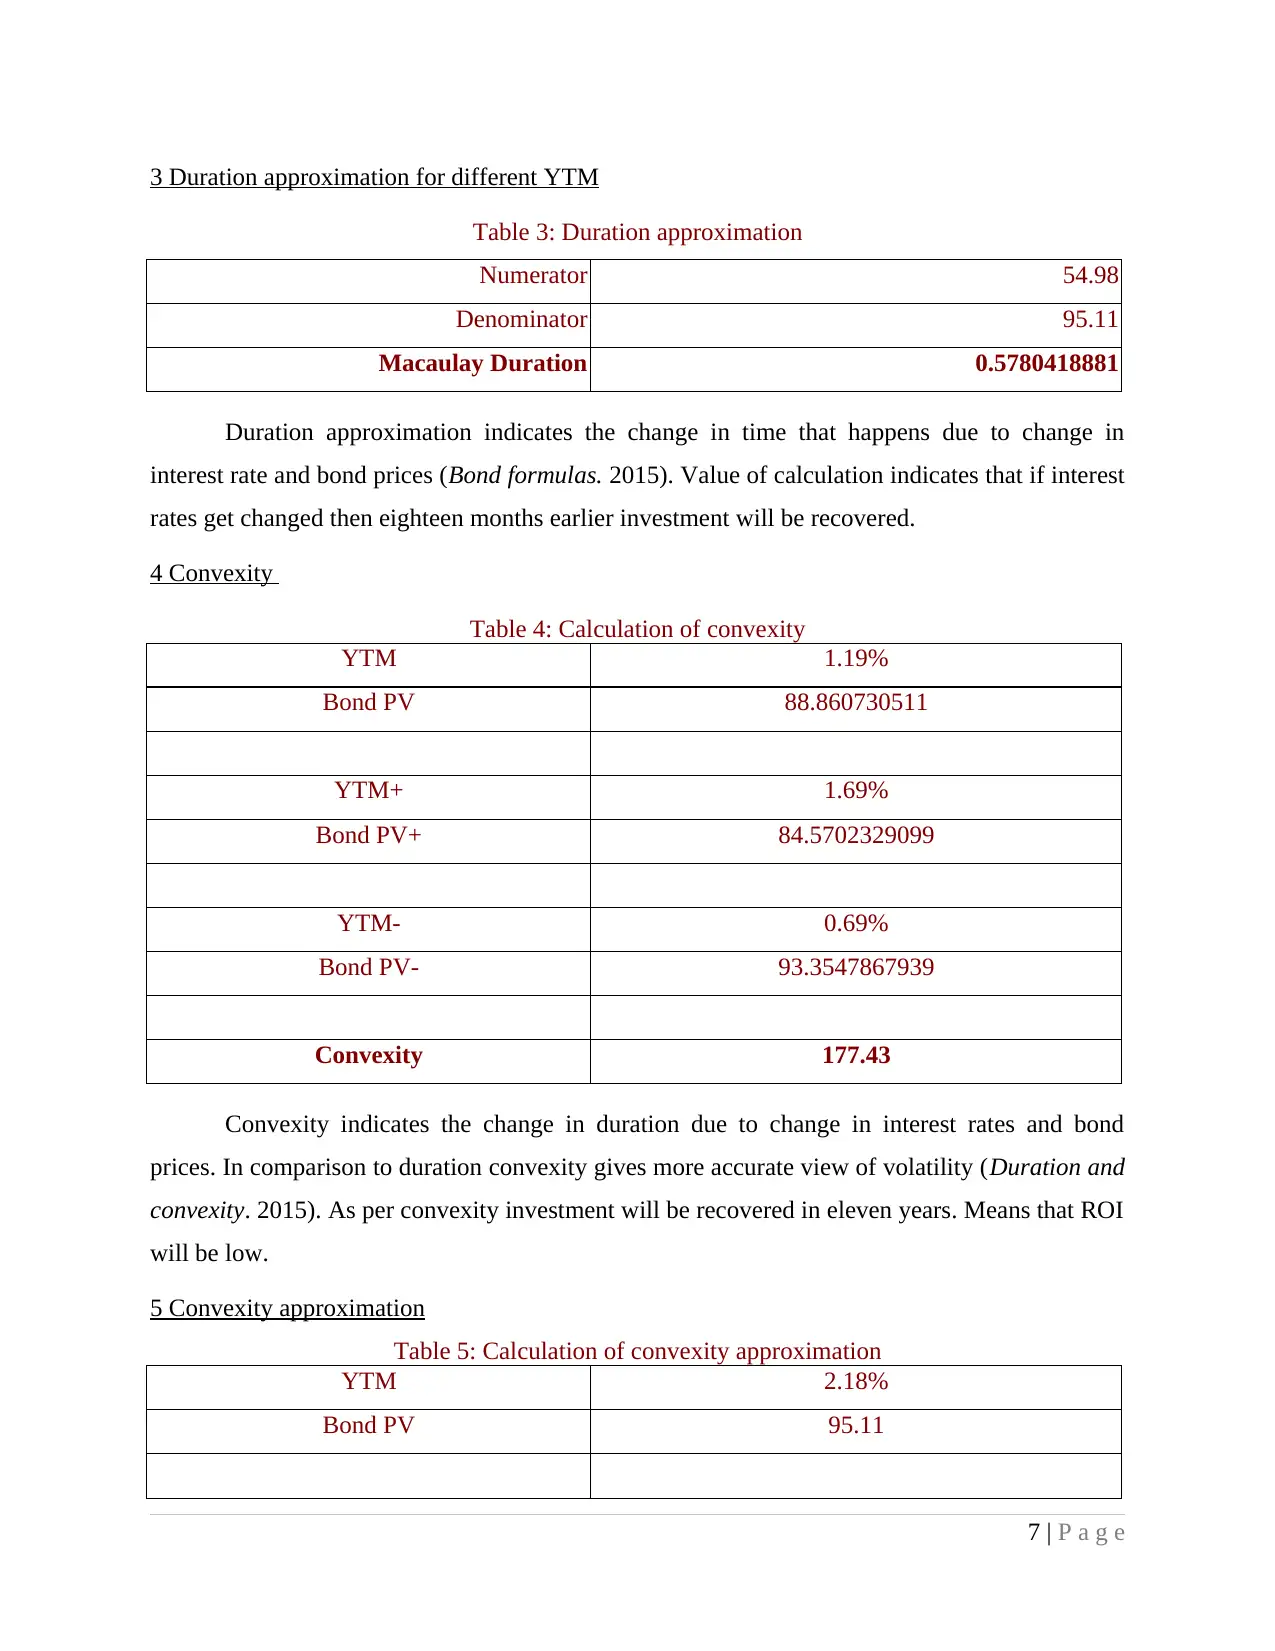
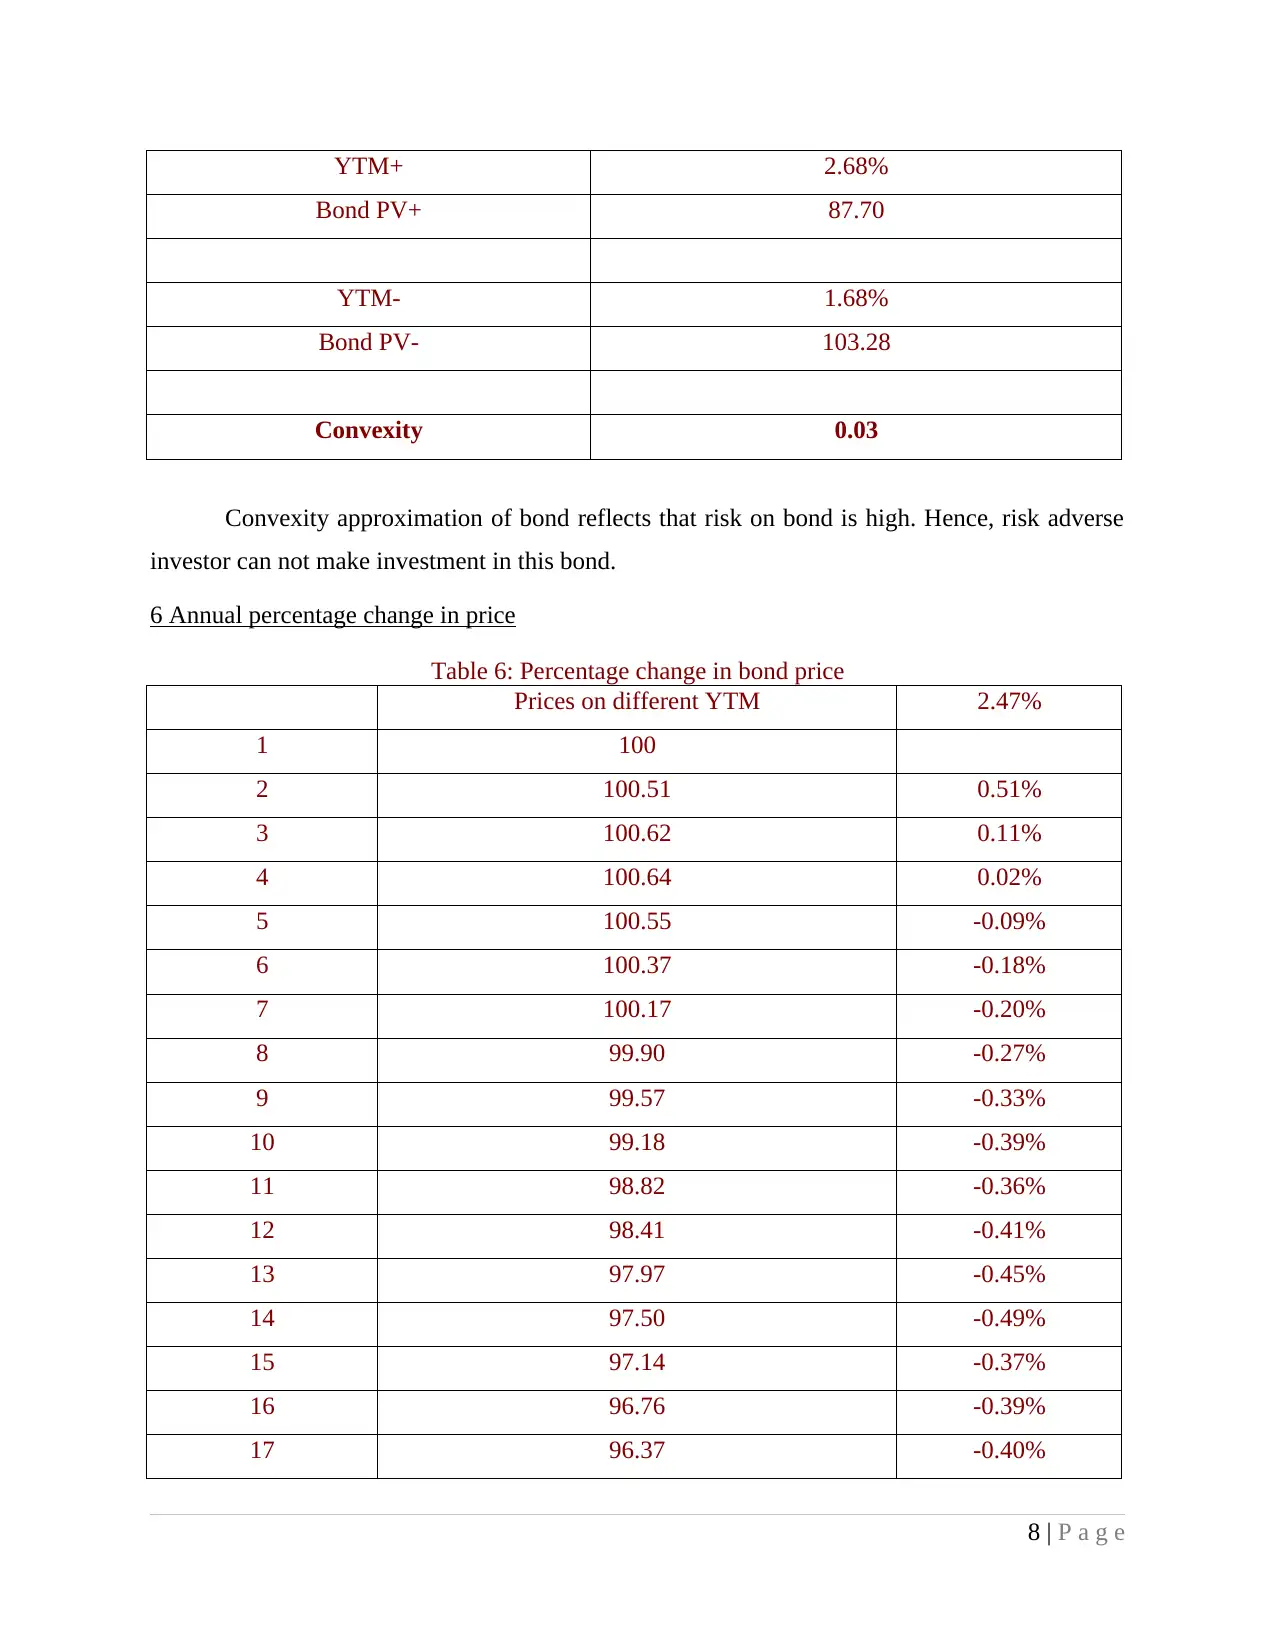
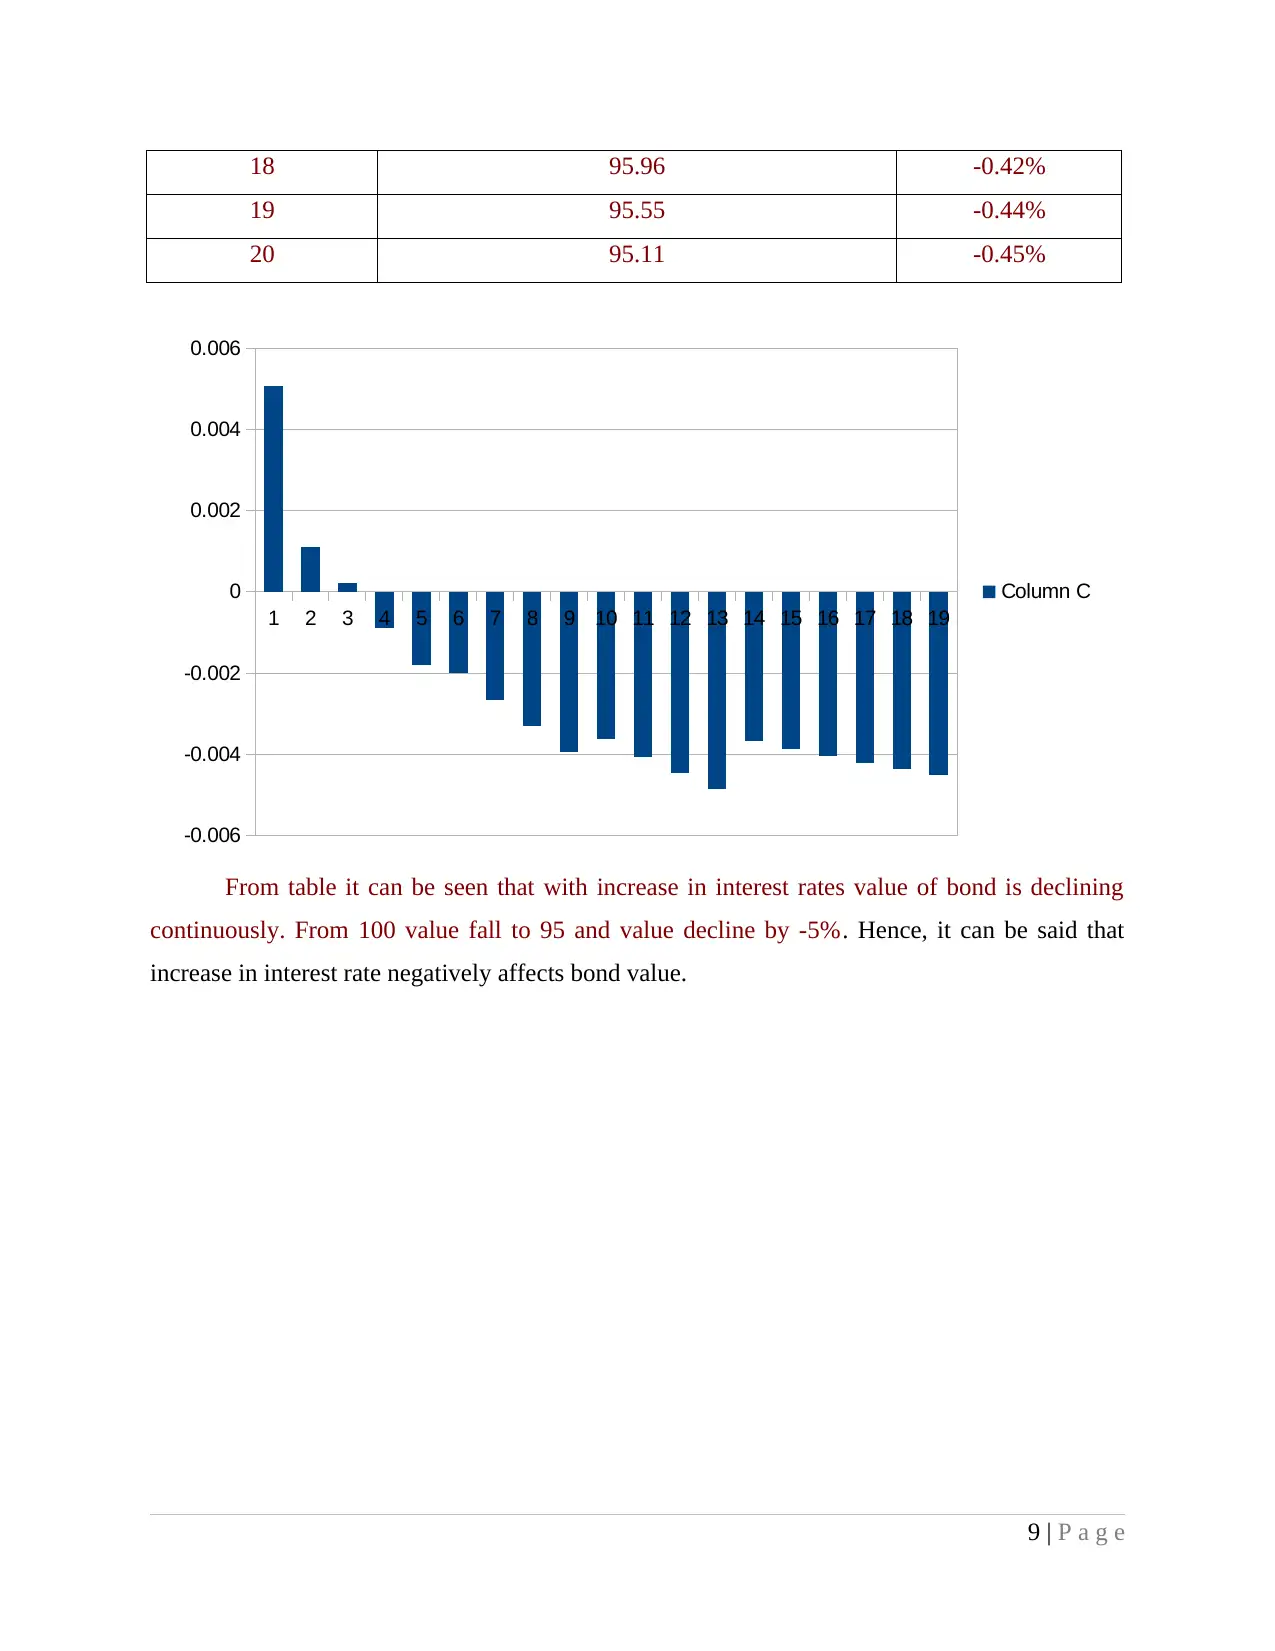
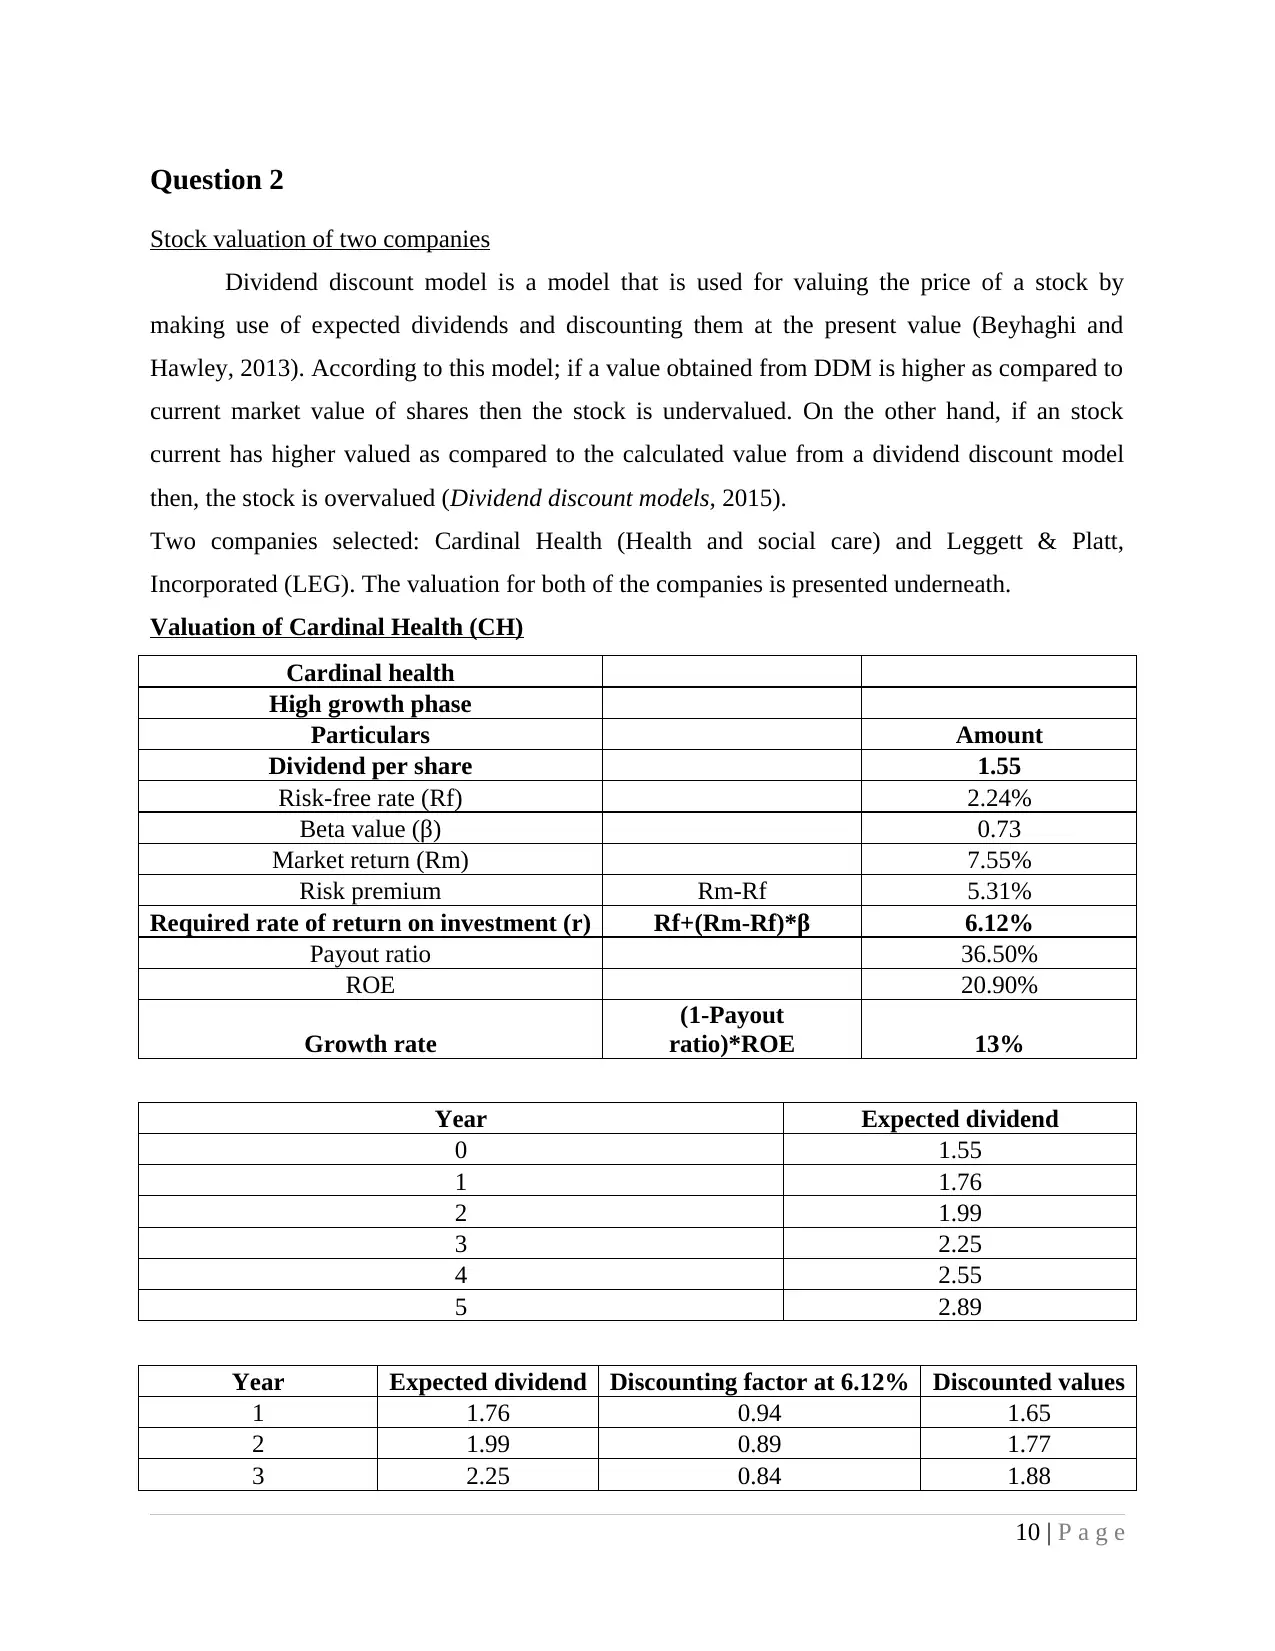
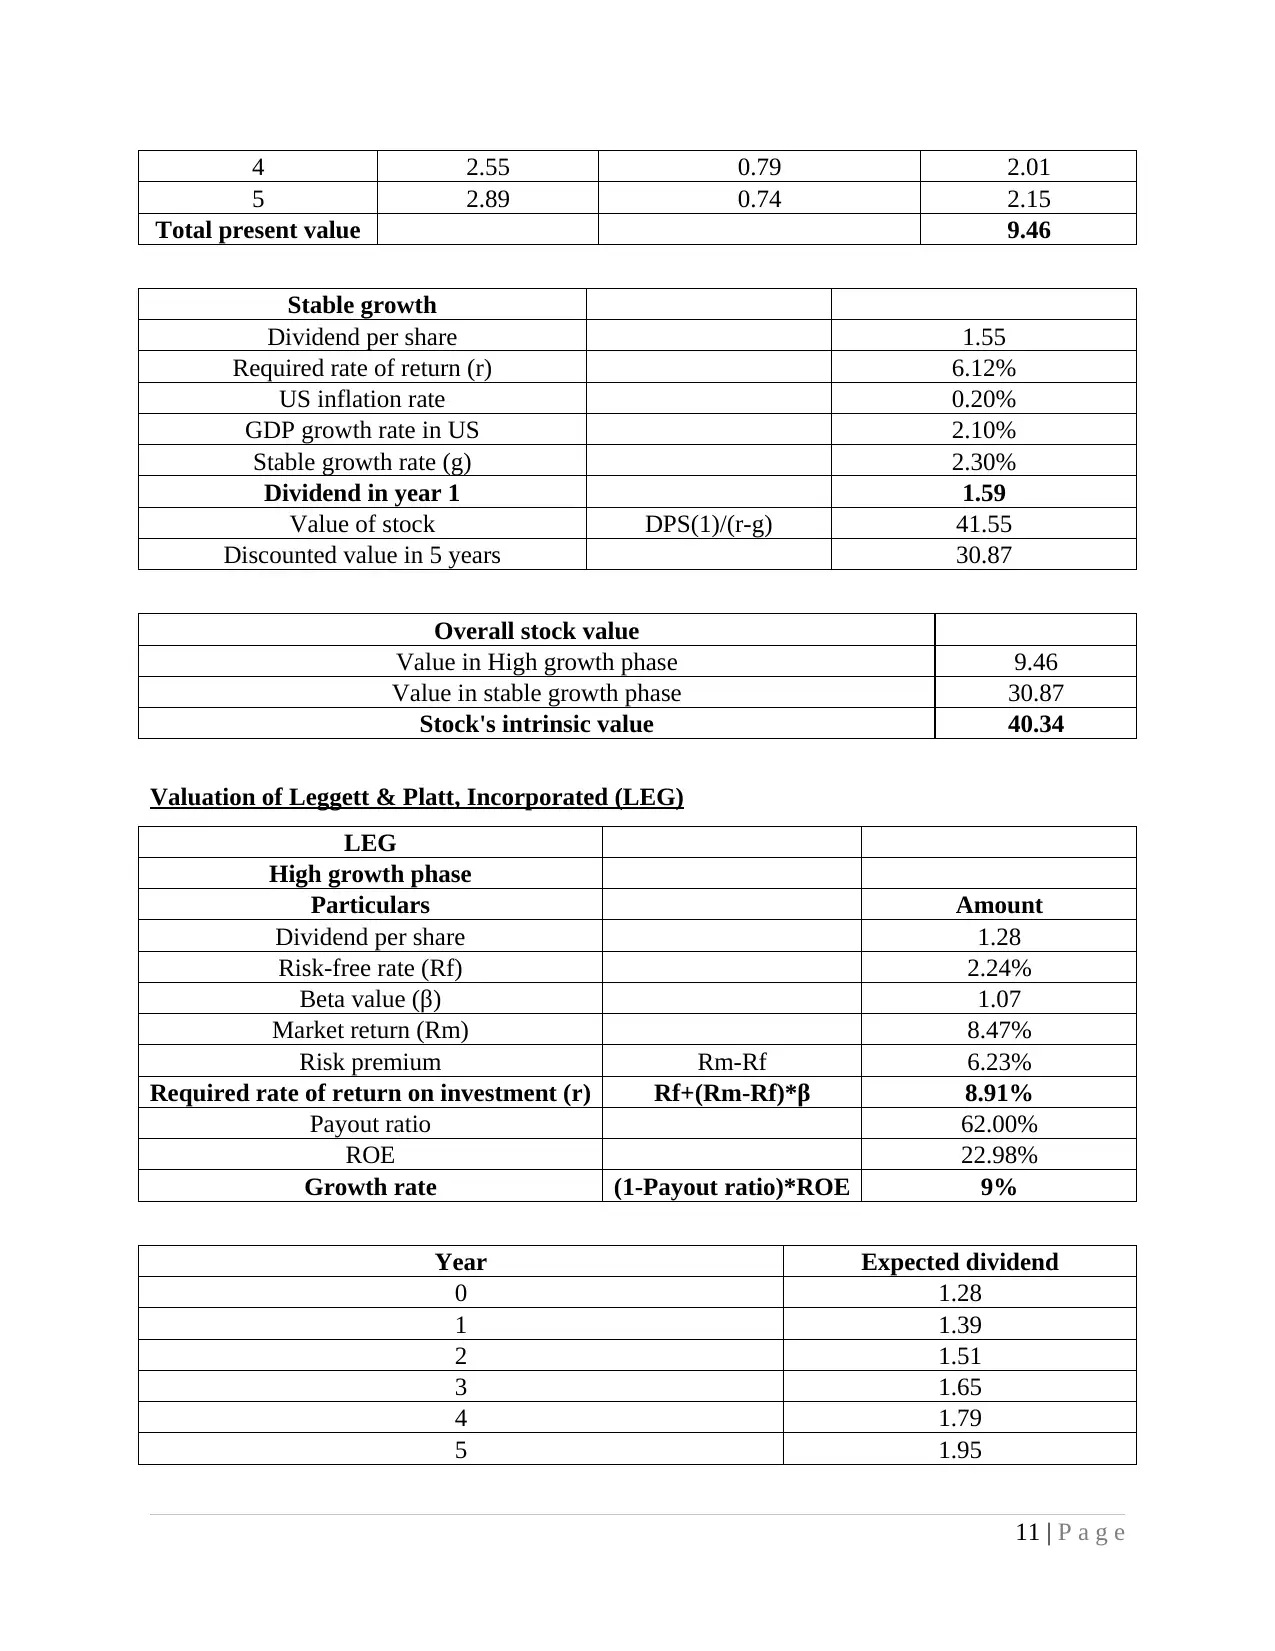
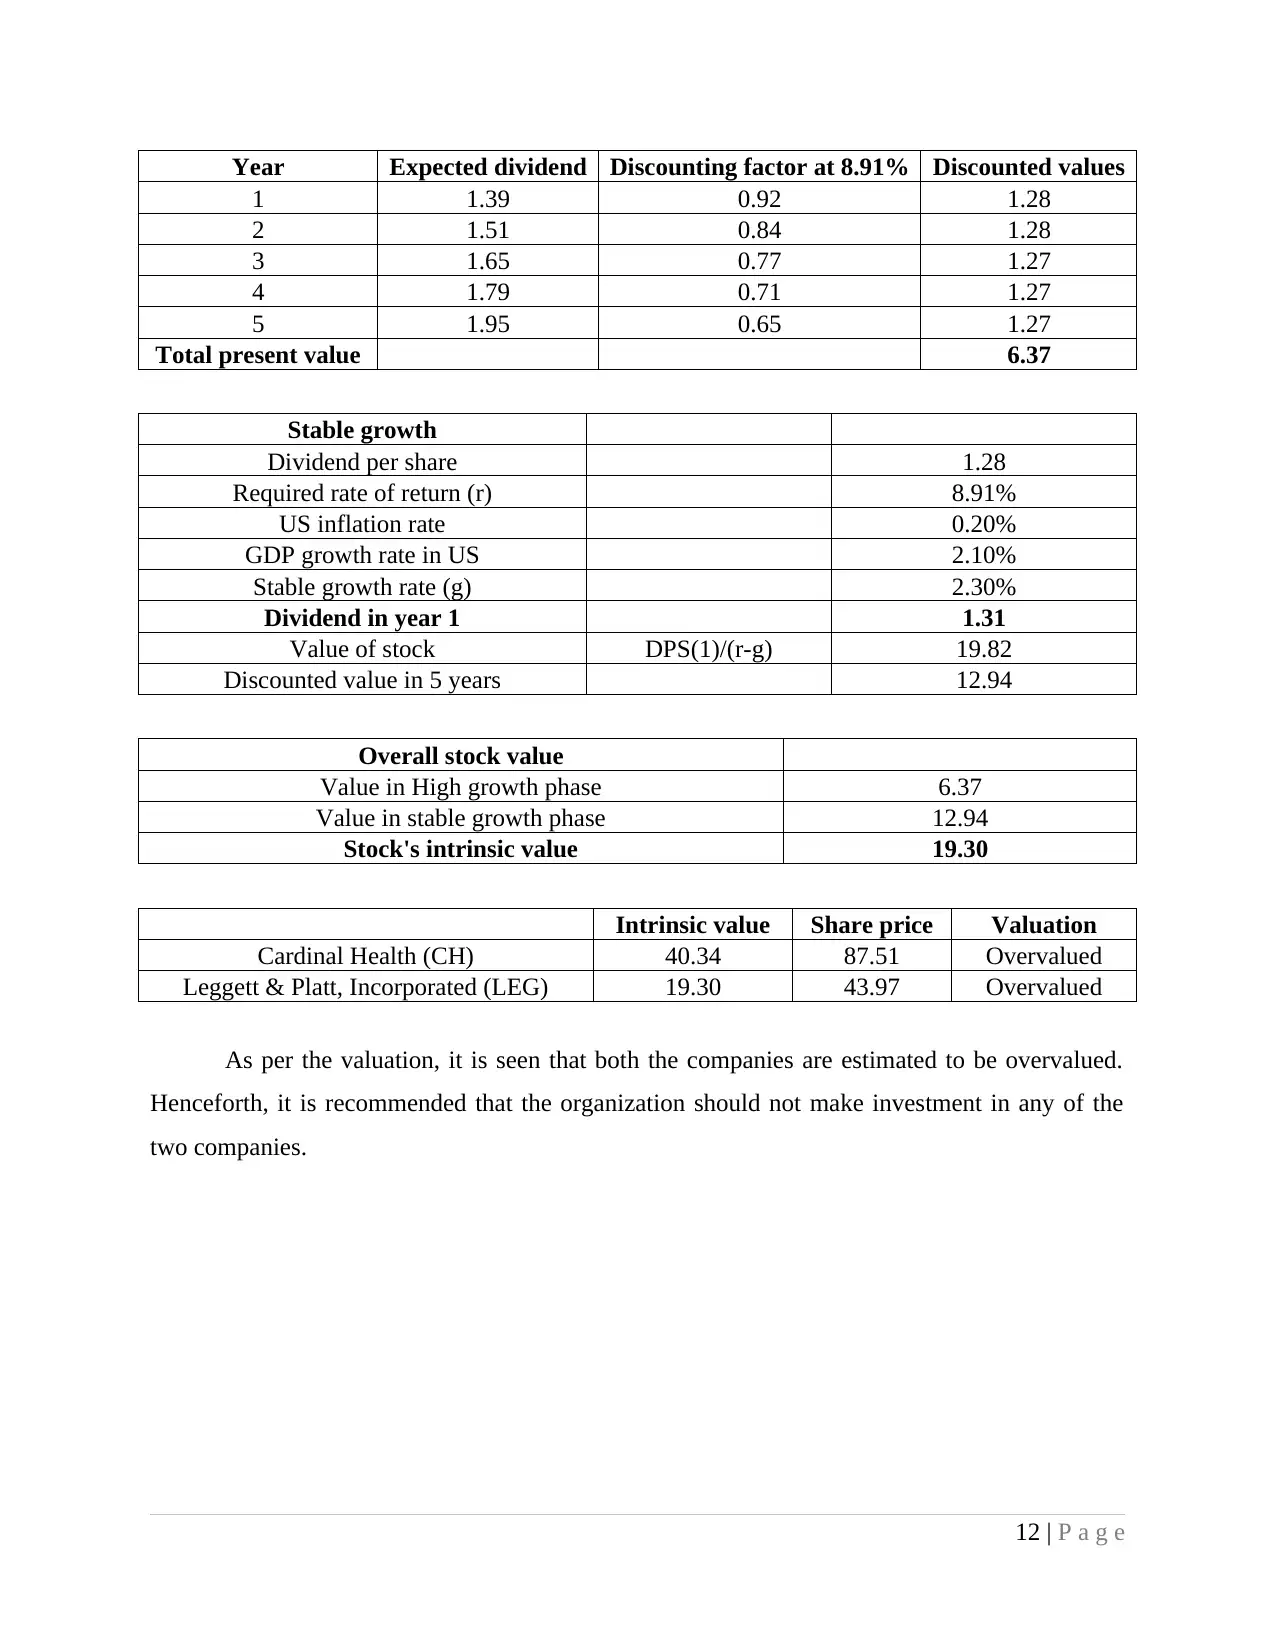
This financial management report provides a detailed analysis of bond and stock valuations, along with portfolio analysis, based on coursework submitted to the University of Greenwich. The report begins by valuing a bond, calculating its fair price, Macaulay and modified duration, convexity, and annual percentage change in price. It then moves on to stock valuation, applying the dividend discount model to two companies, Cardinal Health and Leggett & Platt, Incorporated, to determine their intrinsic values and provide buy/sell recommendations. The report also includes the collection of monthly share prices for 20 companies and calculates the expected return. The report uses appropriate financial techniques to guide investors in making informed decisions. The report provides a comprehensive overview of financial analysis techniques.
Document Page
FINANCIAL
MANAGEMENT
1 | P a g e
tabler-icon-diamond-filled.svg

Paraphrase This Document

Need a fresh take? Get an instant paraphrase of this document with our AI Paraphraser
Document Page
TABLE OF CONTENTS
Question 1........................................................................................................................................3
1 Fair price of the bond................................................................................................................3
2 Macaulay and modified duration..............................................................................................5
3 Duration approximation for different YTM...........................................................................11
4 Convexity................................................................................................................................11
5 Convexity approximation.......................................................................................................12
6 Annual percentage change in price.........................................................................................12
Question 2......................................................................................................................................14
Stock valuation of two companies.............................................................................................14
Assumptions used in the valuation and their rationale..............................................................16
Advice in terms of buying or selling.........................................................................................17
Question 3......................................................................................................................................17
1) Collection of closing monthly share prices for 20 companies..............................................17
2) Expected return......................................................................................................................17
REFERENCES..............................................................................................................................19
2 | P a g e
Document Page
Introduction
The report presented herewith emphasizes on evaluating bonds and stocks. It is through
adoption of appropriate valuation techniques that the investor is able to invest in appropriate
stocks. The report provides a valuation of bonds, stocks and portfolio. It is through adoption of
appropriate financial techniques that the investor can invest in right portfolio.
Question 1
1 Fair price of the bond
Table 1: Calculation of bond value
1 2 3 4 5 6
Bond cash
flows 1.88 1.88 1.88 1.88 1.88 1.88
Discount rate 1.53% 1.62% 1.66% 1.71% 1.76% 1.82%
PV factor 0.985 0.968 0.952 0.934 0.916 0.898
PV 1.847 1.816 1.785 1.752 1.718 1.683
7 8 9 10 11 12
1.88 1.88 1.88 1.88 1.88 1.88
1.86% 1.90% 1.94% 1.98% 2.01% 2.04%
0.879 0.860 0.841 0.822 0.803 0.785
1.648 1.613 1.577 1.541 1.506 1.471
13 14 15 16 17 18 19 20
1.88 1.88 1.88 1.88 1.88 1.88 1.88 101.88
2.07% 2.11% 2.12% 2.14% 2.16% 2.18% 2.19% 2.21%
0.766 0.747 0.730 0.713 0.696 0.679 0.662 0.646
1.436 1.401 1.368 1.336 1.304 1.273 1.242 65.796
Bond PV 95.11
3 | P a g e
Document Page
Price of the bond refers to actual price of the bond. Like stock market price of bond are
not determined by the investors. There is a interest rates that are determined by the central bank.
With change in interest rate price of bond get changed. Means that interest rate is used to
compute fair value of the bond (Bond payable. 2015). In this regard market interest rate is taken
as discount rate for computing present value of the bond cash inflows. In the calculation discount
rate is taken and by using it cash flows are discounted for the bond. In order to compute present
value of the bond present value of interest is computed and added to investment amount. After
that by using present value function of excel current value of the bond is calculated.
4 | P a g e
tabler-icon-diamond-filled.svg

Paraphrase This Document

Need a fresh take? Get an instant paraphrase of this document with our AI Paraphraser
Document Page
2 Macaulay and modified duration
Table 2: Calculation of Macaulay and modified duration
0 1 2 3 4 5
-95.11 1.88 1.88 1.88 1.88 1.88
YTM 1.88% 1.85% 1.84% 1.84% 1.84%
PV factor 0.9815469179 0.9640305264
0.94677
6632
0.92979
82414 0.91285021
Numerator 1.8404004711 1.807557237
1.77520
6185
1.74337
17026 1.7115941438
6 7 8 9 10 11
1.88 1.88 1.88 1.88 1.88 1.88
1.85% 1.87% 1.89% 1.92% 2.01% 2.01%
0.8957468141 0.8785855366
0.86098
48597 0.8426792381
0.81951
83094
0.80336
79967
1.6795252764 1.6473478812
1.61434
66119 1.5800235715
1.53659
68302
1.50631
49938
12 13 14 15 16 17
1.88 1.88 1.88 1.88 1.88 1.88
2.07% 2.16% 2.27% 2.39% 2.57% 2.84%
0.7817861623 0.7579176915 0.7307657743 0.7015629515 0.6664009562 0.621342782
1.4658490542 1.4210956716 1.3701858268 1.3154305341 1.2495017928 1.1650177162
18 19 20
1.88 1.88 101.88
3.29% 4.20% 6.94%
0.5582676883 0.45756934 0.2615687418
1.0467519155 0.8579425124 26.6473155746
5 | P a g e
Document Page
Numerator 54.9813755028
Denominator 95.11
Macaulay Duration 0.5780563
Modified Duration 0.6
Modified duration reflects the change that may happen in bond prices with change in
interest rates (Free bond valuation- yield to maturity spreadsheet. 2015). However, it does not
directly indicate the percentage change in price of bond due to change of some basis points in
interest rate. Modified duration value is used to measure this volatility by applying a specific
formula. That formula is Bond Price Change = Yield Change × Modified Duration × Bond Price.
Macaulay duration indicate the average time up to which an investor will receive a cash
flow (Macaulay duration, modified duration and effective duration. 2015). Here Macaulay
duration is one year annual. This means in this time period an investor will receive return on the
invested corpus. This also indicates that an investor is taking a risk and in case of rise in interest
rate by central bank value of bond will decline.
6 | P a g e
Document Page
3 Duration approximation for different YTM
Table 3: Duration approximation
Numerator 54.98
Denominator 95.11
Macaulay Duration 0.5780418881
Duration approximation indicates the change in time that happens due to change in
interest rate and bond prices (Bond formulas. 2015). Value of calculation indicates that if interest
rates get changed then eighteen months earlier investment will be recovered.
4 Convexity
Table 4: Calculation of convexity
YTM 1.19%
Bond PV 88.860730511
YTM+ 1.69%
Bond PV+ 84.5702329099
YTM- 0.69%
Bond PV- 93.3547867939
Convexity 177.43
Convexity indicates the change in duration due to change in interest rates and bond
prices. In comparison to duration convexity gives more accurate view of volatility (Duration and
convexity. 2015). As per convexity investment will be recovered in eleven years. Means that ROI
will be low.
5 Convexity approximation
Table 5: Calculation of convexity approximation
YTM 2.18%
Bond PV 95.11
7 | P a g e
tabler-icon-diamond-filled.svg

Paraphrase This Document

Need a fresh take? Get an instant paraphrase of this document with our AI Paraphraser
Document Page
YTM+ 2.68%
Bond PV+ 87.70
YTM- 1.68%
Bond PV- 103.28
Convexity 0.03
Convexity approximation of bond reflects that risk on bond is high. Hence, risk adverse
investor can not make investment in this bond.
6 Annual percentage change in price
Table 6: Percentage change in bond price
Prices on different YTM 2.47%
1 100
2 100.51 0.51%
3 100.62 0.11%
4 100.64 0.02%
5 100.55 -0.09%
6 100.37 -0.18%
7 100.17 -0.20%
8 99.90 -0.27%
9 99.57 -0.33%
10 99.18 -0.39%
11 98.82 -0.36%
12 98.41 -0.41%
13 97.97 -0.45%
14 97.50 -0.49%
15 97.14 -0.37%
16 96.76 -0.39%
17 96.37 -0.40%
8 | P a g e
Document Page
18 95.96 -0.42%
19 95.55 -0.44%
20 95.11 -0.45%
From table it can be seen that with increase in interest rates value of bond is declining
continuously. From 100 value fall to 95 and value decline by -5%. Hence, it can be said that
increase in interest rate negatively affects bond value.
9 | P a g e
1 2 3 4 5 6 7 8 9 10 11 12 13 14 15 16 17 18 19
-0.006
-0.004
-0.002
0
0.002
0.004
0.006
Column C
Document Page
Question 2
Stock valuation of two companies
Dividend discount model is a model that is used for valuing the price of a stock by
making use of expected dividends and discounting them at the present value (Beyhaghi and
Hawley, 2013). According to this model; if a value obtained from DDM is higher as compared to
current market value of shares then the stock is undervalued. On the other hand, if an stock
current has higher valued as compared to the calculated value from a dividend discount model
then, the stock is overvalued (Dividend discount models, 2015).
Two companies selected: Cardinal Health (Health and social care) and Leggett & Platt,
Incorporated (LEG). The valuation for both of the companies is presented underneath.
Valuation of Cardinal Health (CH)
Cardinal health
High growth phase
Particulars Amount
Dividend per share 1.55
Risk-free rate (Rf) 2.24%
Beta value (β) 0.73
Market return (Rm) 7.55%
Risk premium Rm-Rf 5.31%
Required rate of return on investment (r) Rf+(Rm-Rf)*β 6.12%
Payout ratio 36.50%
ROE 20.90%
Growth rate
(1-Payout
ratio)*ROE 13%
Year Expected dividend
0 1.55
1 1.76
2 1.99
3 2.25
4 2.55
5 2.89
Year Expected dividend Discounting factor at 6.12% Discounted values
1 1.76 0.94 1.65
2 1.99 0.89 1.77
3 2.25 0.84 1.88
10 | P a g e
tabler-icon-diamond-filled.svg

Paraphrase This Document

Need a fresh take? Get an instant paraphrase of this document with our AI Paraphraser
Document Page
4 2.55 0.79 2.01
5 2.89 0.74 2.15
Total present value 9.46
Stable growth
Dividend per share 1.55
Required rate of return (r) 6.12%
US inflation rate 0.20%
GDP growth rate in US 2.10%
Stable growth rate (g) 2.30%
Dividend in year 1 1.59
Value of stock DPS(1)/(r-g) 41.55
Discounted value in 5 years 30.87
Overall stock value
Value in High growth phase 9.46
Value in stable growth phase 30.87
Stock's intrinsic value 40.34
Valuation of Leggett & Platt, Incorporated (LEG)
LEG
High growth phase
Particulars Amount
Dividend per share 1.28
Risk-free rate (Rf) 2.24%
Beta value (β) 1.07
Market return (Rm) 8.47%
Risk premium Rm-Rf 6.23%
Required rate of return on investment (r) Rf+(Rm-Rf)*β 8.91%
Payout ratio 62.00%
ROE 22.98%
Growth rate (1-Payout ratio)*ROE 9%
Year Expected dividend
0 1.28
1 1.39
2 1.51
3 1.65
4 1.79
5 1.95
11 | P a g e
Document Page
Year Expected dividend Discounting factor at 8.91% Discounted values
1 1.39 0.92 1.28
2 1.51 0.84 1.28
3 1.65 0.77 1.27
4 1.79 0.71 1.27
5 1.95 0.65 1.27
Total present value 6.37
Stable growth
Dividend per share 1.28
Required rate of return (r) 8.91%
US inflation rate 0.20%
GDP growth rate in US 2.10%
Stable growth rate (g) 2.30%
Dividend in year 1 1.31
Value of stock DPS(1)/(r-g) 19.82
Discounted value in 5 years 12.94
Overall stock value
Value in High growth phase 6.37
Value in stable growth phase 12.94
Stock's intrinsic value 19.30
Intrinsic value Share price Valuation
Cardinal Health (CH) 40.34 87.51 Overvalued
Leggett & Platt, Incorporated (LEG) 19.30 43.97 Overvalued
As per the valuation, it is seen that both the companies are estimated to be overvalued.
Henceforth, it is recommended that the organization should not make investment in any of the
two companies.
12 | P a g e
chevron_up_icon
1 out of 20
circle_padding
hide_on_mobile
zoom_out_icon
[object Object]