Management Accounting Assignment - UGB222 Analysis & Solutions
VerifiedAdded on 2023/01/05
|14
|3064
|89
Homework Assignment
AI Summary
This document presents a comprehensive solution to a management accounting assignment, addressing key concepts and practical applications. It begins with a schedule of the cost of goods manufactured and an accompanying income statement, followed by a differential analysis comparing absorption and marginal costing methods, including the calculation of cost per unit and income statements for both. The assignment then delves into variance analysis, demonstrating material, labor, and overhead variances. Finally, it concludes with calculations of contribution margin and break-even point, along with detailed explanations of the underlying principles and calculations. The assignment covers the key areas of managerial accounting, including cost accounting, variance analysis, and break-even analysis, providing a solid foundation for understanding financial and non-financial information within a business context.

Management Accounting
1
1
Paraphrase This Document
Need a fresh take? Get an instant paraphrase of this document with our AI Paraphraser
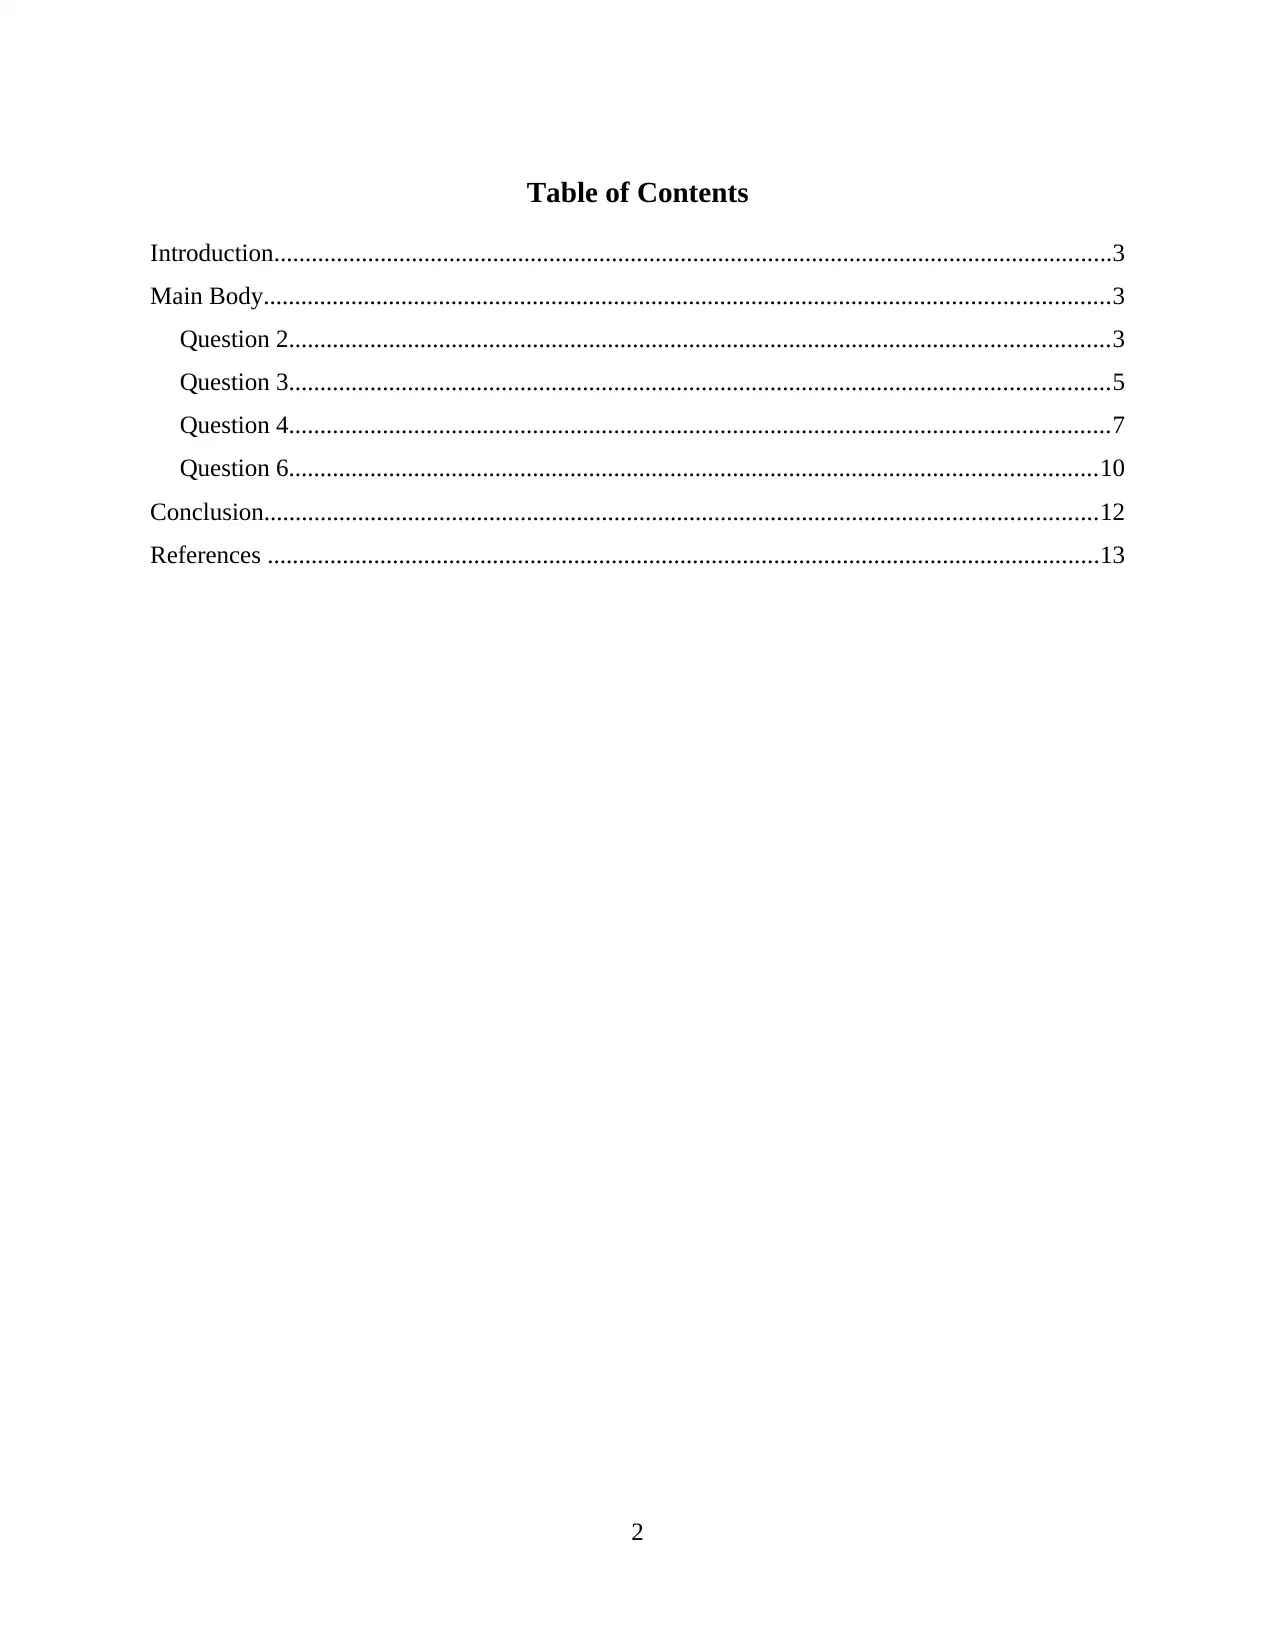
Table of Contents
Introduction......................................................................................................................................3
Main Body.......................................................................................................................................3
Question 2...................................................................................................................................3
Question 3...................................................................................................................................5
Question 4...................................................................................................................................7
Question 6.................................................................................................................................10
Conclusion.....................................................................................................................................12
References .....................................................................................................................................13
2
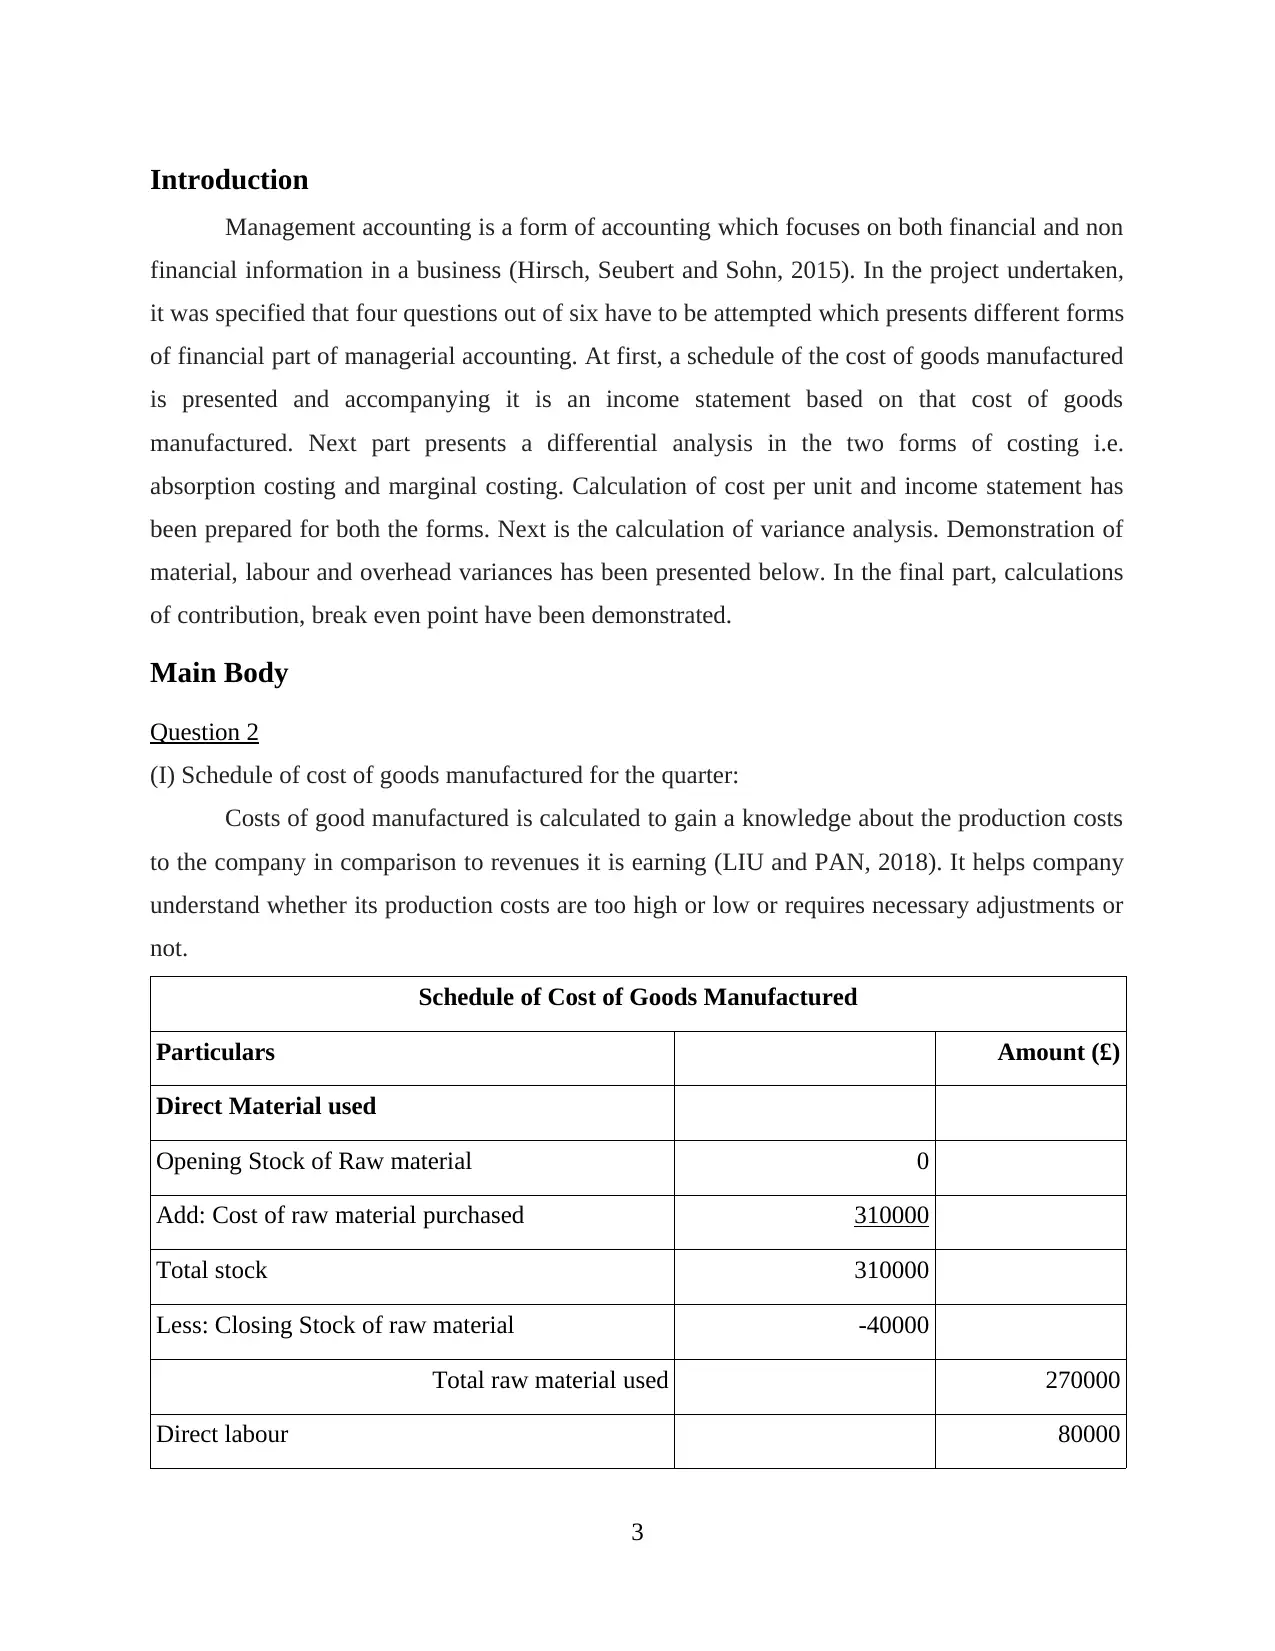
Introduction
Management accounting is a form of accounting which focuses on both financial and non
financial information in a business (Hirsch, Seubert and Sohn, 2015). In the project undertaken,
it was specified that four questions out of six have to be attempted which presents different forms
of financial part of managerial accounting. At first, a schedule of the cost of goods manufactured
is presented and accompanying it is an income statement based on that cost of goods
manufactured. Next part presents a differential analysis in the two forms of costing i.e.
absorption costing and marginal costing. Calculation of cost per unit and income statement has
been prepared for both the forms. Next is the calculation of variance analysis. Demonstration of
material, labour and overhead variances has been presented below. In the final part, calculations
of contribution, break even point have been demonstrated.
Main Body
Question 2
(I) Schedule of cost of goods manufactured for the quarter:
Costs of good manufactured is calculated to gain a knowledge about the production costs
to the company in comparison to revenues it is earning (LIU and PAN, 2018). It helps company
understand whether its production costs are too high or low or requires necessary adjustments or
not.
Schedule of Cost of Goods Manufactured
Particulars Amount (£)
Direct Material used
Opening Stock of Raw material 0
Add: Cost of raw material purchased 310000
Total stock 310000
Less: Closing Stock of raw material -40000
Total raw material used 270000
Direct labour 80000
3
⊘ This is a preview!⊘
Do you want full access?
Subscribe today to unlock all pages.
Trusted by 1+ million students worldwide
Manufacturing Overhead
Indirect materials – cleaning supplies 6000
Indirect labour 135000
Depreciation – production equipment 75000
Insurance – factory 9000
Taxes – factory 0
Maintenance - factory 47000
Rent 48000
Utilities 40500
Total manufacturing overhead 360500
Total manufacturing costs 710500
Add: Opening WIP 0
Less: Closing WIP -30000 -30000
Cost of goods manufactured 680500
Working Note:
Total Factory Overhead Office Overhead
Utilities 45000 40500 (90%) 4500 (10%)
Rent 60000 48000 (80%) 12000 (20%)
(ii) Income Statement
Income Statement
Particulars Amount (£)
Sales 975000
Cost of goods sold
4
Paraphrase This Document
Need a fresh take? Get an instant paraphrase of this document with our AI Paraphraser
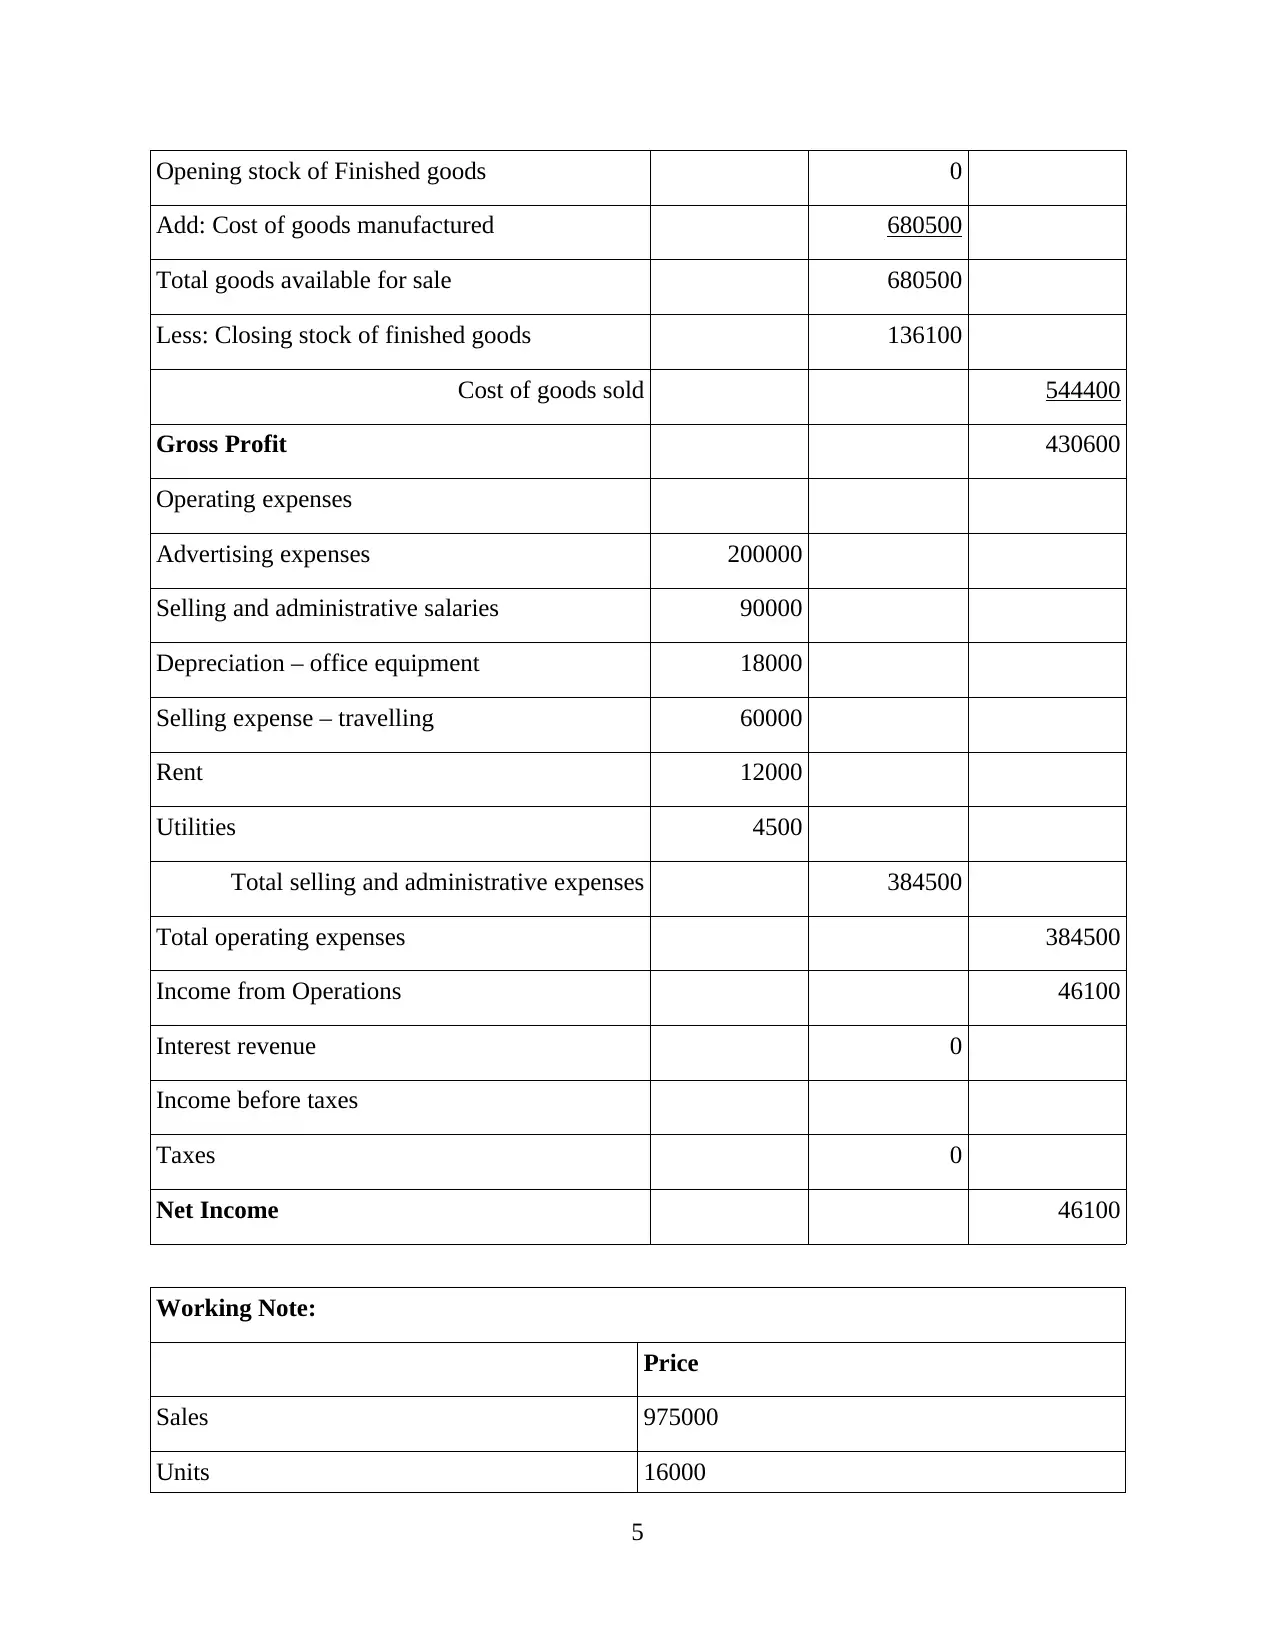
Opening stock of Finished goods 0
Add: Cost of goods manufactured 680500
Total goods available for sale 680500
Less: Closing stock of finished goods 136100
Cost of goods sold 544400
Gross Profit 430600
Operating expenses
Advertising expenses 200000
Selling and administrative salaries 90000
Depreciation – office equipment 18000
Selling expense – travelling 60000
Rent 12000
Utilities 4500
Total selling and administrative expenses 384500
Total operating expenses 384500
Income from Operations 46100
Interest revenue 0
Income before taxes
Taxes 0
Net Income 46100
Working Note:
Price
Sales 975000
Units 16000
5
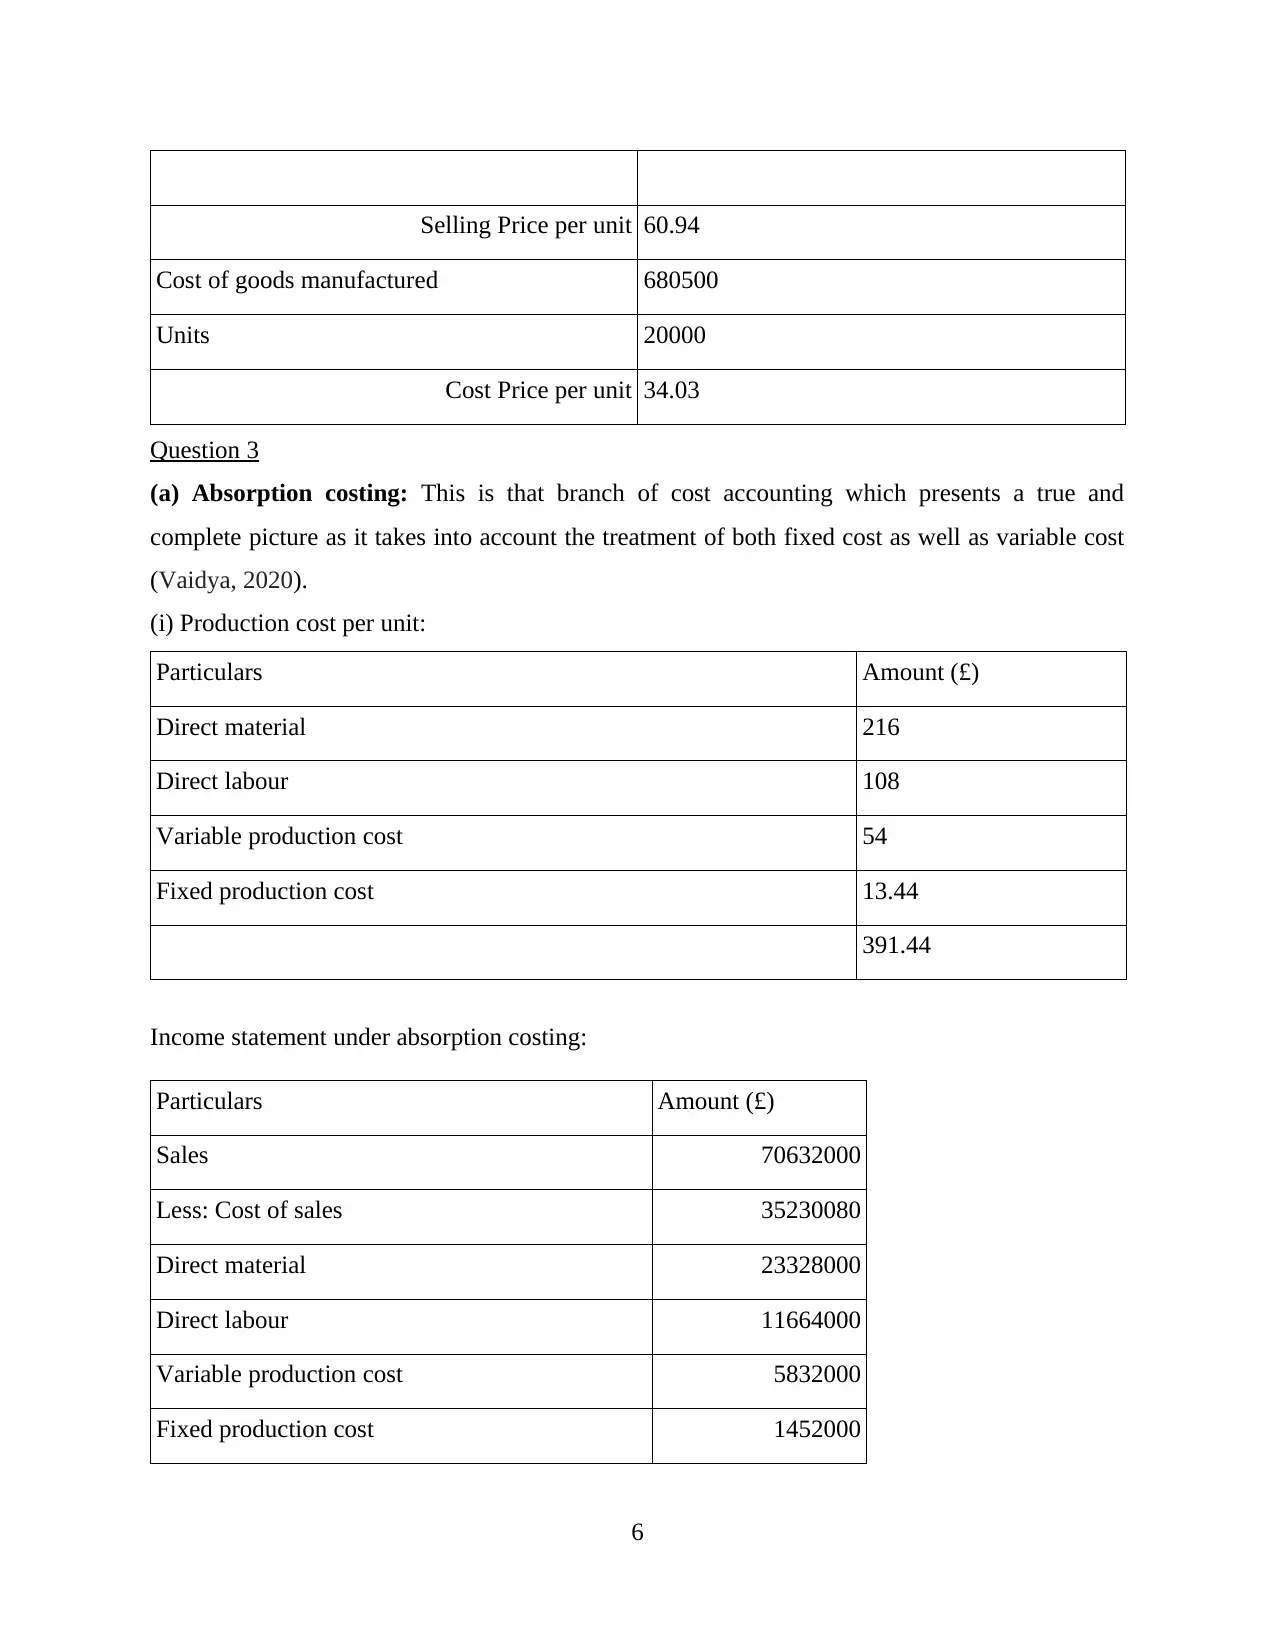
Selling Price per unit 60.94
Cost of goods manufactured 680500
Units 20000
Cost Price per unit 34.03
Question 3
(a) Absorption costing: This is that branch of cost accounting which presents a true and
complete picture as it takes into account the treatment of both fixed cost as well as variable cost
(Vaidya, 2020).
(i) Production cost per unit:
Particulars Amount (£)
Direct material 216
Direct labour 108
Variable production cost 54
Fixed production cost 13.44
391.44
Income statement under absorption costing:
Particulars Amount (£)
Sales 70632000
Less: Cost of sales 35230080
Direct material 23328000
Direct labour 11664000
Variable production cost 5832000
Fixed production cost 1452000
6
⊘ This is a preview!⊘
Do you want full access?
Subscribe today to unlock all pages.
Trusted by 1+ million students worldwide
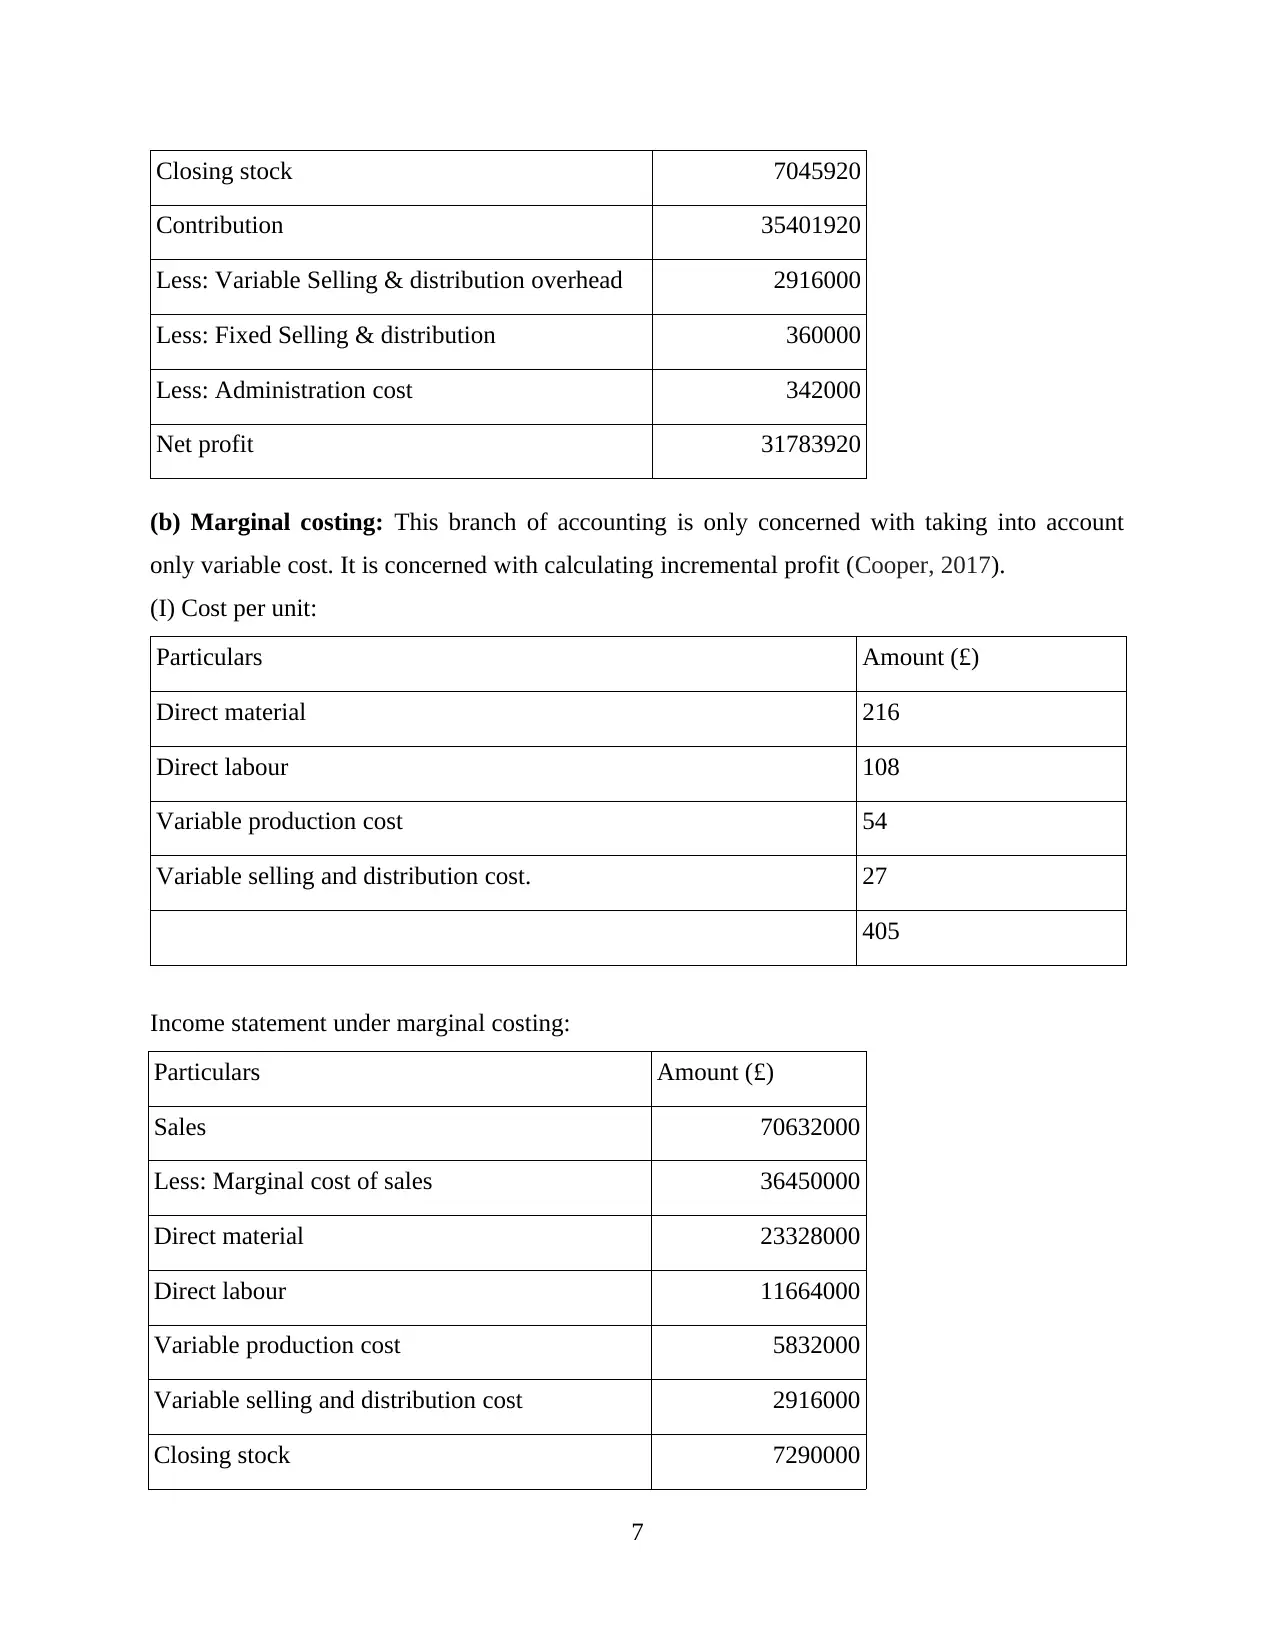
Closing stock 7045920
Contribution 35401920
Less: Variable Selling & distribution overhead 2916000
Less: Fixed Selling & distribution 360000
Less: Administration cost 342000
Net profit 31783920
(b) Marginal costing: This branch of accounting is only concerned with taking into account
only variable cost. It is concerned with calculating incremental profit (Cooper, 2017).
(I) Cost per unit:
Particulars Amount (£)
Direct material 216
Direct labour 108
Variable production cost 54
Variable selling and distribution cost. 27
405
Income statement under marginal costing:
Particulars Amount (£)
Sales 70632000
Less: Marginal cost of sales 36450000
Direct material 23328000
Direct labour 11664000
Variable production cost 5832000
Variable selling and distribution cost 2916000
Closing stock 7290000
7
Paraphrase This Document
Need a fresh take? Get an instant paraphrase of this document with our AI Paraphraser
Contribution 34182000
Less: Fixed production cost 1452000
Less: Fixed Selling & distribution 360000
Less: Administration cost 342000
Net profit 32028000
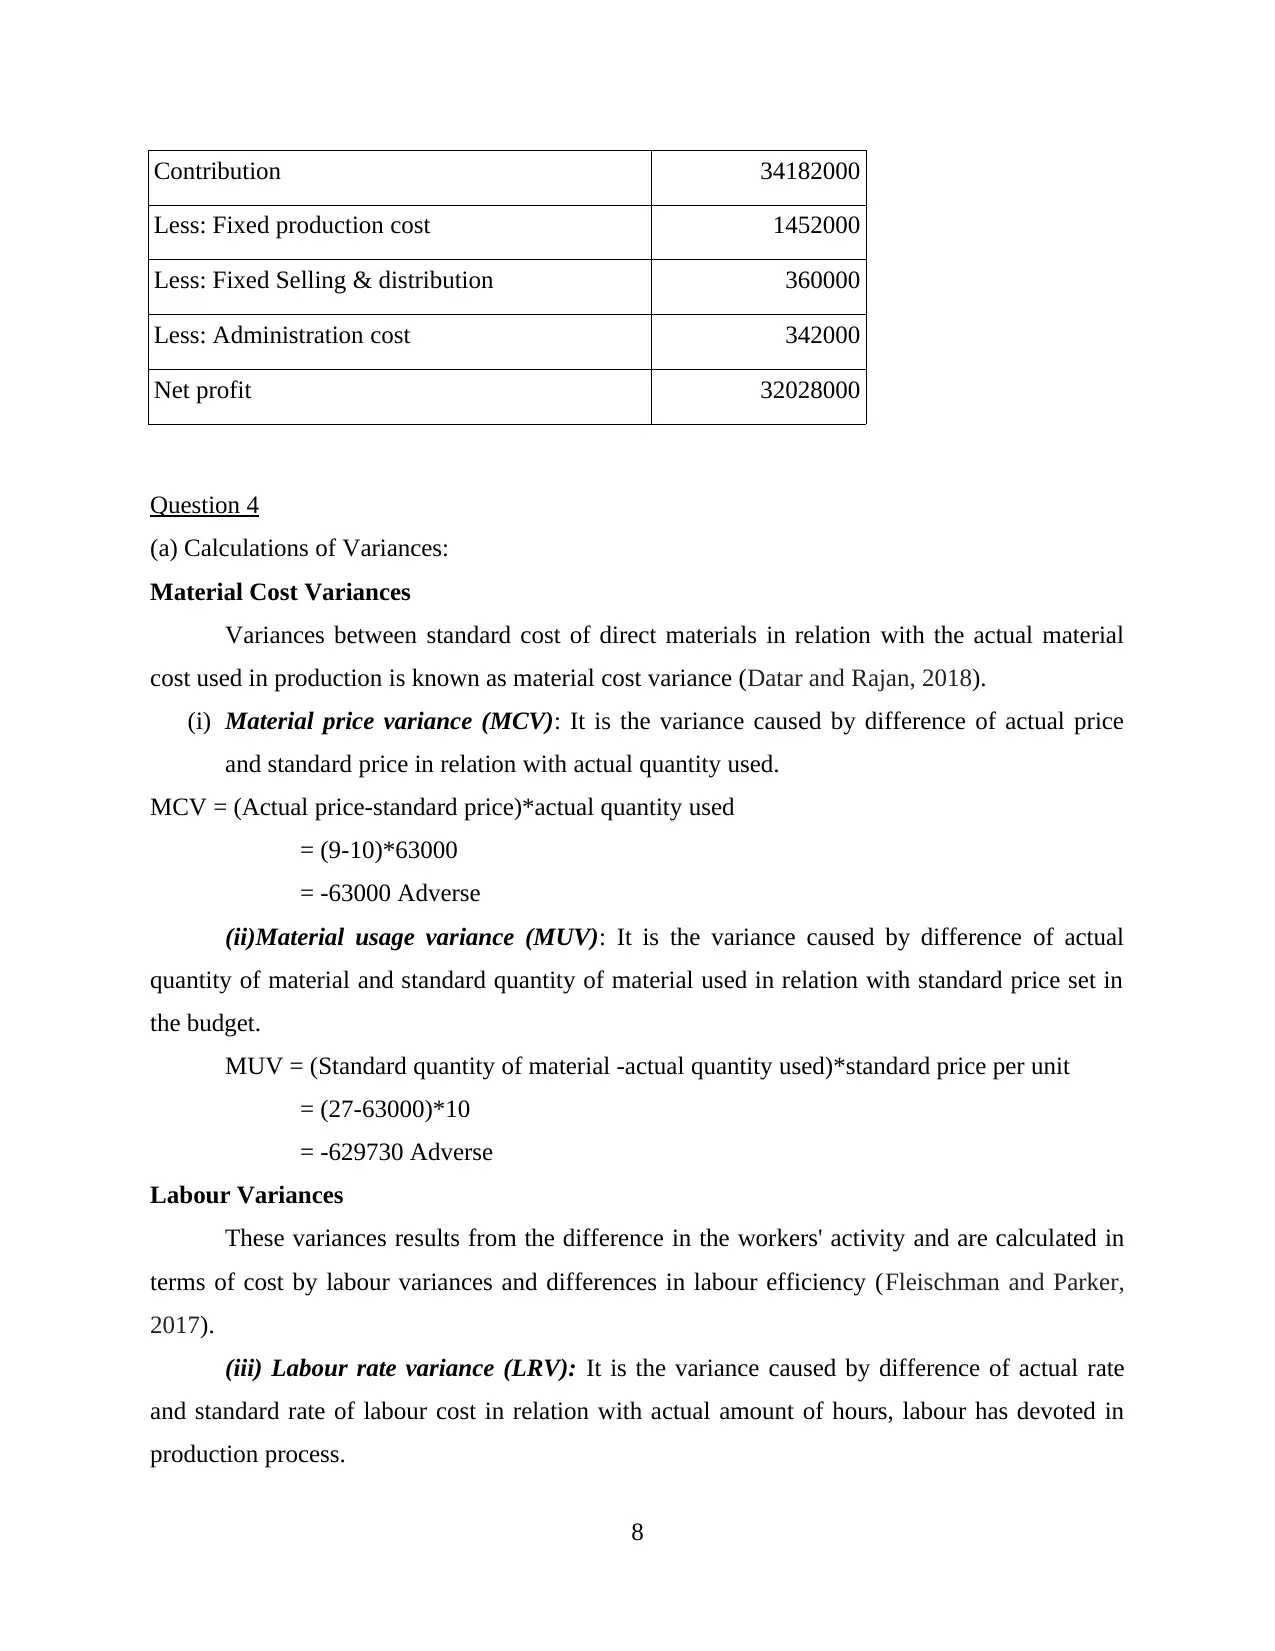
Question 4
(a) Calculations of Variances:
Material Cost Variances
Variances between standard cost of direct materials in relation with the actual material
cost used in production is known as material cost variance (Datar and Rajan, 2018).
(i) Material price variance (MCV): It is the variance caused by difference of actual price
and standard price in relation with actual quantity used.
MCV = (Actual price-standard price)*actual quantity used
= (9-10)*63000
= -63000 Adverse
(ii)Material usage variance (MUV): It is the variance caused by difference of actual
quantity of material and standard quantity of material used in relation with standard price set in
the budget.
MUV = (Standard quantity of material -actual quantity used)*standard price per unit
= (27-63000)*10
= -629730 Adverse
Labour Variances
These variances results from the difference in the workers' activity and are calculated in
terms of cost by labour variances and differences in labour efficiency (Fleischman and Parker,
2017).
(iii) Labour rate variance (LRV): It is the variance caused by difference of actual rate
and standard rate of labour cost in relation with actual amount of hours, labour has devoted in
production process.
8
Less: Fixed production cost 1452000
Less: Fixed Selling & distribution 360000
Less: Administration cost 342000
Net profit 32028000
Question 4
(a) Calculations of Variances:
Material Cost Variances
Variances between standard cost of direct materials in relation with the actual material
cost used in production is known as material cost variance (Datar and Rajan, 2018).
(i) Material price variance (MCV): It is the variance caused by difference of actual price
and standard price in relation with actual quantity used.
MCV = (Actual price-standard price)*actual quantity used
= (9-10)*63000
= -63000 Adverse
(ii)Material usage variance (MUV): It is the variance caused by difference of actual
quantity of material and standard quantity of material used in relation with standard price set in
the budget.
MUV = (Standard quantity of material -actual quantity used)*standard price per unit
= (27-63000)*10
= -629730 Adverse
Labour Variances
These variances results from the difference in the workers' activity and are calculated in
terms of cost by labour variances and differences in labour efficiency (Fleischman and Parker,
2017).
(iii) Labour rate variance (LRV): It is the variance caused by difference of actual rate
and standard rate of labour cost in relation with actual amount of hours, labour has devoted in
production process.
8
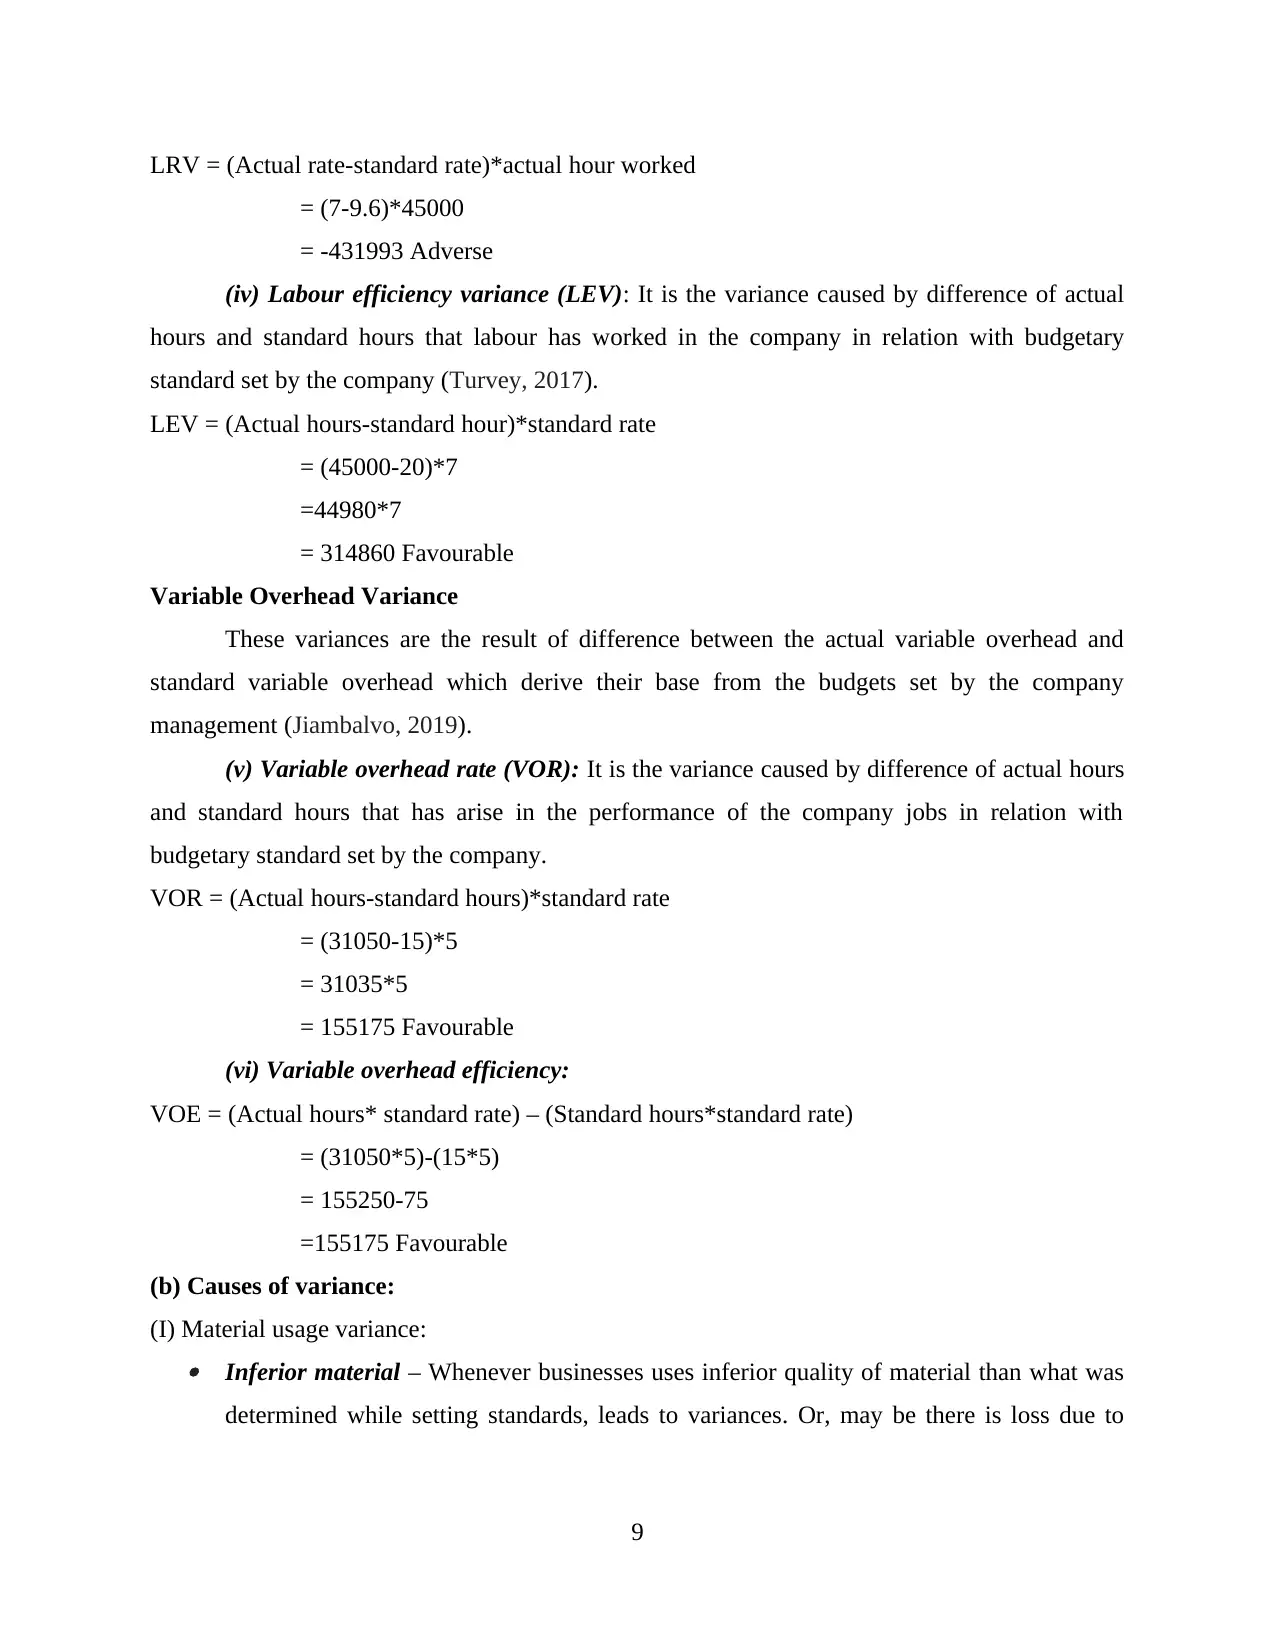
LRV = (Actual rate-standard rate)*actual hour worked
= (7-9.6)*45000
= -431993 Adverse
(iv) Labour efficiency variance (LEV): It is the variance caused by difference of actual
hours and standard hours that labour has worked in the company in relation with budgetary
standard set by the company (Turvey, 2017).
LEV = (Actual hours-standard hour)*standard rate
= (45000-20)*7
=44980*7
= 314860 Favourable
Variable Overhead Variance
These variances are the result of difference between the actual variable overhead and
standard variable overhead which derive their base from the budgets set by the company
management (Jiambalvo, 2019).
(v) Variable overhead rate (VOR): It is the variance caused by difference of actual hours
and standard hours that has arise in the performance of the company jobs in relation with
budgetary standard set by the company.
VOR = (Actual hours-standard hours)*standard rate
= (31050-15)*5
= 31035*5
= 155175 Favourable
(vi) Variable overhead efficiency:
VOE = (Actual hours* standard rate) – (Standard hours*standard rate)
= (31050*5)-(15*5)
= 155250-75
=155175 Favourable
(b) Causes of variance:
(I) Material usage variance: Inferior material – Whenever businesses uses inferior quality of material than what was
determined while setting standards, leads to variances. Or, may be there is loss due to
9
⊘ This is a preview!⊘
Do you want full access?
Subscribe today to unlock all pages.
Trusted by 1+ million students worldwide
pilferage which has gone unnoticed and added into usage of material or more material
was need to be procured, which get reflected as variances. Upfront standard – When standards set are too high to be followed in the actual terms, it
results in variances between actual and standards (Cooper, 2017). Or, may be during
production process, proper induction of material was not adopted, which resulted in
variances between standards set and the materials left post usage. Workers and equipments – The plants and machinery might not be in proper condition as
defined in standards. Therefore, more material could be used. Another reason may be
untrained workers. When the workers are not trained to use a material or equipment, it
results in wastage, which causes variances between standards and actual usage of
material. Or, workers might not use materials carefully, it will also result in wastage.
Therefore, carelessness and inefficiency of workers can also be said a reason for
variances.
Different material mix – One more reason of variance could be the use of different
material mix then what was determined in standard mix or, there could be changes in
product design, which could lead to different product mix. At last, there can be
accounting mistakes such as either the entries related to material were not made properly
or transferred to various jobs, etc.
(II) Labour efficiency variances: Labour skills – Skills of the labour can be one of the reasons for variance (Mitra, 2016).
For example, Labours are highly skilled for the job, then they will not consider the work
of their level and will not co-operate with others. This might result in differences in
efficiency standards and the actual job performance. Training – Suppose while setting the standards, management realises that workers need
training to operate some machinery or other equipment. They set up training process for
them but does not take into account the improvements caused by training. As a result,
employee performance will be improved in the actual performance, and will reflect as
variance. Raw material – There is change in raw material or the product mix or product design,
which is either not easy for workers to adopt or so facilitating that it results in a
10
Paraphrase This Document
Need a fresh take? Get an instant paraphrase of this document with our AI Paraphraser
considerable improvement in their performance. Both the cases, will lead to generation of
a deviation or variances in the efficiency of labour.
Time lag – There can be a difference or lag in the time when the budget or the standards
were set for the measuring the efficiency and the actual performance by the workers. This
can also lead to variance in estimated labour efficiency and the real performance. Also,
there might be a chance that due to some changes in the process or other thing, employee
morale is down, which will increase their idle time and reduce their efficiency.
(C) Determination of appropriate variance
Variance analysis refers to the process of identifying the lags or difference between
budgeted targets and actual performance. It form the basis of control functions by managers. It
helps them identify the reasons for deviations in the performance from the standards set by the
budgets (Warren, Jonick and Schneider, 2020). A company prepares multiple budgets which
form the basis of the performance management in different aspect under different criteria. It uses
the budgets and analysis of performance as per requirement. For example, a company is
performing its employee performance management. Then, it will desire to check their efficiency
and productivity level. So, it will make use of labour efficiency variance. If it happens to be
performing inventory management. It will check the amount of orders made for raw materials by
company, their processing, storage, handling, usage, etc. In such conditions, it will apply
variances like material price variance and material usage variances. If the company is performing
cost management, it will check all expenses and overheads it is incurring and its application.
Then, it will check variances like overhead variance – variable overhead variance or fixed
overhead variances. To know about the differences in sales targets and the actual sales being
made, company will use sales volume variance, etc.
Question 6
Contribution margin: It is used to determine a product's price by taking into account all
associated variable costs while total contribution margin of an organisation comprises of all
earning available to it to pay for fixed costs so that it can generate a true picture of profit
(Hartley, 2017).
(a) Contribution: Sales-variable expense
= 3000000-(300000+1387500+150000+127500+60000)
= 3000000-2025000
11
= 975000
or 6.5 per unit (975000/150000)
Break Even point – It is that point of production in accounting where, cost of production
at a level is equal to revenue of that product, being produced at that level (Massy, 2016).
(b) BEP in units: Fixed cost/ contribution per unit
= (525000+240000+90000)/6.5
= 855000/6.5
= 131538 units
(c) Number of units to be sold: Fixed cost+desired profit/contribution per unit
= 855000+180000/6.5
= 159230 Units
(d) Current sales price: 20
reducing by 15%
New sales price: 20-3
= 17
Variable cost per unit: 2025000/150000
= 13.5
Contribution per unit: 17-13.5
= 3.5 per unit
BEP in units: Fixed cost/contribution per unit
= 855000/3.5
= 244285 Units
(e) Old variable cost per unit: 13.5
Change by 2.5 so new variable cost per unit: 16
Selling price per unit: 20
Contribution per unit: 20-16
= 4
12
⊘ This is a preview!⊘
Do you want full access?
Subscribe today to unlock all pages.
Trusted by 1+ million students worldwide
1 out of 14
Related Documents


Your All-in-One AI-Powered Toolkit for Academic Success.
+13062052269
info@desklib.com
Available 24*7 on WhatsApp / Email
![[object Object]](/_next/static/media/star-bottom.7253800d.svg)
Unlock your academic potential
Copyright © 2020–2026 A2Z Services. All Rights Reserved. Developed and managed by ZUCOL.