University Microeconomics Assignment: Detailed Analysis and Solutions
VerifiedAdded on 2019/10/31
|8
|961
|120
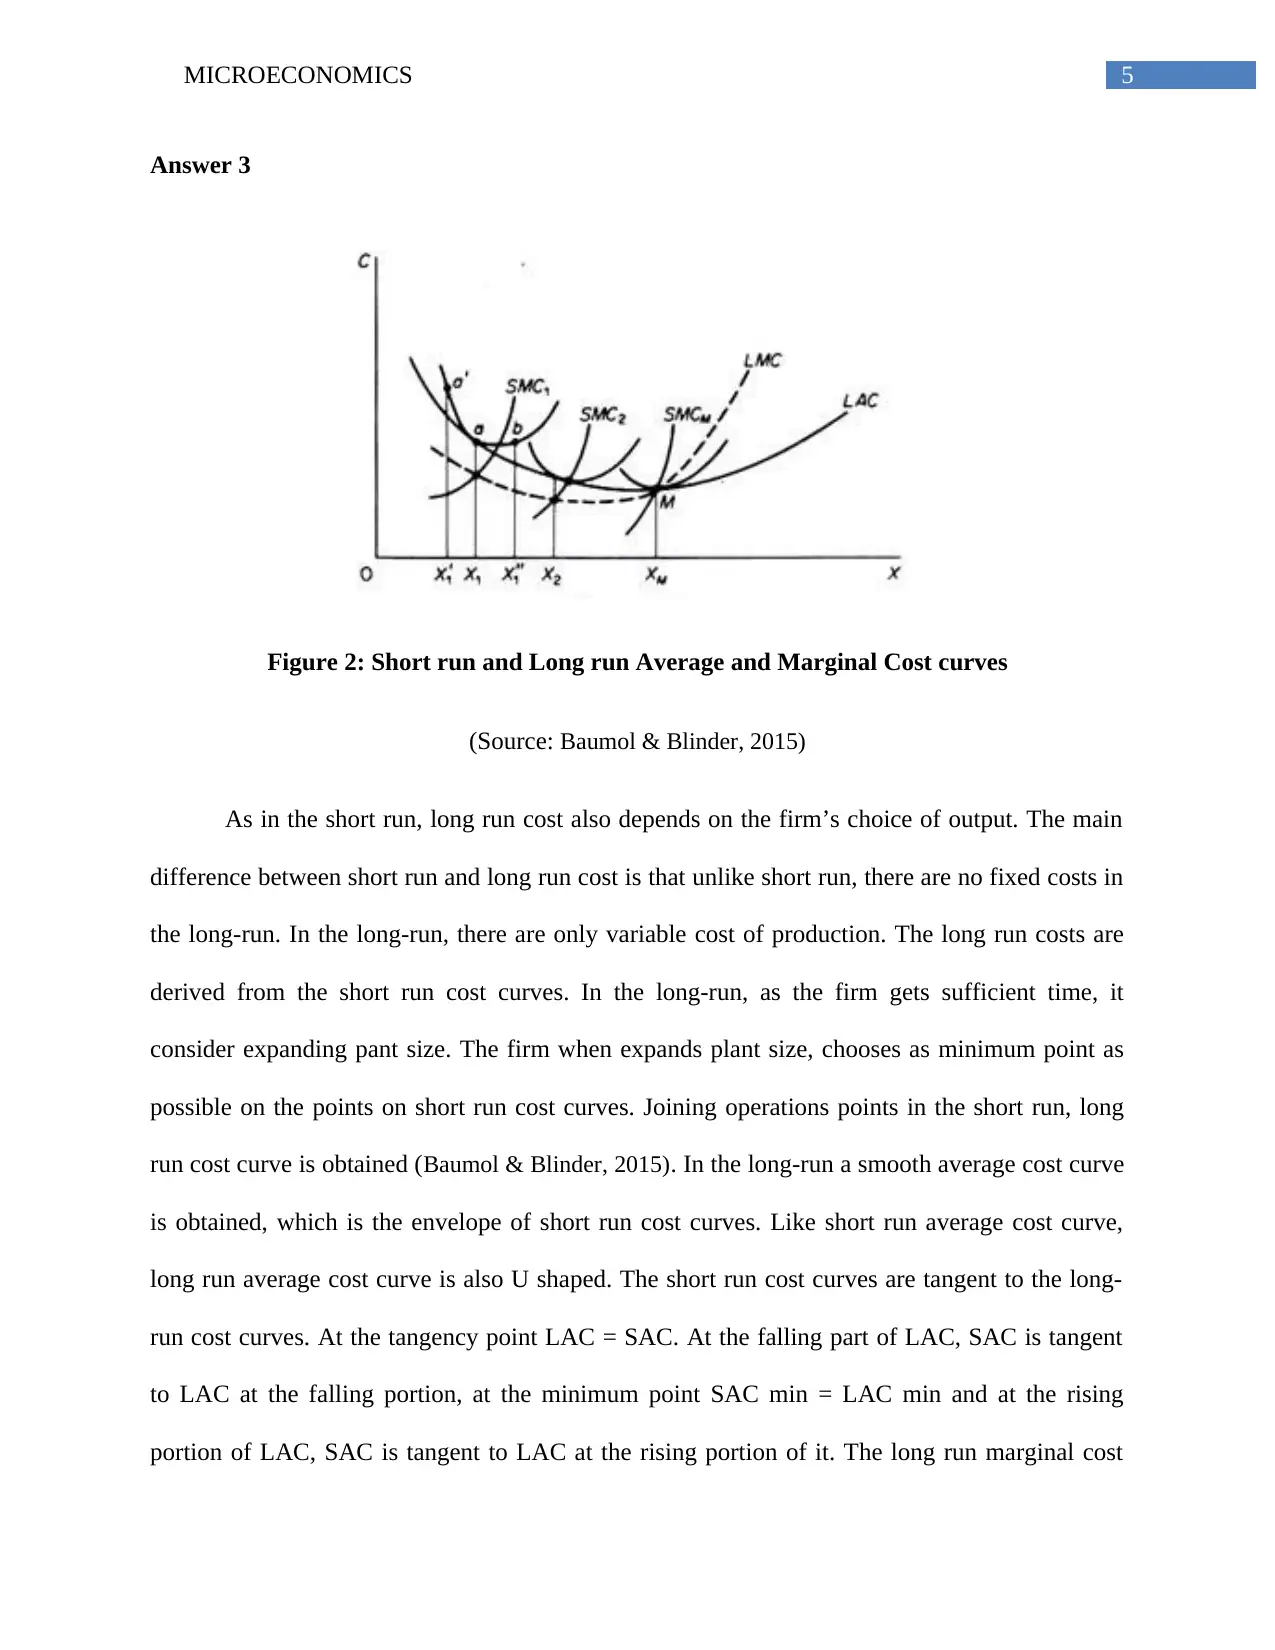
Homework Assignment
AI Summary
This document presents a comprehensive solution to a microeconomics assignment, addressing key concepts such as consumer behavior, demand curves, and cost analysis. The solution delves into topics including the identification of preferred bundles of goods and services, the analysis of perfect substitutes, and the graphical representation of indifference curves. It also explores short-run and long-run cost curves, illustrating the relationship between average and marginal costs. Furthermore, the assignment investigates marginal utility and the marginal rate of substitution, providing a thorough understanding of economic principles. The document includes figures to visually represent key concepts and references relevant economic literature.
1 out of 8
Related Documents


Your All-in-One AI-Powered Toolkit for Academic Success.
+13062052269
info@desklib.com
Available 24*7 on WhatsApp / Email
![[object Object]](/_next/static/media/star-bottom.7253800d.svg)
Copyright © 2020–2026 A2Z Services. All Rights Reserved. Developed and managed by ZUCOL.