University Portfolio Management and Investment Report

Verified

Added on  2021/04/21

|7
|656
|111
Report
AI Summary
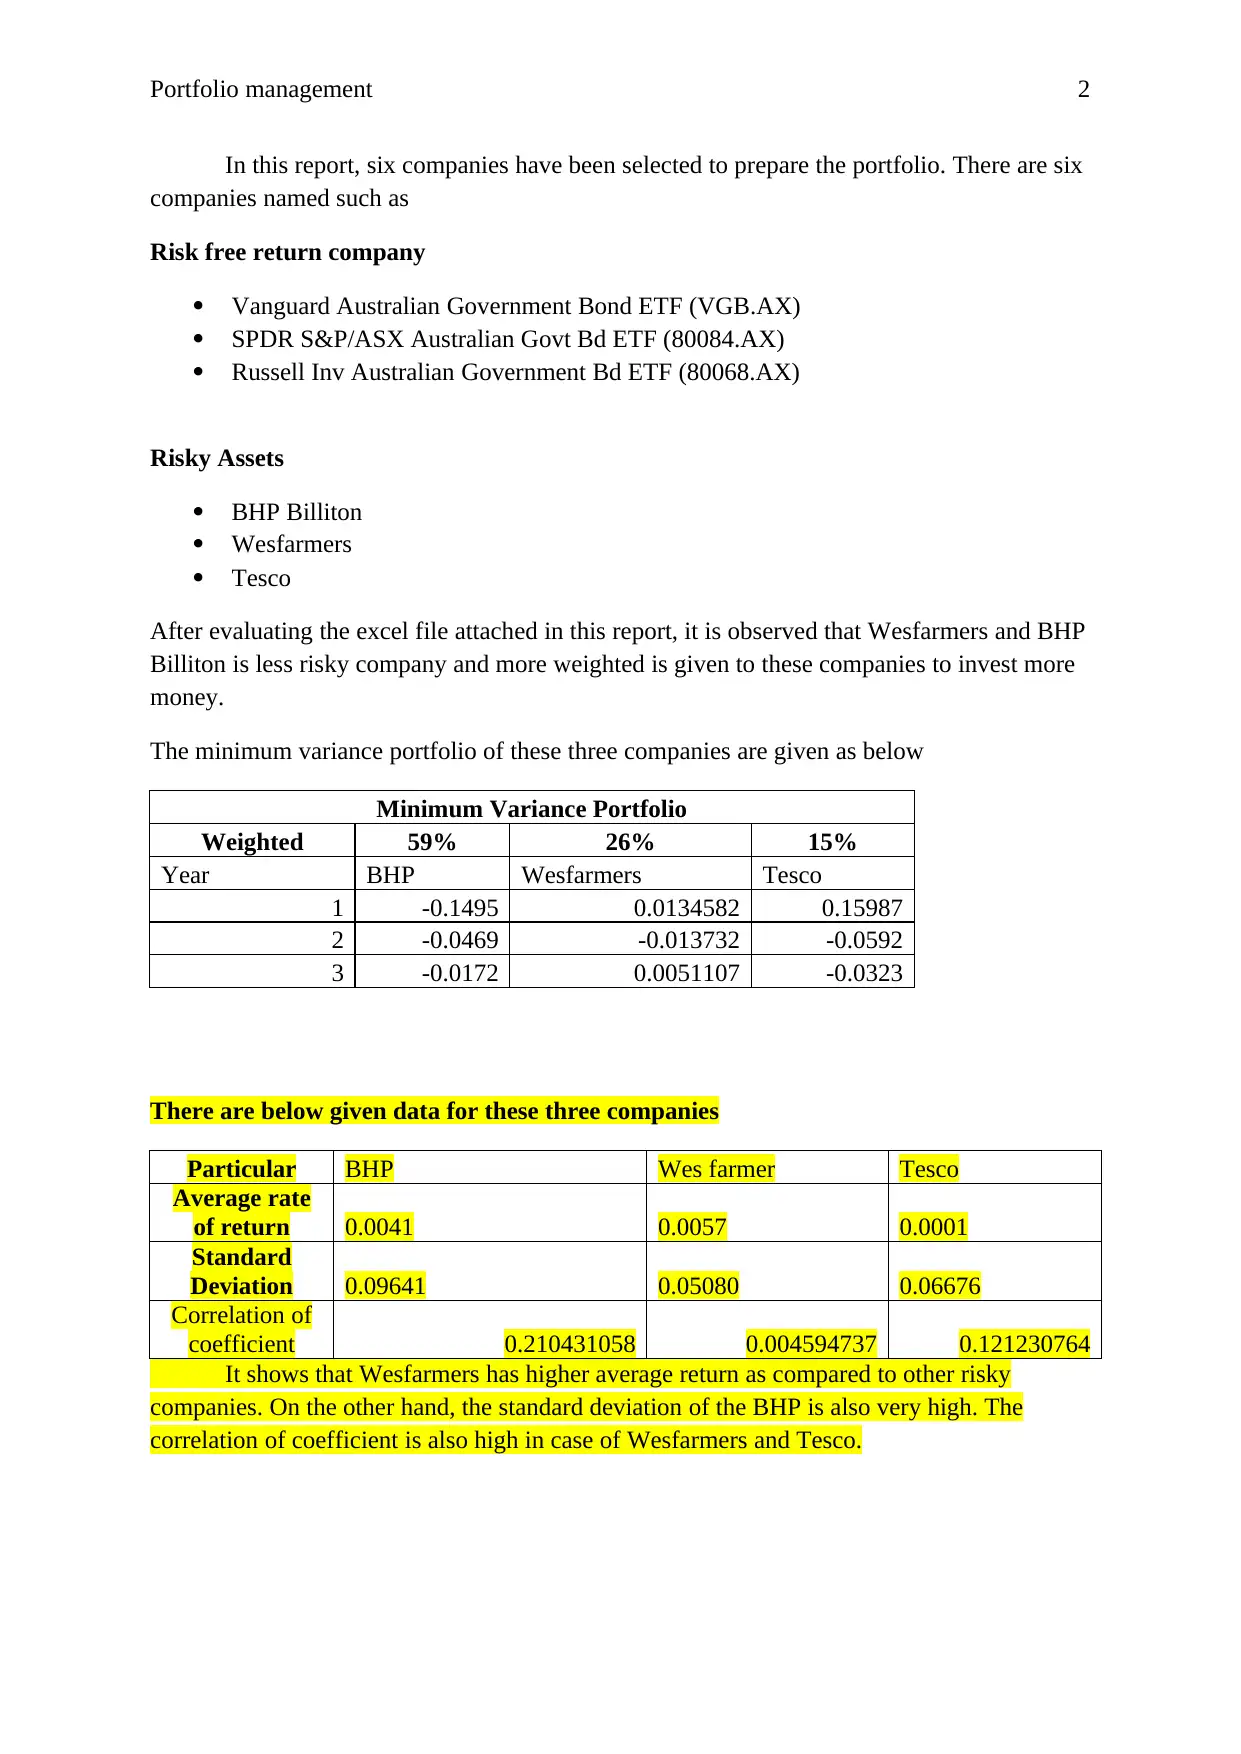
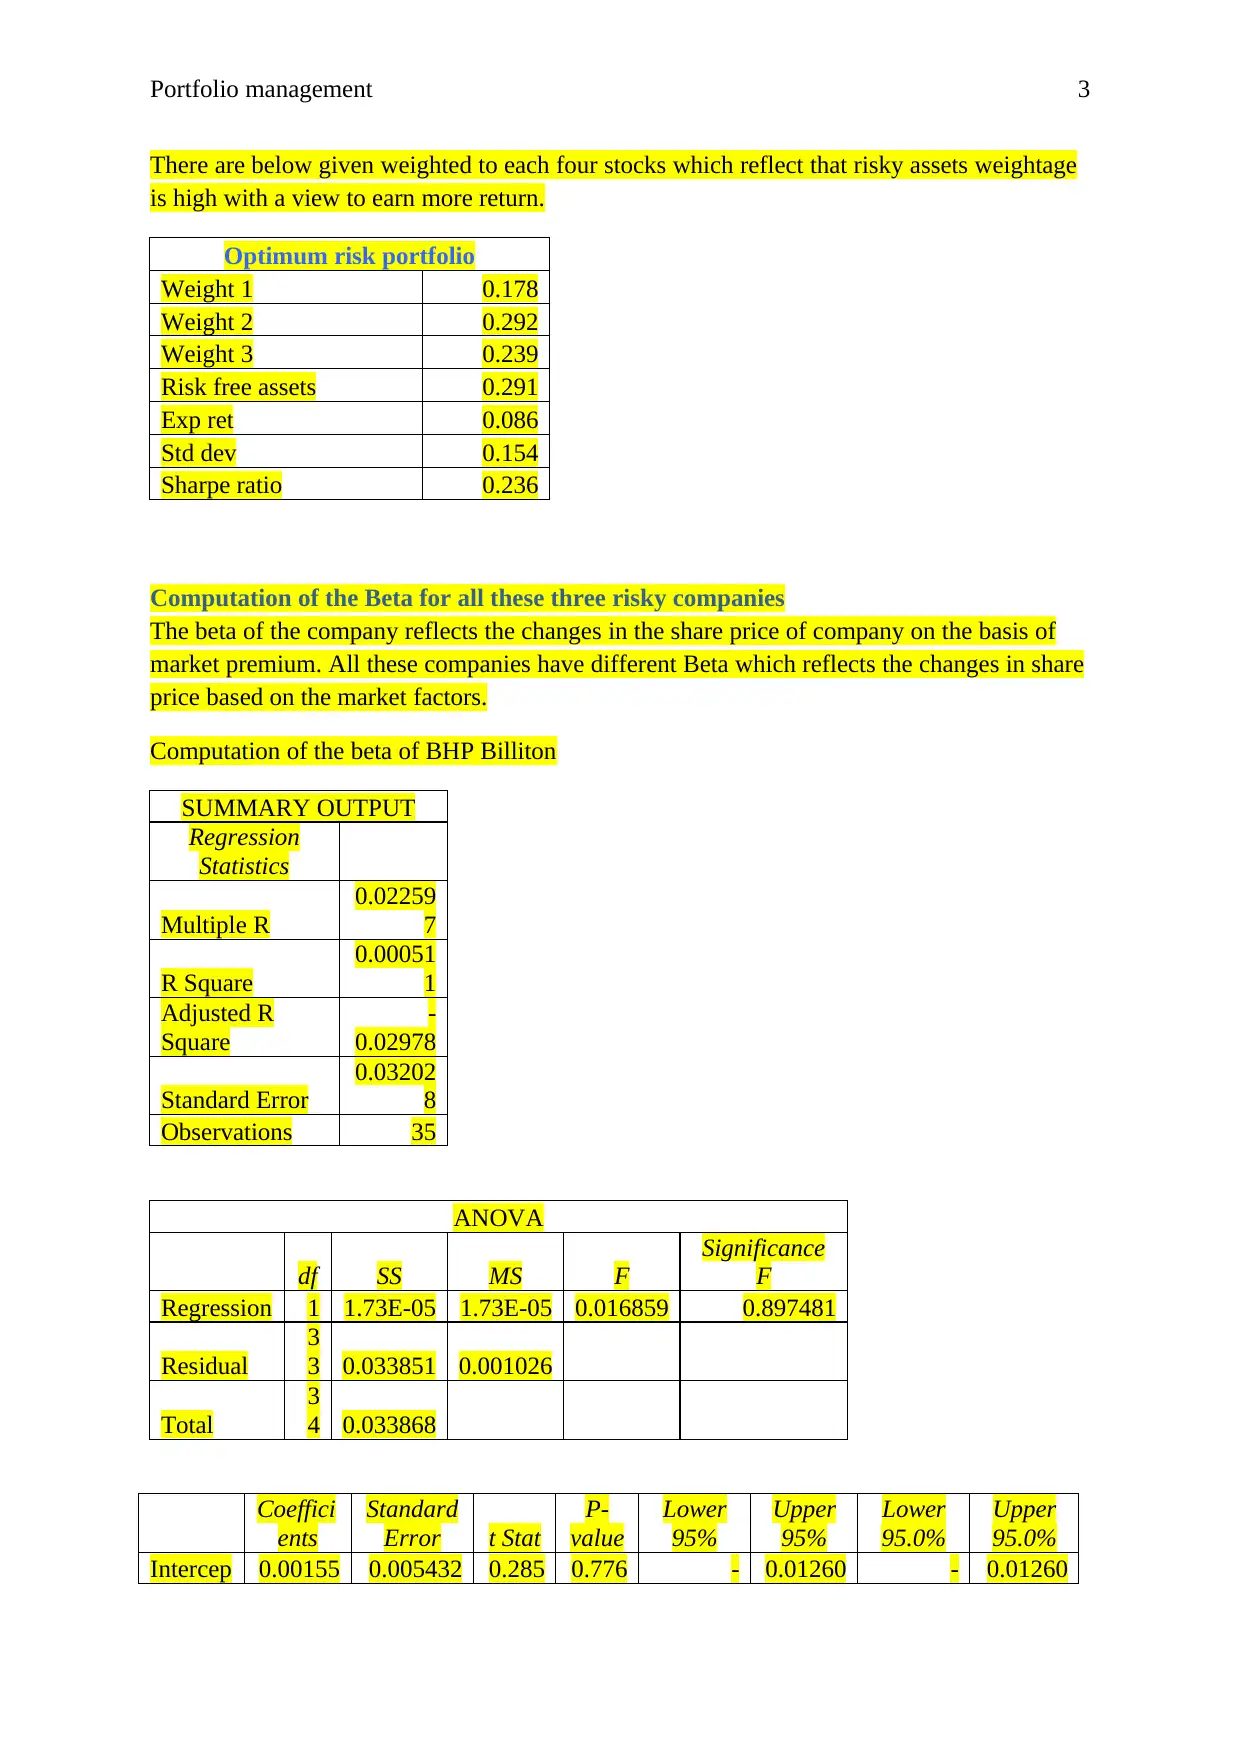
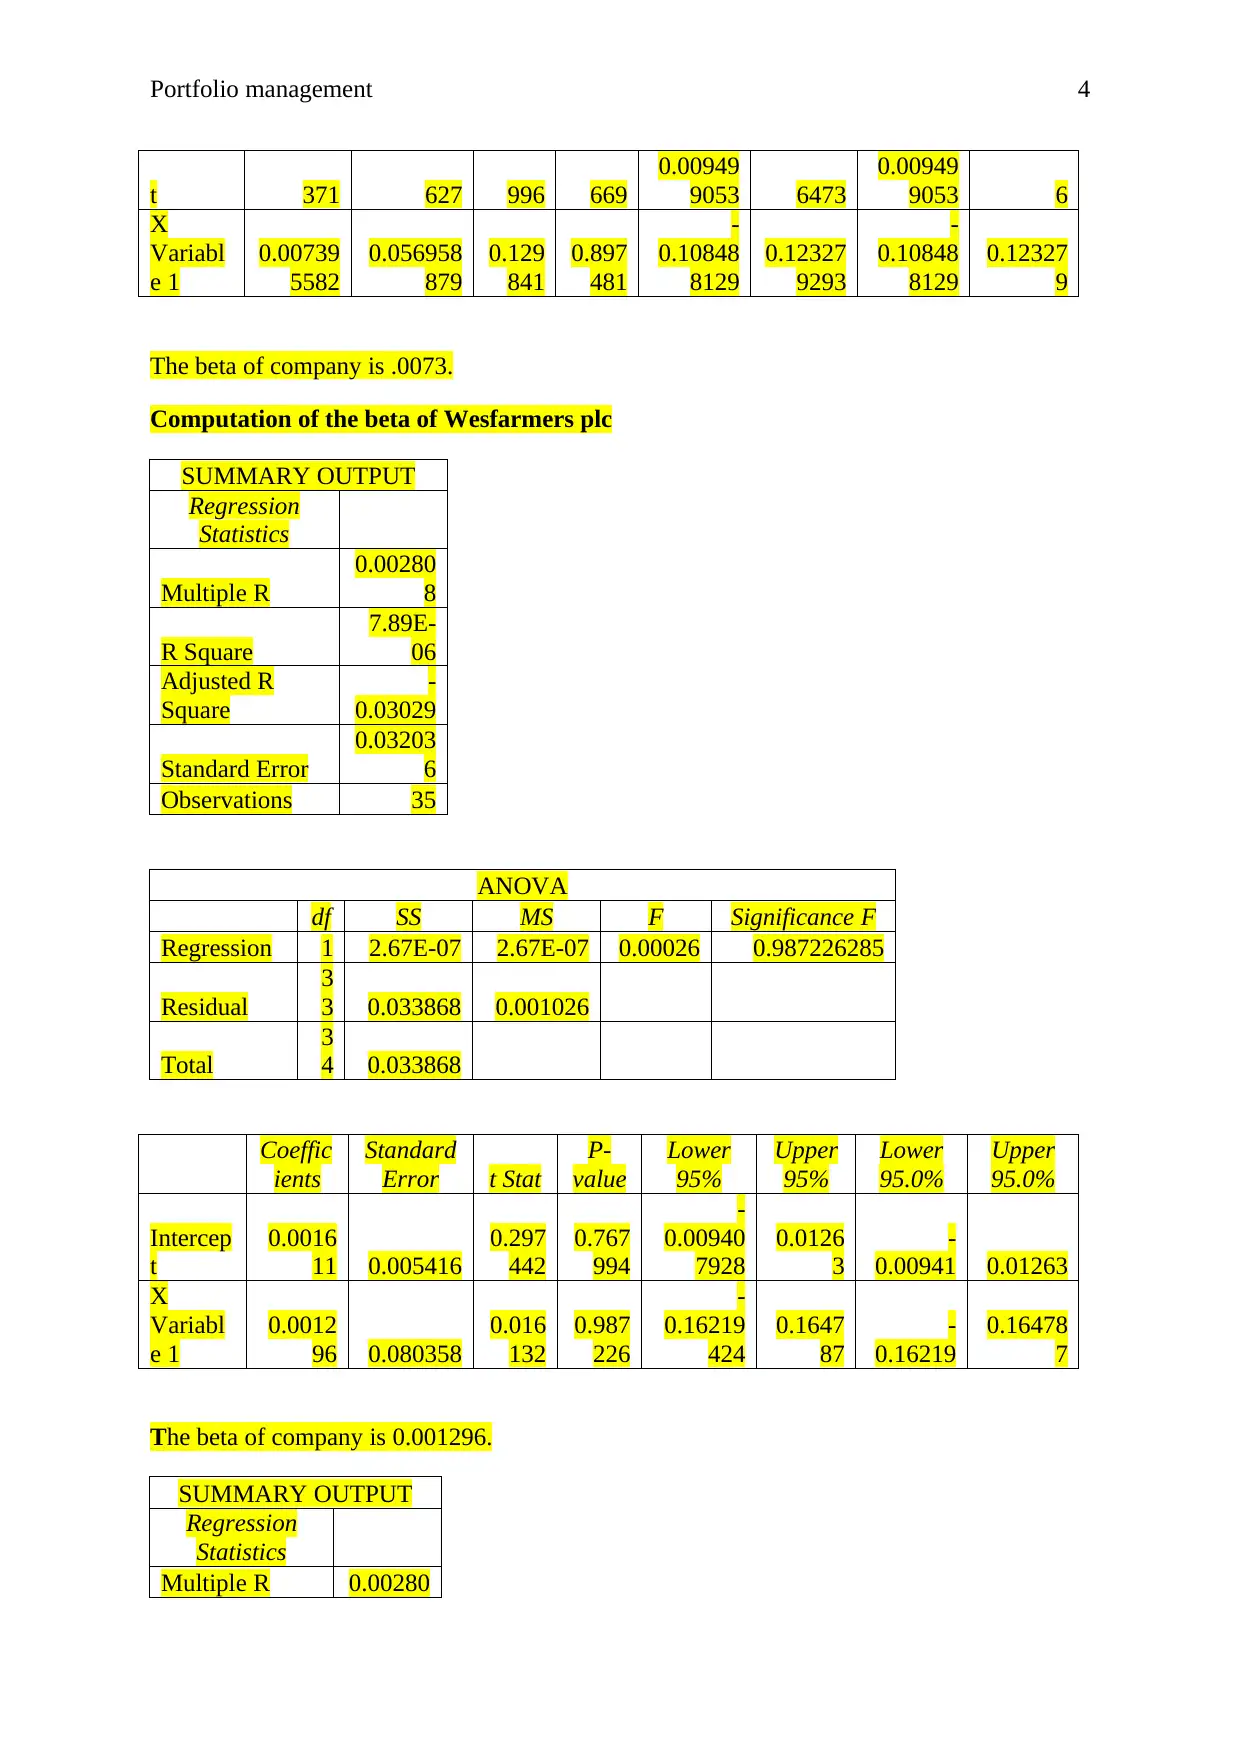
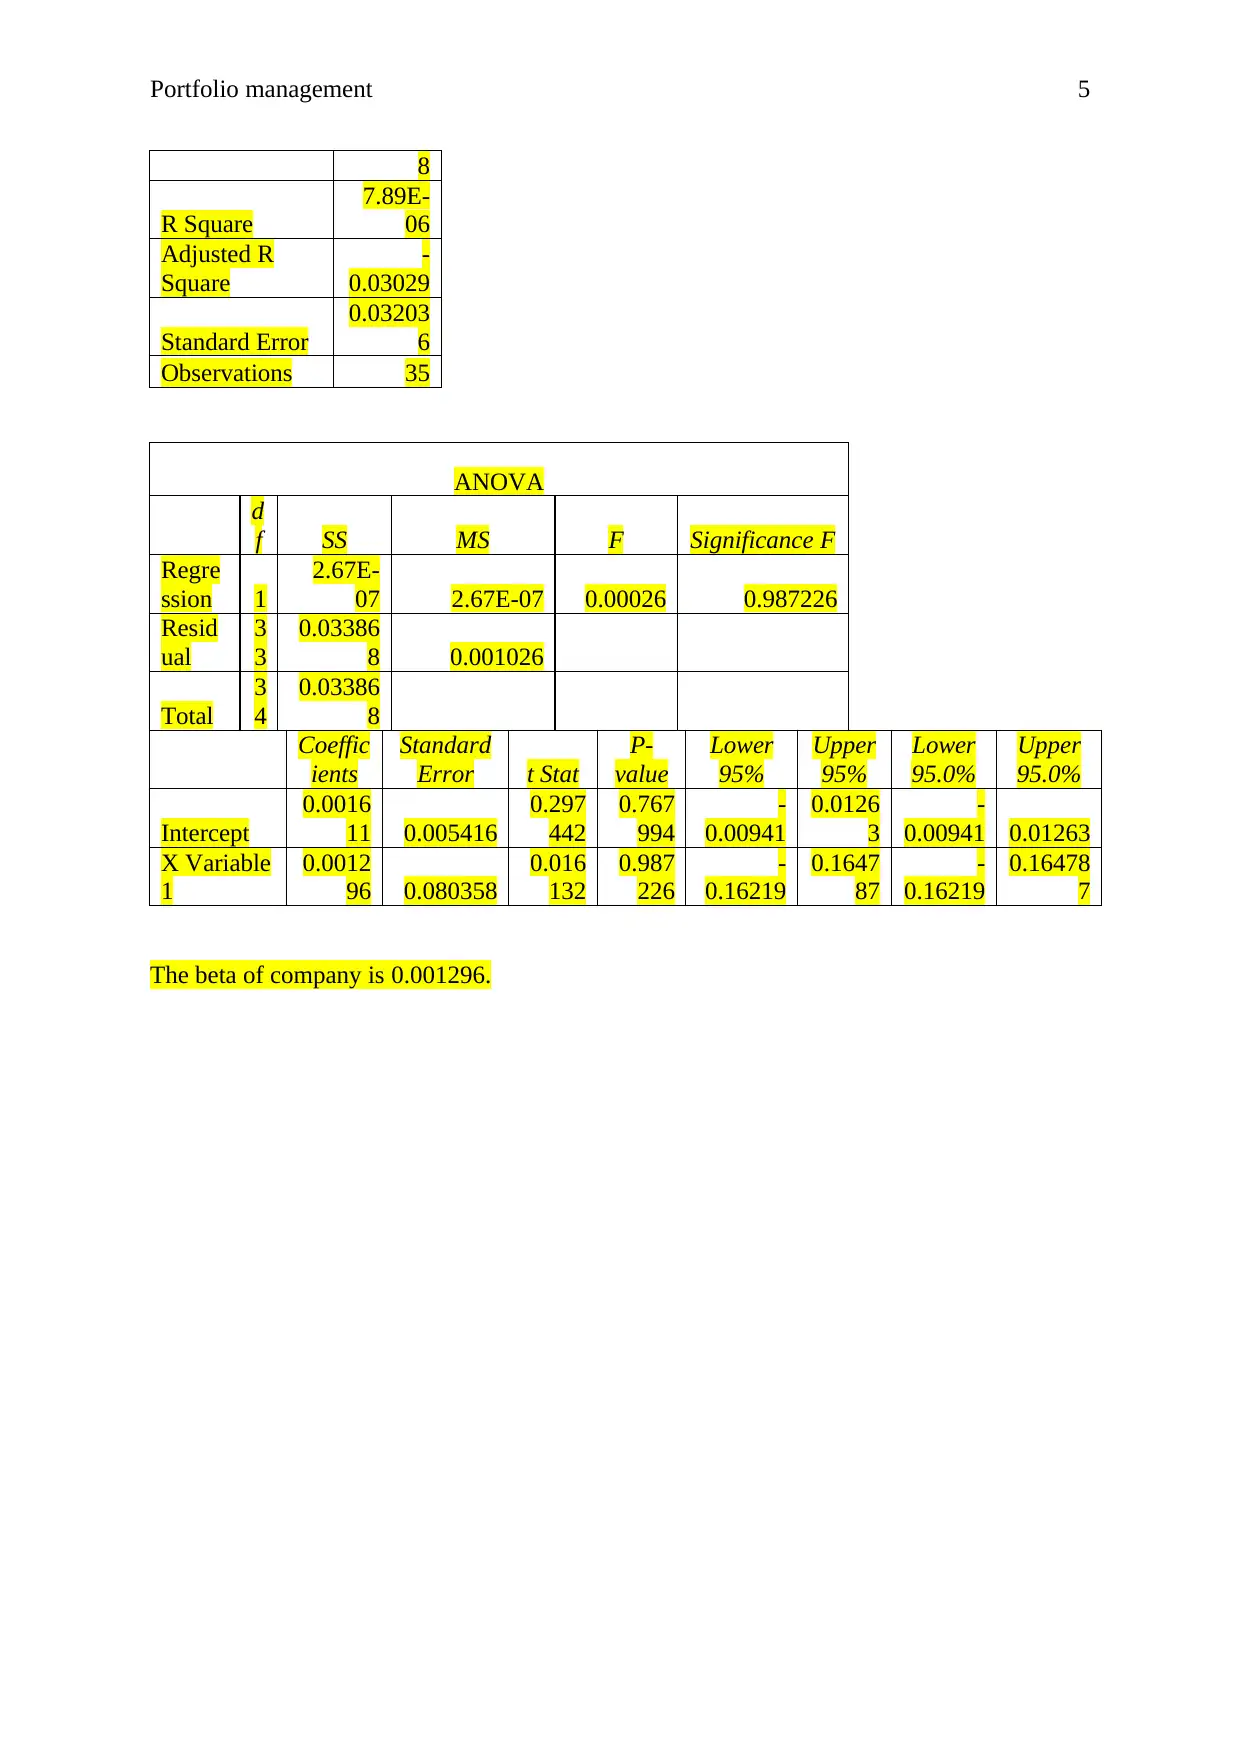
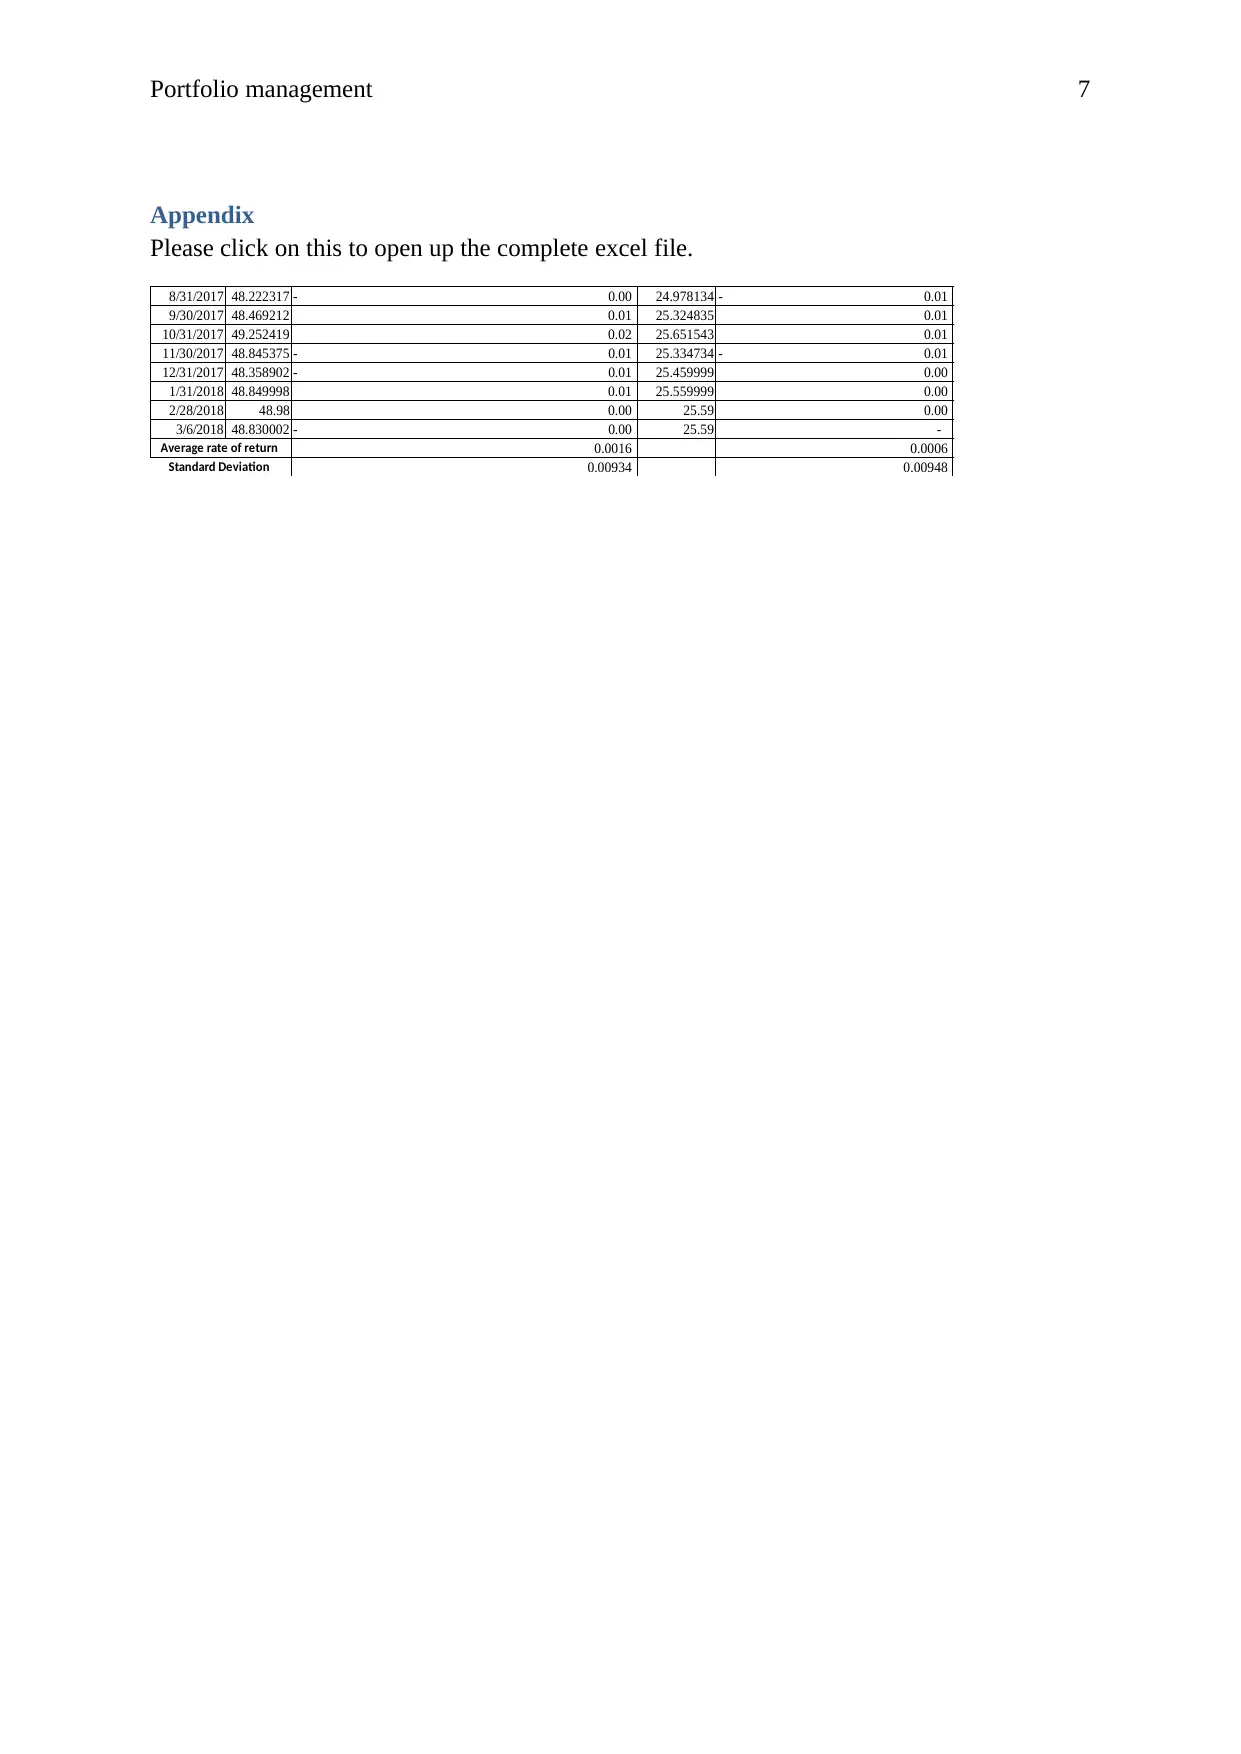
This report, prepared for a university course, analyzes portfolio management strategies using data from six companies, including risk-free assets and risky assets like BHP Billiton, Wesfarmers, and Tesco. The analysis includes calculating the minimum variance portfolio and an optimum risk portfolio, along with the computation of the beta for each risky company. The report highlights Wesfarmers' higher average return compared to other risky companies and discusses the implications of the calculated betas on share price changes based on market factors. The conclusion suggests that the tangency portfolio offers a higher return with a less risky investment plan. The report includes statistical data, correlation coefficients, and Sharpe ratios to support the findings, with an Excel file as an appendix for detailed data.
tabler-icon-diamond-filled.svg

Contribute Materials

Your contribution can guide someone’s learning journey. Share your documents today.
Document Page
RUNNING HEAD: Portfolio management 1
Name of the student
Topic-Portfolio investment
University name
tabler-icon-diamond-filled.svg

Secure Best Marks with AI Grader

Need help grading? Try our AI Grader for instant feedback on your assignments.
Document Page
Portfolio management 2
In this report, six companies have been selected to prepare the portfolio. There are six
companies named such as
Risk free return company
ï‚· Vanguard Australian Government Bond ETF (VGB.AX)
ï‚· SPDR S&P/ASX Australian Govt Bd ETF (80084.AX)
ï‚· Russell Inv Australian Government Bd ETF (80068.AX)
Risky Assets
ï‚· BHP Billiton
ï‚· Wesfarmers
ï‚· Tesco
After evaluating the excel file attached in this report, it is observed that Wesfarmers and BHP
Billiton is less risky company and more weighted is given to these companies to invest more
money.
The minimum variance portfolio of these three companies are given as below
Minimum Variance Portfolio
Weighted 59% 26% 15%
Year BHP Wesfarmers Tesco
1 -0.1495 0.0134582 0.15987
2 -0.0469 -0.013732 -0.0592
3 -0.0172 0.0051107 -0.0323
There are below given data for these three companies
Particular BHP Wes farmer Tesco
Average rate
of return 0.0041 0.0057 0.0001
Standard
Deviation 0.09641 0.05080 0.06676
Correlation of
coefficient 0.210431058 0.004594737 0.121230764
It shows that Wesfarmers has higher average return as compared to other risky
companies. On the other hand, the standard deviation of the BHP is also very high. The
correlation of coefficient is also high in case of Wesfarmers and Tesco.
Document Page
Portfolio management 3
There are below given weighted to each four stocks which reflect that risky assets weightage
is high with a view to earn more return.
Optimum risk portfolio
Weight 1 0.178
Weight 2 0.292
Weight 3 0.239
Risk free assets 0.291
Exp ret 0.086
Std dev 0.154
Sharpe ratio 0.236
Computation of the Beta for all these three risky companies
The beta of the company reflects the changes in the share price of company on the basis of
market premium. All these companies have different Beta which reflects the changes in share
price based on the market factors.
Computation of the beta of BHP Billiton
SUMMARY OUTPUT
Regression
Statistics
Multiple R
0.02259
7
R Square
0.00051
1
Adjusted R
Square
-
0.02978
Standard Error
0.03202
8
Observations 35
ANOVA
df SS MS F
Significance
F
Regression 1 1.73E-05 1.73E-05 0.016859 0.897481
Residual
3
3 0.033851 0.001026
Total
3
4 0.033868
Coeffici
ents
Standard
Error t Stat
P-
value
Lower
95%
Upper
95%
Lower
95.0%
Upper
95.0%
Intercep 0.00155 0.005432 0.285 0.776 - 0.01260 - 0.01260
Document Page
Portfolio management 4
t 371 627 996 669
0.00949
9053 6473
0.00949
9053 6
X
Variabl
e 1
0.00739
5582
0.056958
879
0.129
841
0.897
481
-
0.10848
8129
0.12327
9293
-
0.10848
8129
0.12327
9
The beta of company is .0073.
Computation of the beta of Wesfarmers plc
SUMMARY OUTPUT
Regression
Statistics
Multiple R
0.00280
8
R Square
7.89E-
06
Adjusted R
Square
-
0.03029
Standard Error
0.03203
6
Observations 35
ANOVA
df SS MS F Significance F
Regression 1 2.67E-07 2.67E-07 0.00026 0.987226285
Residual
3
3 0.033868 0.001026
Total
3
4 0.033868
Coeffic
ients
Standard
Error t Stat
P-
value
Lower
95%
Upper
95%
Lower
95.0%
Upper
95.0%
Intercep
t
0.0016
11 0.005416
0.297
442
0.767
994
-
0.00940
7928
0.0126
3
-
0.00941 0.01263
X
Variabl
e 1
0.0012
96 0.080358
0.016
132
0.987
226
-
0.16219
424
0.1647
87
-
0.16219
0.16478
7
The beta of company is 0.001296.
SUMMARY OUTPUT
Regression
Statistics
Multiple R 0.00280
tabler-icon-diamond-filled.svg

Secure Best Marks with AI Grader

Need help grading? Try our AI Grader for instant feedback on your assignments.
Document Page
Portfolio management 5
8
R Square
7.89E-
06
Adjusted R
Square
-
0.03029
Standard Error
0.03203
6
Observations 35
ANOVA
d
f SS MS F Significance F
Regre
ssion 1
2.67E-
07 2.67E-07 0.00026 0.987226
Resid
ual
3
3
0.03386
8 0.001026
Total
3
4
0.03386
8
Coeffic
ients
Standard
Error t Stat
P-
value
Lower
95%
Upper
95%
Lower
95.0%
Upper
95.0%
Intercept
0.0016
11 0.005416
0.297
442
0.767
994
-
0.00941
0.0126
3
-
0.00941 0.01263
X Variable
1
0.0012
96 0.080358
0.016
132
0.987
226
-
0.16219
0.1647
87
-
0.16219
0.16478
7
The beta of company is 0.001296.
Document Page
Portfolio management 6
Conclusion
After evaluating all the details and information on these assets stocks, it is inferred that
Wesfarmers has higher average return as compared to other risky companies but also offers
higher return. On the other hand, above given tangency portfolio reflects higher return less
risky investment plan.
Document Page
Portfolio management 7
Appendix
Please click on this to open up the complete excel file.
8/31/2017 48.222317 - 0.00 24.978134 - 0.01
9/30/2017 48.469212 0.01 25.324835 0.01
10/31/2017 49.252419 0.02 25.651543 0.01
11/30/2017 48.845375 - 0.01 25.334734 - 0.01
12/31/2017 48.358902 - 0.01 25.459999 0.00
1/31/2018 48.849998 0.01 25.559999 0.00
2/28/2018 48.98 0.00 25.59 0.00
3/6/2018 48.830002 - 0.00 25.59 -
Average rate of return 0.0016 0.0006
Standard Deviation 0.00934 0.00948
chevron_up_icon
1 out of 7
circle_padding
hide_on_mobile
zoom_out_icon
logo.png

Your All-in-One AI-Powered Toolkit for Academic Success.

Available 24*7 on WhatsApp / Email

[object Object]