University Research: Data Analysis on Employee Satisfaction at GNBS

Verified

Added on  2023/04/07

|46
|7154
|101
Report
AI Summary
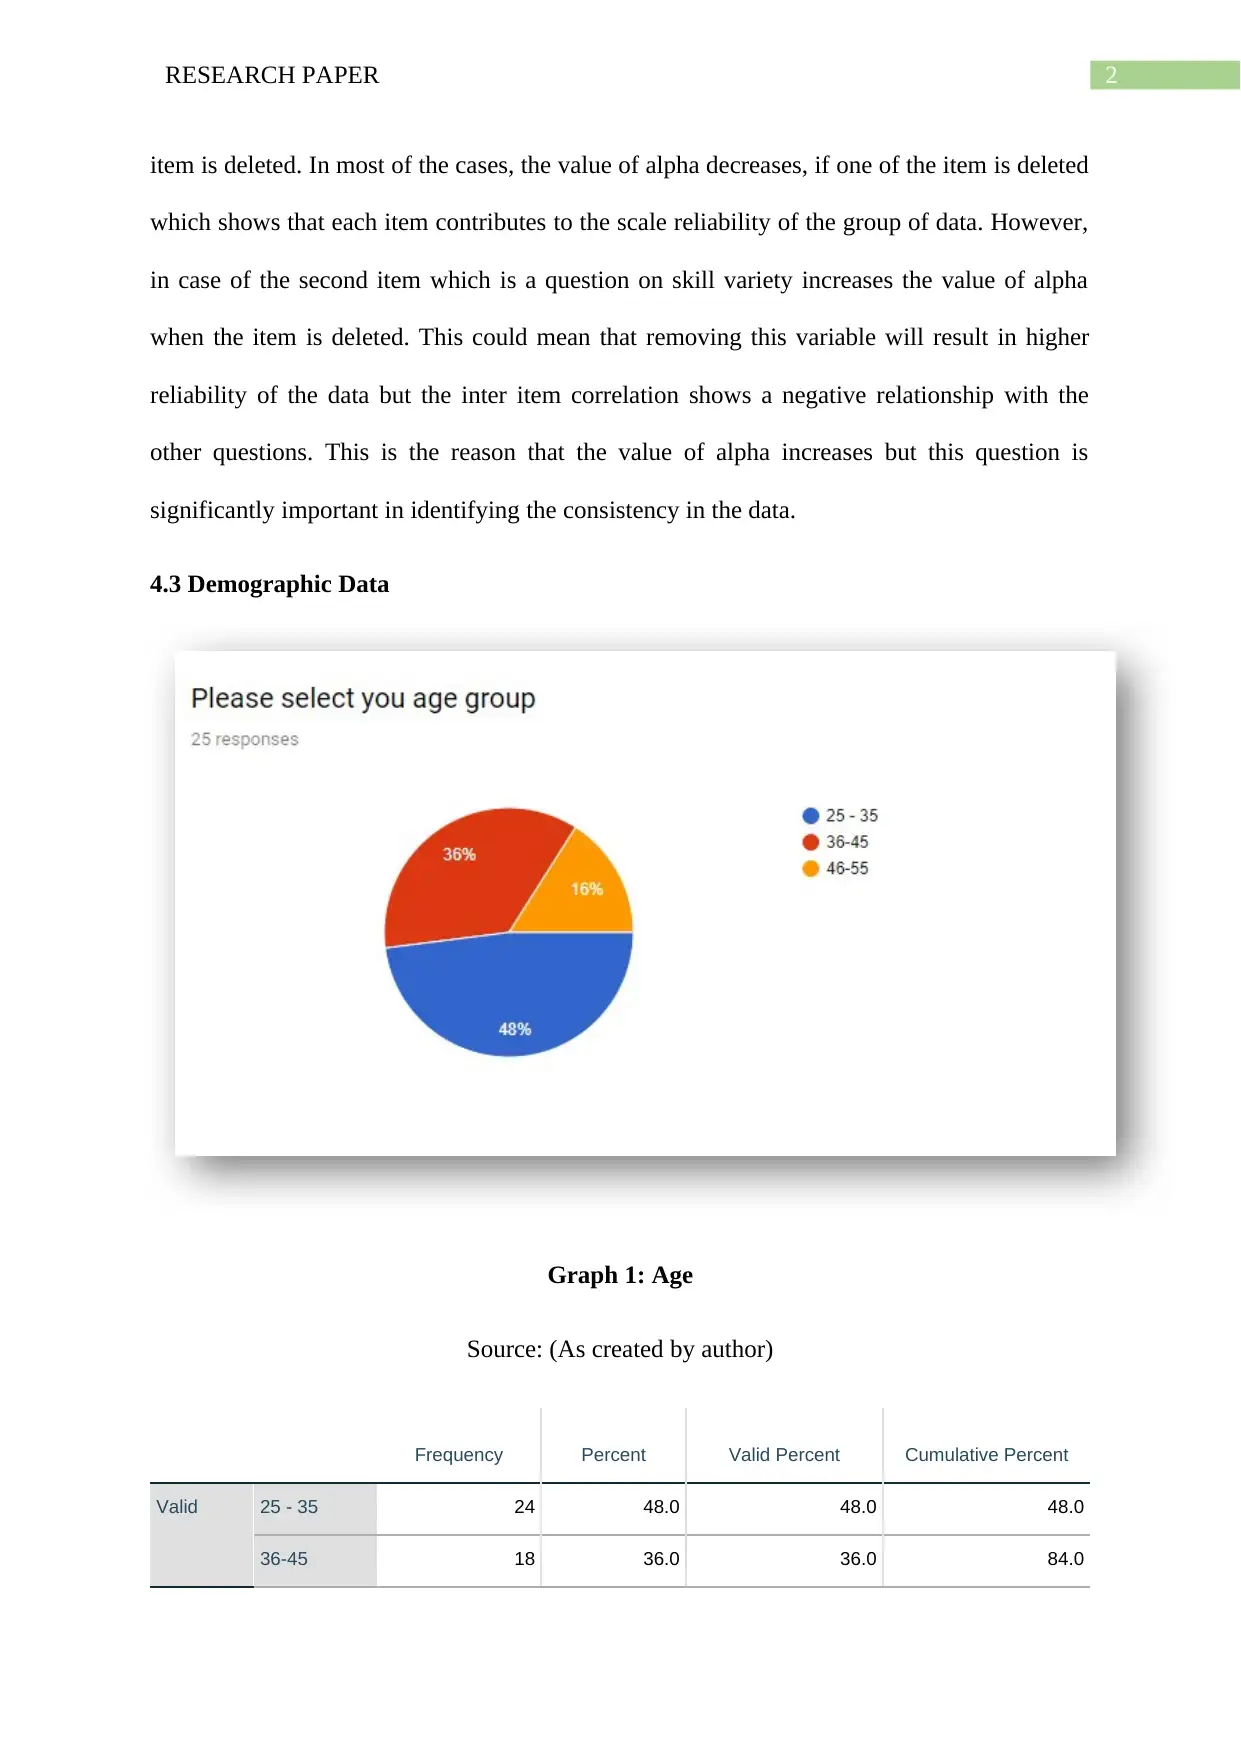
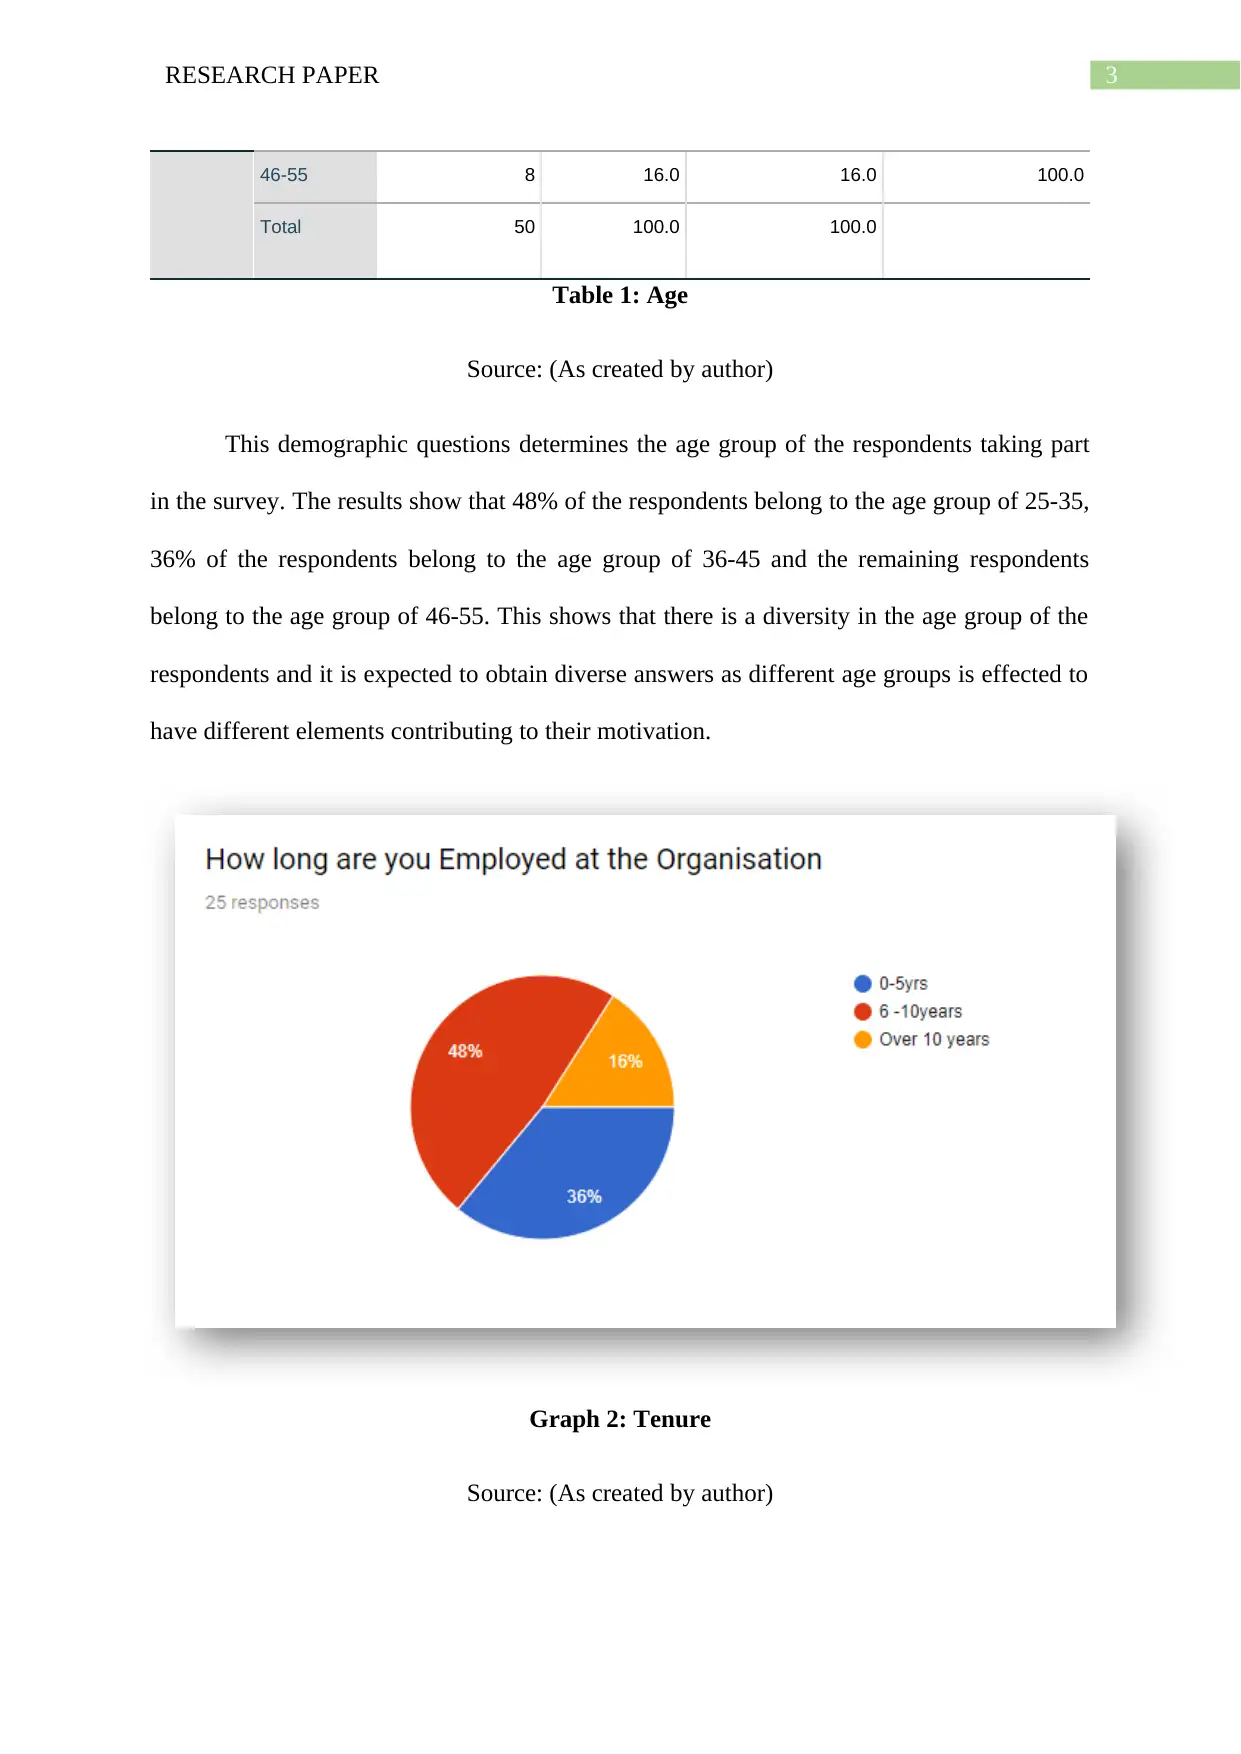
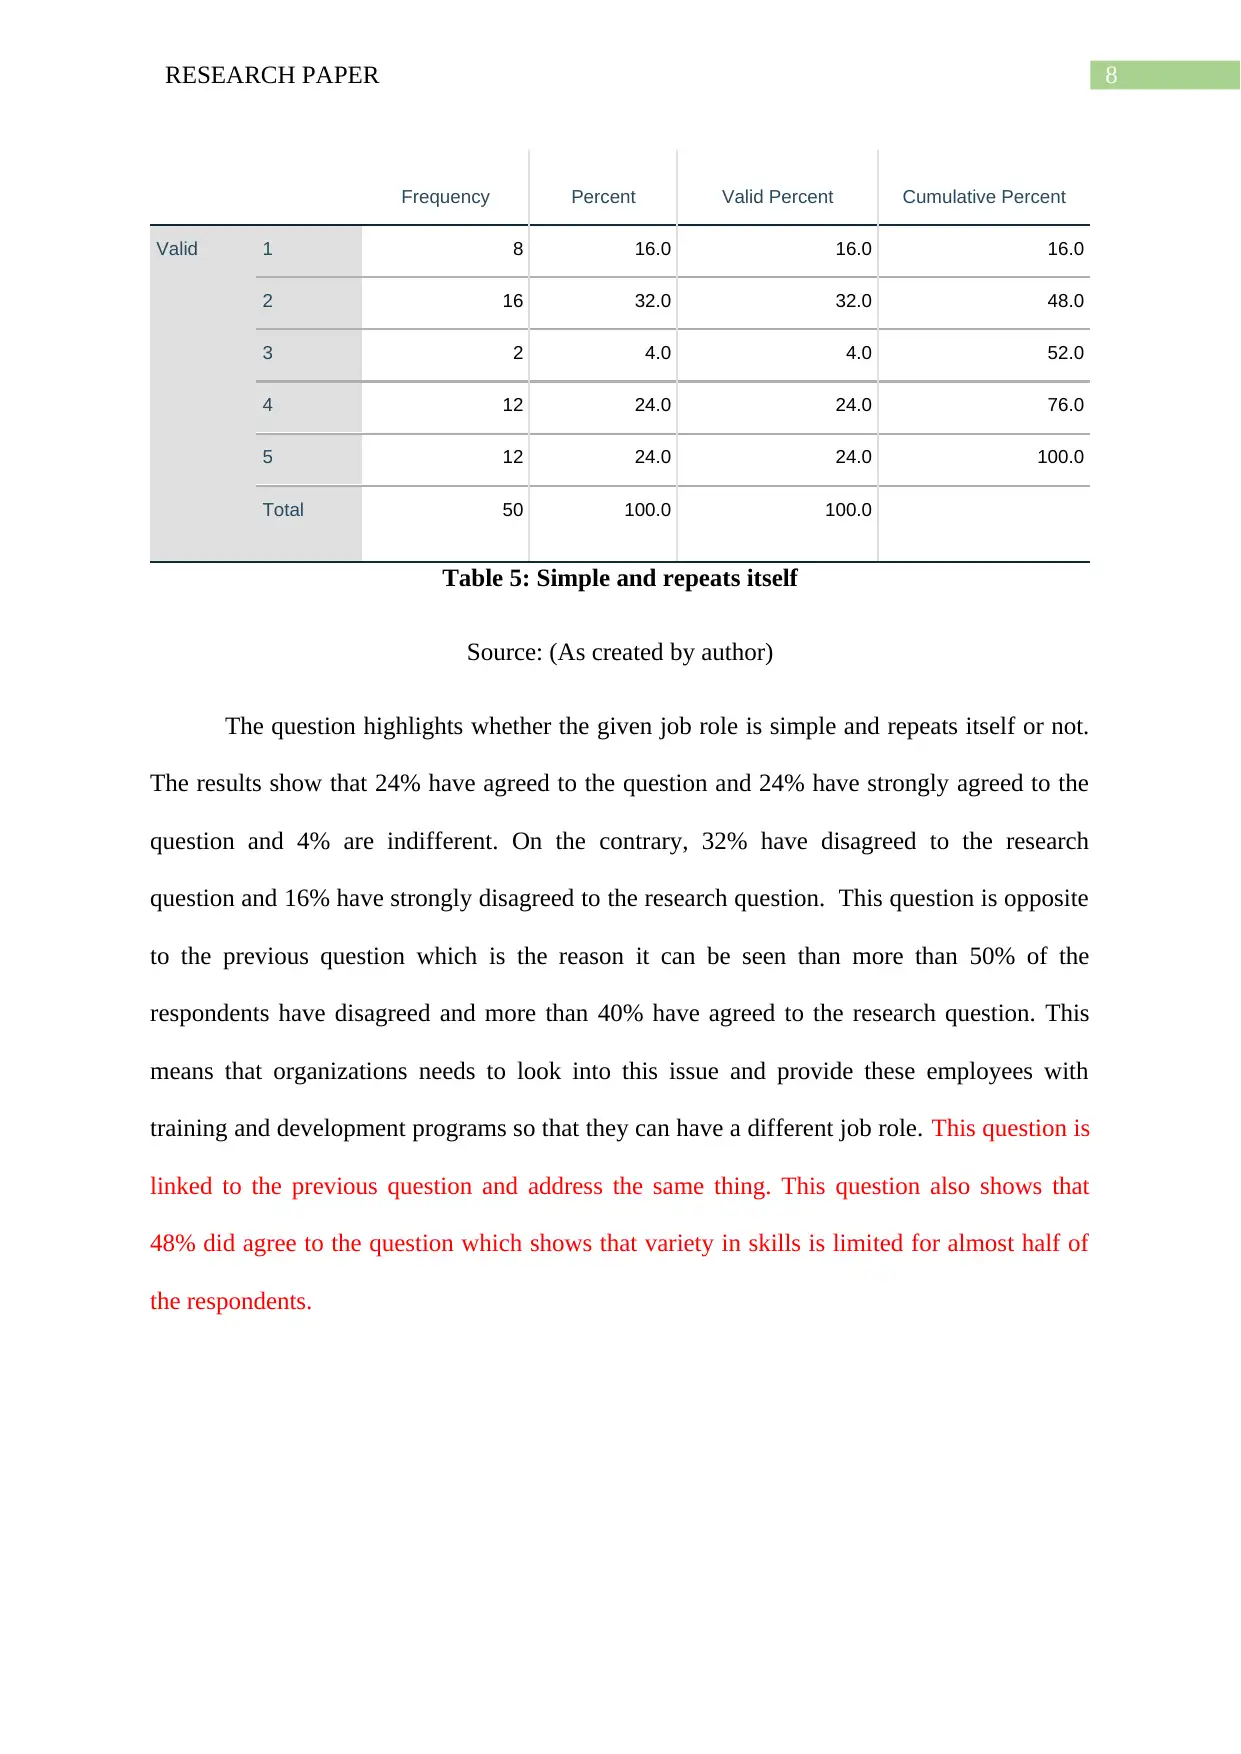
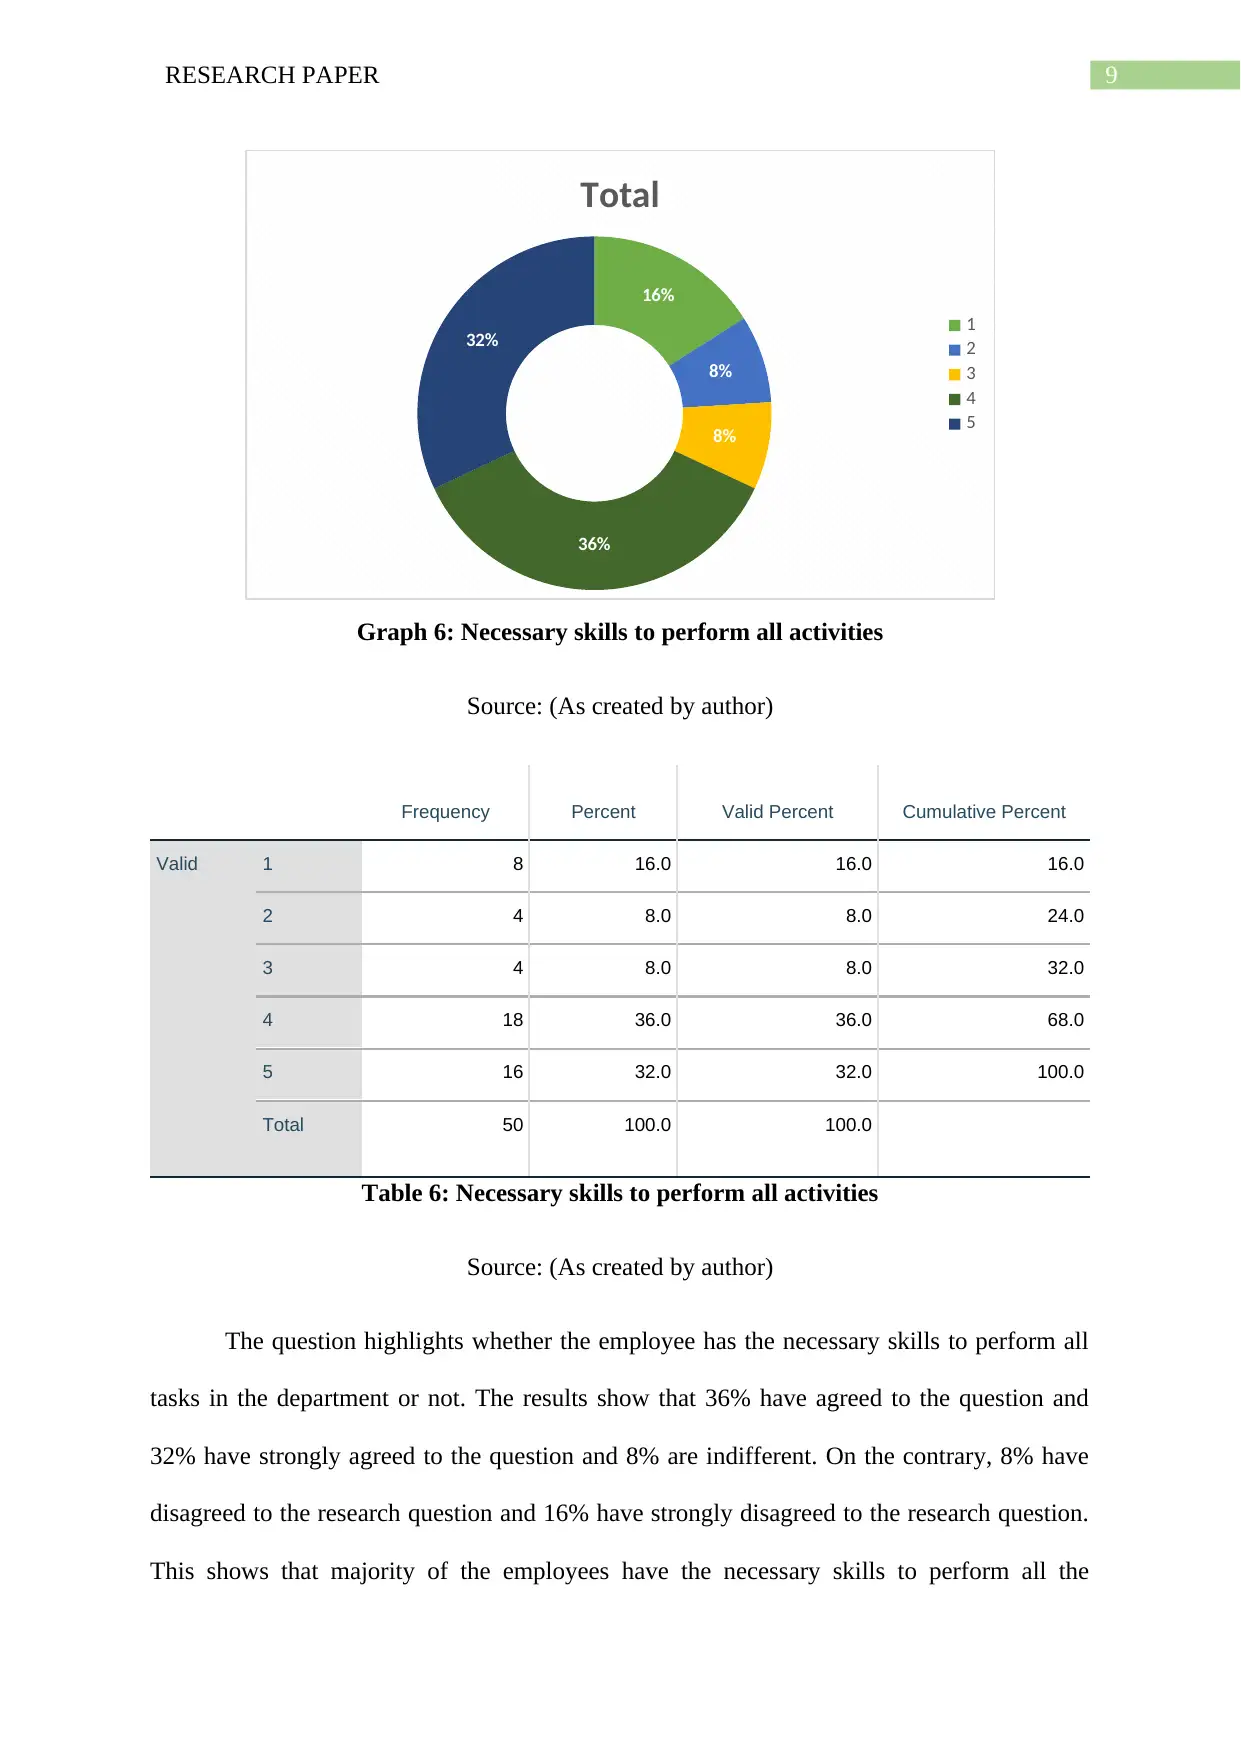
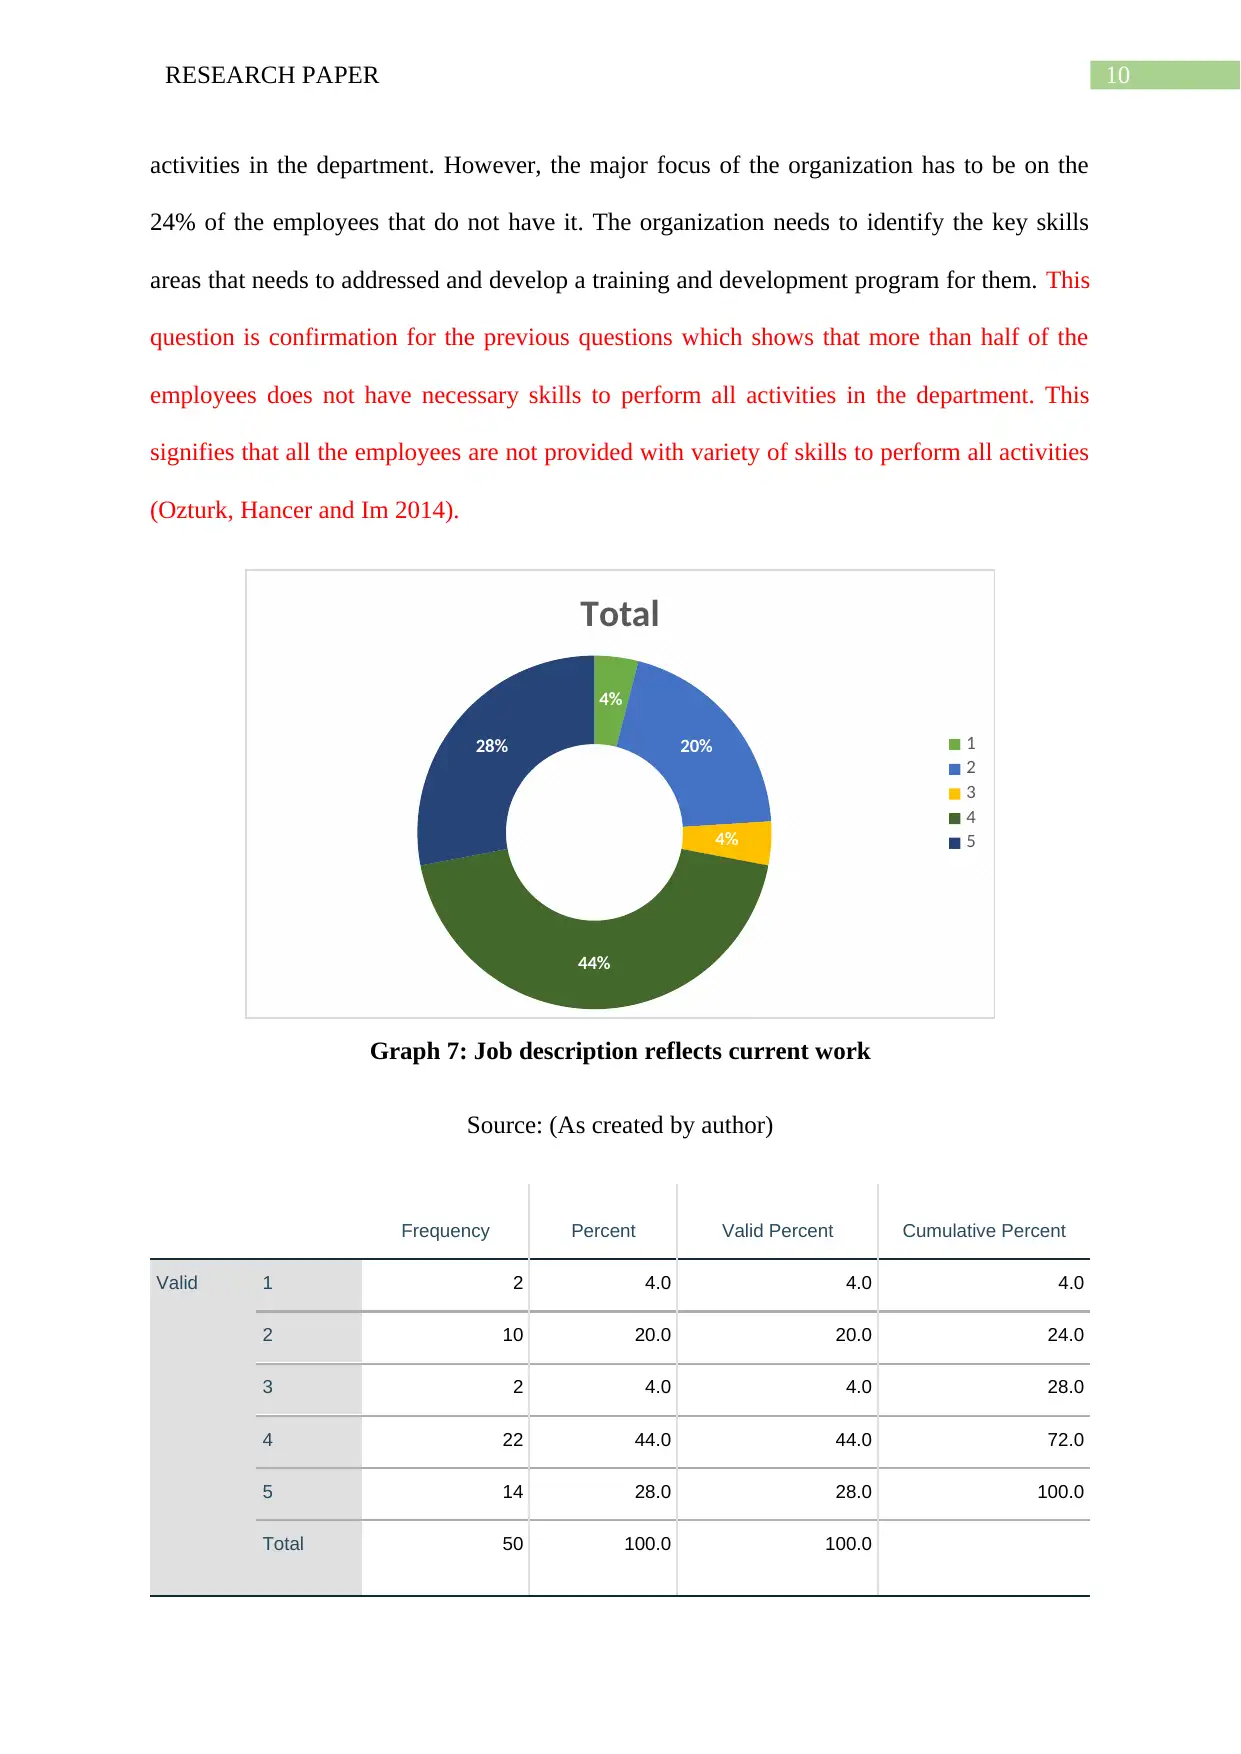
This research paper presents a quantitative data analysis of employee job satisfaction at the Guyana National Bureau of Standards (GNBS), utilizing the Hackman and Oldham's job characteristics model. The study employs a survey questionnaire with a five-point Likert scale, focusing on five key job characteristics. Data was collected from 50 respondents, and reliability analysis was conducted using Cronbach's Alpha, which showed high internal consistency. The demographic data reveals a diverse age group, tenure, and current positions of the respondents. The findings indicate that the majority of employees find their jobs require varied skills and that their job descriptions reflect their current work, although some feel their jobs are simple and repetitive. The research provides insights into the motivating factors at work, highlighting the importance of task identity, skill variety, and autonomy in enhancing employee satisfaction and performance. The analysis includes frequency tables and graphs to illustrate the distribution of responses, offering valuable insights into the job characteristics and their impact on employee motivation within the public sector organization.
Document Page
0RESEARCH PAPER
Data Analysis
Name of the student
Name of the university
Author note
tabler-icon-diamond-filled.svg

Paraphrase This Document

Need a fresh take? Get an instant paraphrase of this document with our AI Paraphraser
Document Page
1RESEARCH PAPER
Chapter 4
Data Findings and Analysis
4.1 Introduction
This chapter in the research have conducted a quantitative analysis based on the
methods selected in the research. The survey questionnaire has been developed on a five
point Likert scale and is based on the Hackman and Oldham’s job characteristics model. This
model facilitated in understanding the factors influencing the job satisfaction of the
employees. The questionnaire consists of the five job characteristics to understand the
motivating factors at work in Guyana National Bureau of Standards (GNBS). A public
organization has been taken in the research which has facilitated in evaluating the job
characteristics and motivating factors for employees in the public sector. Moreover, in this
research, the data has been collected from 25 respondents which is relatively small so the
sampling error in the data is expected to high and results may deviate as it is difficult to
predict human behaviour.
4.2 Reliability Analysis
The reliability analysis of the collected data has been conducted using the Cronbach’s
Alpha test. The Cronbach’s Alpha test measures the internal consistency among the items in
the research and is a measure of scale reliability. It measures how closely related all the items
are as a group. It also states the questions used in the scale are one-dimensional in nature.
When the value of Cronbach’s Alpha is high, it means that the inter item correlation is high.
In general, a value of greater than 0.6 then it is acceptable. In this given research, the value of
Cronbach’s alpha is 0.963 which shows that there is high internal consistency between the
items and the scale reliability of the data is high. By referring to the appendix 1 in the
research, it can be seen that the item total statistics shows the value of alpha when one of the
Document Page
2RESEARCH PAPER
item is deleted. In most of the cases, the value of alpha decreases, if one of the item is deleted
which shows that each item contributes to the scale reliability of the group of data. However,
in case of the second item which is a question on skill variety increases the value of alpha
when the item is deleted. This could mean that removing this variable will result in higher
reliability of the data but the inter item correlation shows a negative relationship with the
other questions. This is the reason that the value of alpha increases but this question is
significantly important in identifying the consistency in the data.
4.3 Demographic Data
Graph 1: Age
Source: (As created by author)
Frequency Percent Valid Percent Cumulative Percent
Valid 25 - 35 24 48.0 48.0 48.0
36-45 18 36.0 36.0 84.0
Document Page
3RESEARCH PAPER
46-55 8 16.0 16.0 100.0
Total 50 100.0 100.0
Table 1: Age
Source: (As created by author)
This demographic questions determines the age group of the respondents taking part
in the survey. The results show that 48% of the respondents belong to the age group of 25-35,
36% of the respondents belong to the age group of 36-45 and the remaining respondents
belong to the age group of 46-55. This shows that there is a diversity in the age group of the
respondents and it is expected to obtain diverse answers as different age groups is effected to
have different elements contributing to their motivation.
Graph 2: Tenure
Source: (As created by author)
tabler-icon-diamond-filled.svg

Paraphrase This Document

Need a fresh take? Get an instant paraphrase of this document with our AI Paraphraser
Document Page
4RESEARCH PAPER
Frequency Percent Valid Percent Cumulative Percent
Valid 0-5yrs 18 36.0 36.0 36.0
6 -10years 24 48.0 48.0 84.0
Over 10 years 8 16.0 16.0 100.0
Total 50 100.0 100.0
Table 2: Tenure
Source: (As created by author)
This questions aims to evaluate the tenure of the respondents in the survey. The
results show that 48% of the employees have been in the organization between 6-10 years,
36% of the respondents have been in the organization between 0-5 years and 16% of the
respondents have been over 10 years. This depicts in the sample population in the survey
which is expected to provide a reliable data.
Document Page
5RESEARCH PAPER
Graph 3: Current position
Source: (As created by author)
Frequency Percent Valid Percent Cumulative Percent
Valid Junior Staff 26 52.0 52.0 52.0
Management Staff 8 16.0 16.0 68.0
Senior Staff 16 32.0 32.0 100.0
Total 50 100.0 100.0
Table 3: Current position
Source: (As created by author)
The question highlighted the current position of the participants within the
organization. The findings show that 52% of the respondents are junior staffs, 32% of the
respondents are senior staffs and the remaining respondents are management staffs. The
opinion of the junior staffs is expected to vary from the senior and the management staffs.
Moreover, the management staffs would have a better understanding of the questions and are
expected to provide key insights. Moreover, the data collected from the junior staffs would
provide a perspective from the lower level of the hierarchy and the issues within the human
resource management strategies.
Document Page
6RESEARCH PAPER
4.4 Data on Employee satisfaction, commitment and performance ( 1-strongly disagree,
2- disagree, 3- indifferent, 4- agree and 5- strongly agree)
12%
32%
4%
24%
28%
Total
1
2
3
4
5
Graph 4: Complex or high skill jobs
Source: (As created by author)
Frequency Percent Valid Percent Cumulative Percent
Valid 1 6 12.0 12.0 12.0
2 16 32.0 32.0 44.0
3 2 4.0 4.0 48.0
4 12 24.0 24.0 72.0
5 14 28.0 28.0 100.0
Total 50 100.0 100.0
Table 4: Complex or high skill jobs
Source: (As created by author)
tabler-icon-diamond-filled.svg

Paraphrase This Document

Need a fresh take? Get an instant paraphrase of this document with our AI Paraphraser
Document Page
7RESEARCH PAPER
The question highlights whether the given job role requires the employee to use a
number of complex skills or not. The results show that 24% have agreed to the question and
28% have strongly agreed to the question and 4% are indifferent. On the contrary, 32% have
disagreed to the research question and 12% have strongly disagreed to the research question.
This shows that more than half of the employees have a varied skills set and they are able to
perform critical tasks. On the other hand, 44% of the respondents have disagreed to the
question which shows that their jobs are simple and boring which decreases their job
satisfaction. In respect to the Hackman & Oldham’s job characteristics model, it states that
quality of the task performed provides greater motivation to all the employees. In this respect,
the majority did not agree to the first statement which means a large section of the employees
perform job that is simple which makes it repetitive and monotonous (Ali et al. 2014). This
shows that even though the organisation has been able to design a better task profile for more
than half of the employees, there are still plenty of employees that are not satisfied with the
level of simplicity of their job role.
16%
32%
4%
24%
24%
Total
1
2
3
4
5
Graph 5: Simple and repeats itself
Source: (As created by author)
Document Page
8RESEARCH PAPER
Frequency Percent Valid Percent Cumulative Percent
Valid 1 8 16.0 16.0 16.0
2 16 32.0 32.0 48.0
3 2 4.0 4.0 52.0
4 12 24.0 24.0 76.0
5 12 24.0 24.0 100.0
Total 50 100.0 100.0
Table 5: Simple and repeats itself
Source: (As created by author)
The question highlights whether the given job role is simple and repeats itself or not.
The results show that 24% have agreed to the question and 24% have strongly agreed to the
question and 4% are indifferent. On the contrary, 32% have disagreed to the research
question and 16% have strongly disagreed to the research question. This question is opposite
to the previous question which is the reason it can be seen than more than 50% of the
respondents have disagreed and more than 40% have agreed to the research question. This
means that organizations needs to look into this issue and provide these employees with
training and development programs so that they can have a different job role. This question is
linked to the previous question and address the same thing. This question also shows that
48% did agree to the question which shows that variety in skills is limited for almost half of
the respondents.
Document Page
9RESEARCH PAPER
16%
8%
8%
36%
32%
Total
1
2
3
4
5
Graph 6: Necessary skills to perform all activities
Source: (As created by author)
Frequency Percent Valid Percent Cumulative Percent
Valid 1 8 16.0 16.0 16.0
2 4 8.0 8.0 24.0
3 4 8.0 8.0 32.0
4 18 36.0 36.0 68.0
5 16 32.0 32.0 100.0
Total 50 100.0 100.0
Table 6: Necessary skills to perform all activities
Source: (As created by author)
The question highlights whether the employee has the necessary skills to perform all
tasks in the department or not. The results show that 36% have agreed to the question and
32% have strongly agreed to the question and 8% are indifferent. On the contrary, 8% have
disagreed to the research question and 16% have strongly disagreed to the research question.
This shows that majority of the employees have the necessary skills to perform all the
tabler-icon-diamond-filled.svg

Paraphrase This Document

Need a fresh take? Get an instant paraphrase of this document with our AI Paraphraser
Document Page
10RESEARCH PAPER
activities in the department. However, the major focus of the organization has to be on the
24% of the employees that do not have it. The organization needs to identify the key skills
areas that needs to addressed and develop a training and development program for them. This
question is confirmation for the previous questions which shows that more than half of the
employees does not have necessary skills to perform all activities in the department. This
signifies that all the employees are not provided with variety of skills to perform all activities
(Ozturk, Hancer and Im 2014).
4%
20%
4%
44%
28%
Total
1
2
3
4
5
Graph 7: Job description reflects current work
Source: (As created by author)
Frequency Percent Valid Percent Cumulative Percent
Valid 1 2 4.0 4.0 4.0
2 10 20.0 20.0 24.0
3 2 4.0 4.0 28.0
4 22 44.0 44.0 72.0
5 14 28.0 28.0 100.0
Total 50 100.0 100.0
Document Page
11RESEARCH PAPER
Table 7: Job description reflects current work
Source: (As created by author)
The question depicts whether the employee’s current job description reflects their
current work or not. The results show that 28% have agreed to the question and 44% have
strongly agreed to the question and 4% are indifferent. On the contrary, 20% have disagreed
to the research question and 4% have strongly disagreed to the research question. This shows
that majority of the employees are working according to their job role description expect the
24% that have disagreed. In terms of task identity, these respondents are not performing a job
that is pleasing to them which is a concern for the business entity. The majority of the
respondents feel that there is no proper disclosure of the job description which means that the
job structure is not clearly defined for majority of the employees. This means that their
current work structure does not properly reflect upon the work done by the employees
(Lăzăroiu 2015).
8%
16%
4%
44%
28%
Total
1
2
3
4
5
Graph 8: Job allows to complete an activity from finish to start
Source: (As created by author)
chevron_up_icon
1 out of 46
circle_padding
hide_on_mobile
zoom_out_icon
[object Object]