Electrical Engineering Circuit Analysis Lab: PSPICE AC Analysis Report

Verified

Added on  2021/10/01

|6
|475
|168
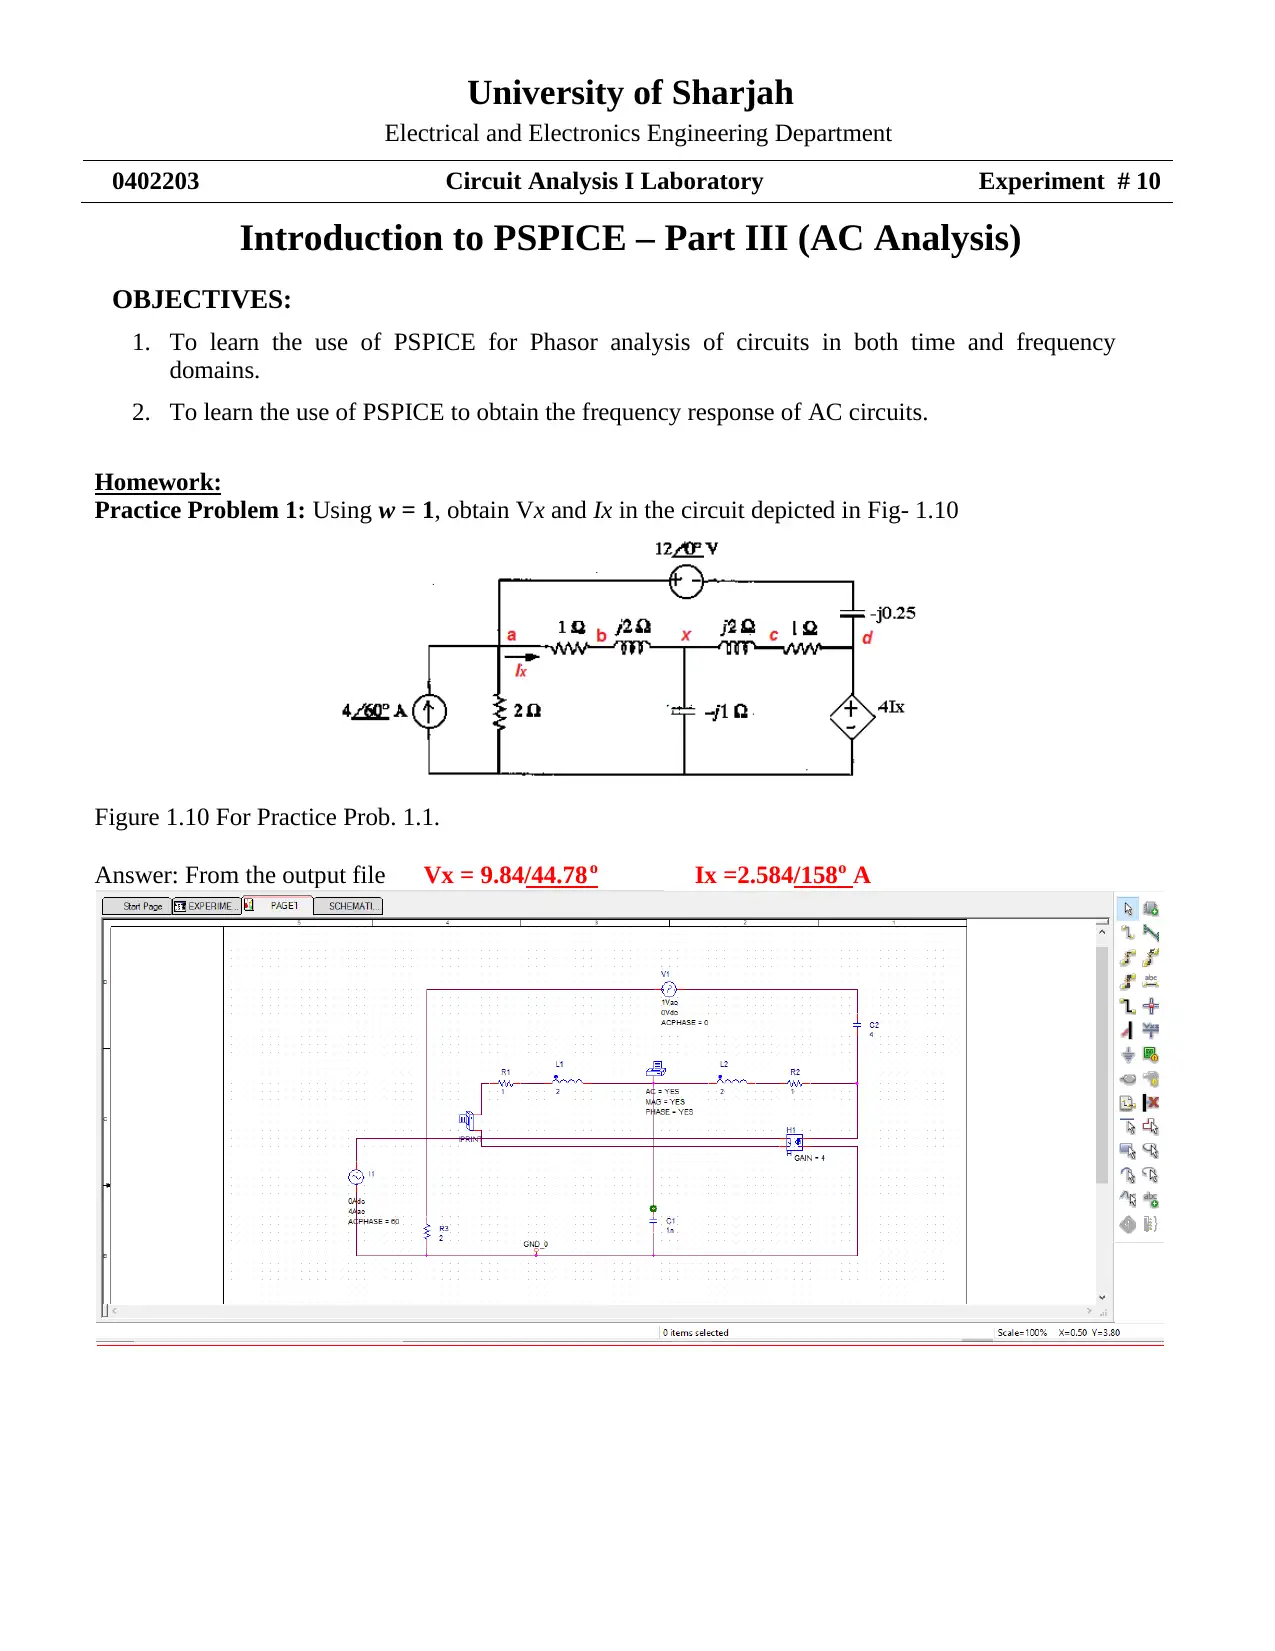
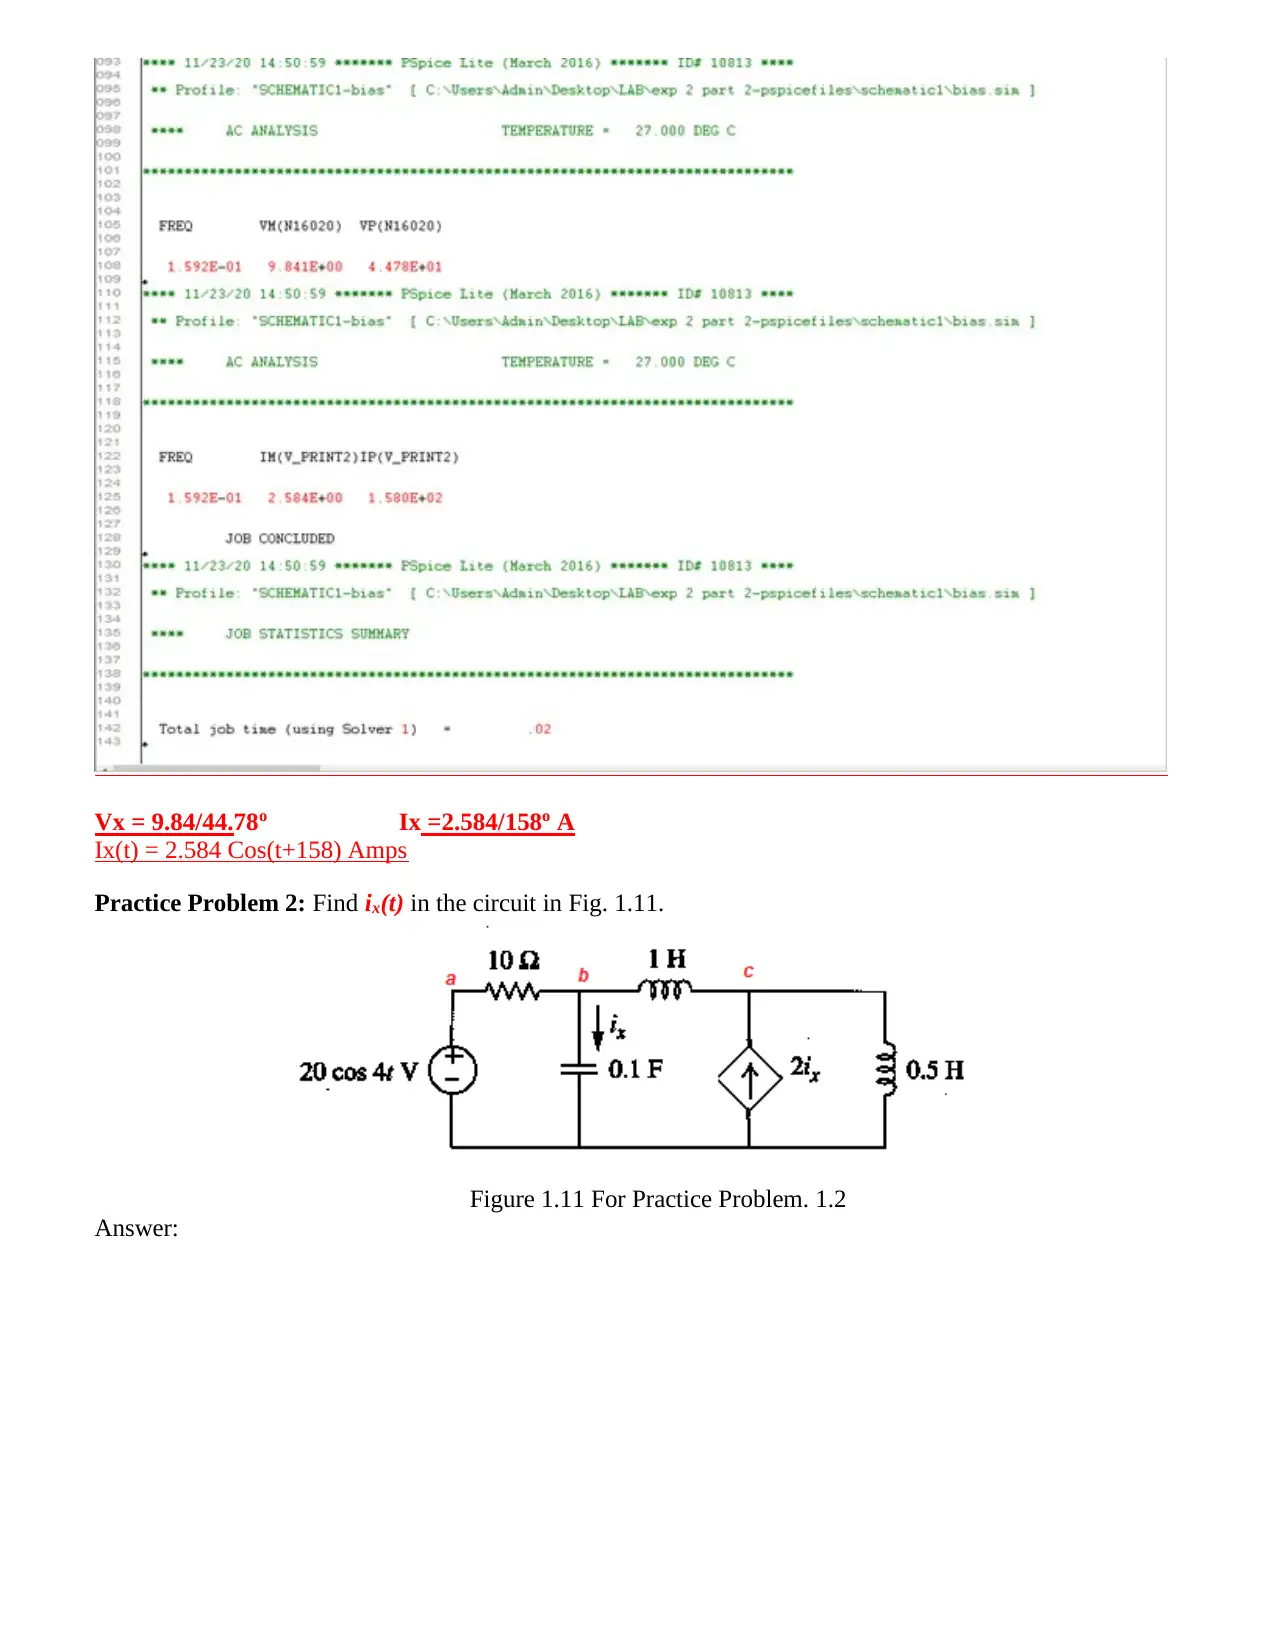
Practical Assignment
AI Summary
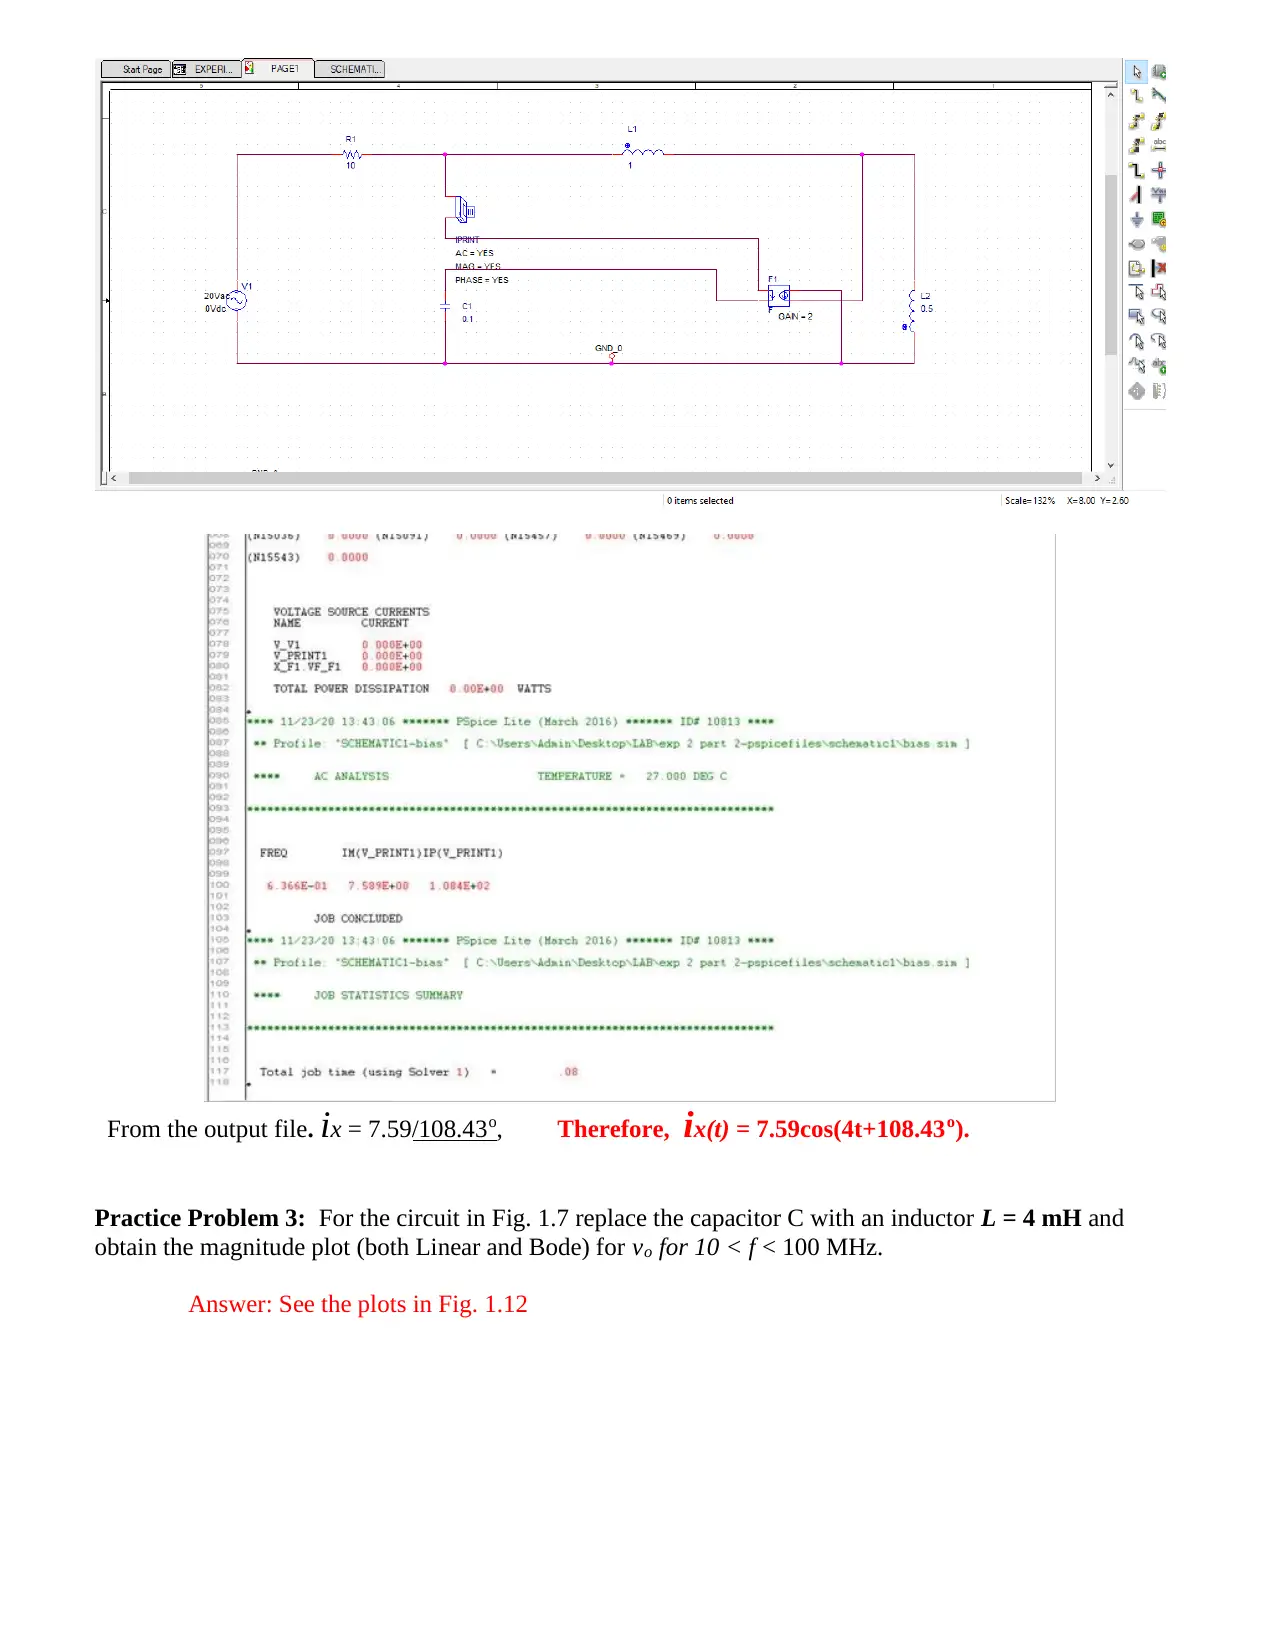
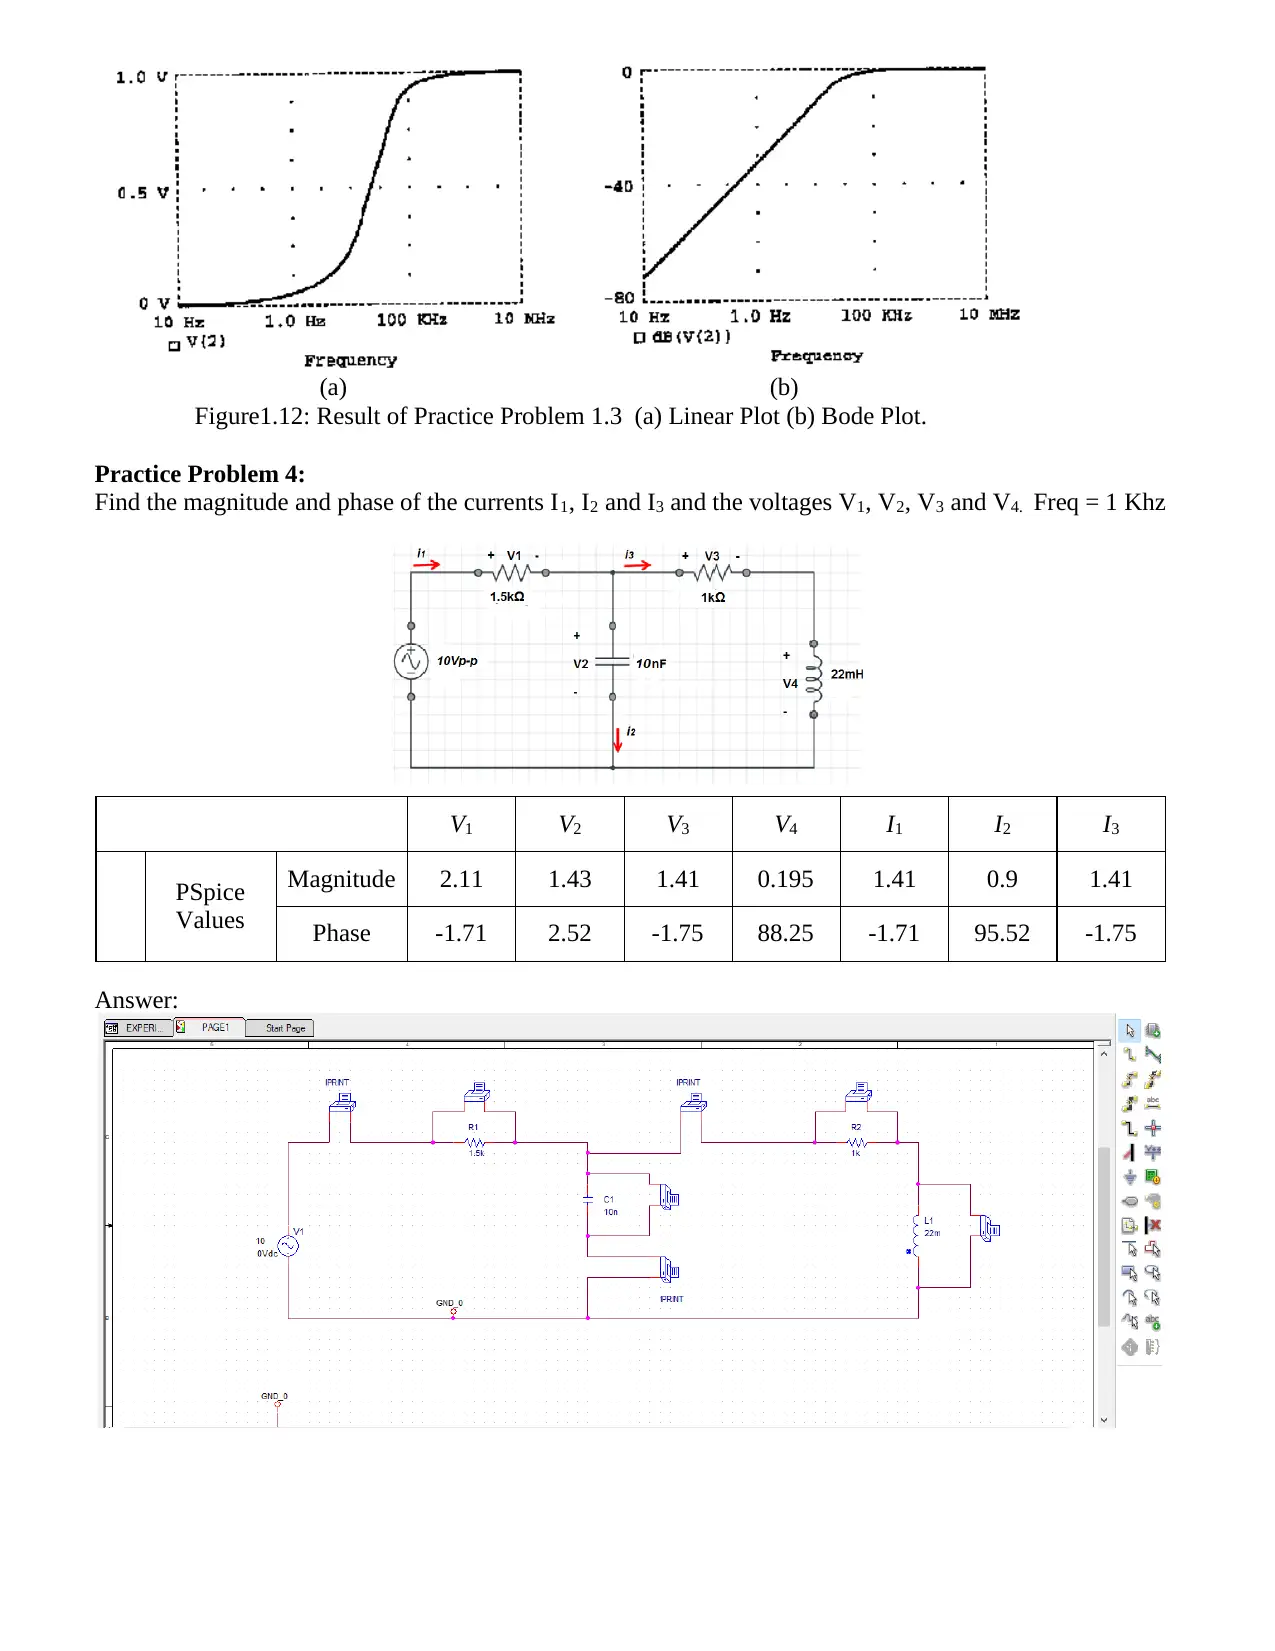
This lab report, conducted at the University of Sharjah's Electrical and Electronics Engineering Department, focuses on the application of PSPICE software for AC circuit analysis. The experiment, titled "Introduction to PSPICE – Part III (AC Analysis)", aims to familiarize students with phasor analysis in both time and frequency domains, and to determine the frequency response of AC circuits. The report includes solutions to homework problems, demonstrating the use of PSPICE to calculate voltages and currents in various circuit configurations, including the determination of magnitude and phase. The report also includes Bode plots and linear plots to visualize frequency response. The conclusion highlights the use of PSPICE for phasor analysis, explaining the measurement of voltage, current, and voltage differences using IPRINT1, VPRINT1, and VPRINT2, along with the utilization of VAC and IAC sources. The experiment provides practical examples of how to use PSPICE to analyze AC circuits.
Document Page
UNIVERSITY OF SHARJAH
COLLEGE OF ENGINEERING
ELECTRICAL ENGINEERING
Course Name: Circuit Analysis Lab 1
Course No:0402203
Lab Title: Introduction to PSPICE – Part III (AC Analysis)
Date Conducted: 22-11-2020
Date of Submission: 26-11-2020
Group Members:
Bader Bilal Adel Alief - U18102761
Abdulla Easa Abdulla Alkulaib Alteneji – U18100014
tabler-icon-diamond-filled.svg

Paraphrase This Document

Need a fresh take? Get an instant paraphrase of this document with our AI Paraphraser
Document Page
University of Sharjah
Electrical and Electronics Engineering Department
0402203 Circuit Analysis I Laboratory Experiment # 10
Introduction to PSPICE – Part III (AC Analysis)
OBJECTIVES:
1. To learn the use of PSPICE for Phasor analysis of circuits in both time and frequency
domains.
2. To learn the use of PSPICE to obtain the frequency response of AC circuits.
Homework:
Practice Problem 1: Using w = 1, obtain Vx and Ix in the circuit depicted in Fig- 1.10
Figure 1.10 For Practice Prob. 1.1.
Answer: From the output file Vx = 9.84/44.78o Ix =2.584/158o A
Document Page
Vx = 9.84/44.78o Ix =2.584/158o A
Ix(t) = 2.584 Cos(t+158) Amps
Practice Problem 2: Find ix(t) in the circuit in Fig. 1.11.
Figure 1.11 For Practice Problem. 1.2
Answer:
Document Page
From the output file. ix = 7.59/108.43o, Therefore, ix(t) = 7.59cos(4t+108.43o).
Practice Problem 3: For the circuit in Fig. 1.7 replace the capacitor C with an inductor L = 4 mH and
obtain the magnitude plot (both Linear and Bode) for vo for 10 < f < 100 MHz.
Answer: See the plots in Fig. 1.12
tabler-icon-diamond-filled.svg

Paraphrase This Document

Need a fresh take? Get an instant paraphrase of this document with our AI Paraphraser
Document Page
(a) (b)
Figure1.12: Result of Practice Problem 1.3 (a) Linear Plot (b) Bode Plot.
Practice Problem 4:
Find the magnitude and phase of the currents I1, I2 and I3 and the voltages V1, V2, V3 and V4. Freq = 1 Khz
V1 V2 V3 V4 I1 I2 I3
PSpice
Values
Magnitude 2.11 1.43 1.41 0.195 1.41 0.9 1.41
Phase -1.71 2.52 -1.75 88.25 -1.71 95.52 -1.75
Answer:
Document Page
Conclusion:
In this experiment , we learned a NEW Pspice III use which is Phasor Analysis , in the the
phasor analysis , we can measure voltage , current and voltage difference between 2 point
by (IPRINT1) , (VPRINT1) AND (VPRINT2) , we also added newly voltage and current
sources different than the old voltages and current sources of Pspice I which are (VAC) and
(IAC) , frequency can be calculated by F=w/2*pi*
chevron_up_icon
1 out of 6
circle_padding
hide_on_mobile
zoom_out_icon
[object Object]