Statistics Assignment: Statistical Analysis and Probability
VerifiedAdded on 2021/05/30
|13
|1363
|41
Homework Assignment
AI Summary
This statistics assignment covers a range of topics including descriptive statistics, probability, and regression analysis. The solutions presented include calculations of measures of central tendency (mean, median, mode), frequency distributions, histograms, and the calculation of standard deviation and interquartile range. Furthermore, the assignment explores correlation and regression analysis, constructing regression equations, and interpreting coefficients of determination. Probability concepts are addressed through the application of Bayes' theorem and calculations of probabilities based on different scenarios. Finally, the assignment also covers the use of the z-distribution for hypothesis testing and confidence intervals.
Running Head: STATISTICS
Statistics
Name of the Student
Name of the University
Author Note
Statistics
Name of the Student
Name of the University
Author Note
Paraphrase This Document
Need a fresh take? Get an instant paraphrase of this document with our AI Paraphraser
1STATISTICS
Table of Contents
ANSWER 1.....................................................................................................................................3
Part a............................................................................................................................................3
Part b............................................................................................................................................3
Part c............................................................................................................................................4
ANSWER 2.....................................................................................................................................4
Part a............................................................................................................................................4
Part b............................................................................................................................................4
Part c............................................................................................................................................5
Part d............................................................................................................................................6
ANSWER 3.....................................................................................................................................7
Part a............................................................................................................................................7
Part b............................................................................................................................................8
ANSWER 4.....................................................................................................................................8
Part a............................................................................................................................................8
Part b............................................................................................................................................9
Part c............................................................................................................................................9
Part d............................................................................................................................................9
ANSWER 5.....................................................................................................................................9
2STATISTICS
Part a............................................................................................................................................9
Part b..........................................................................................................................................10
ANSWER 6...................................................................................................................................10
Part a..........................................................................................................................................10
Part b..........................................................................................................................................10
ANSWER 7...................................................................................................................................11
Part a..........................................................................................................................................11
Part b..........................................................................................................................................11
ANSWER 8...................................................................................................................................12
Part a..........................................................................................................................................12
Part b..........................................................................................................................................12
⊘ This is a preview!⊘
Do you want full access?
Subscribe today to unlock all pages.
Trusted by 1+ million students worldwide
3STATISTICS
ANSWER 1
Part a
Class Interval Class Midpoint Frequency Relative
Frequency
Cumulative
Relative
frequency
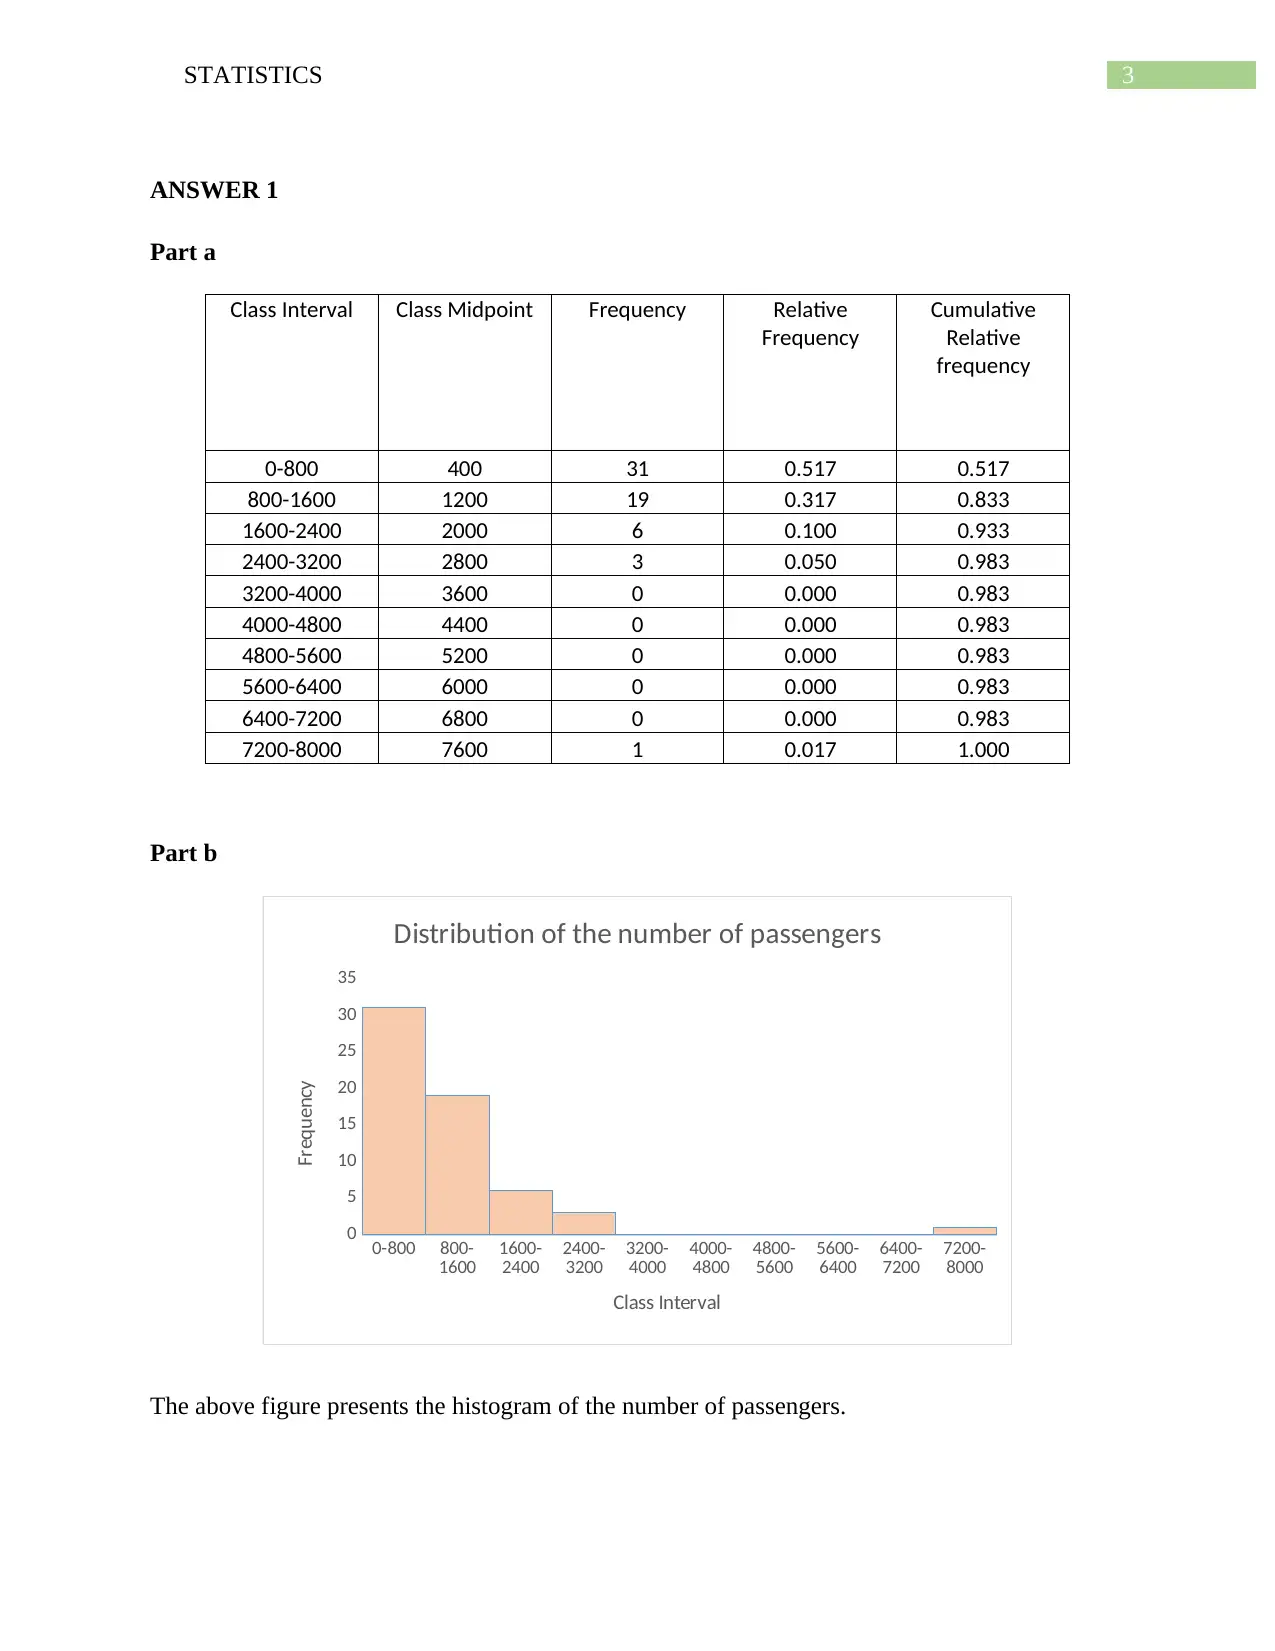
0-800 400 31 0.517 0.517
800-1600 1200 19 0.317 0.833
1600-2400 2000 6 0.100 0.933
2400-3200 2800 3 0.050 0.983
3200-4000 3600 0 0.000 0.983
4000-4800 4400 0 0.000 0.983
4800-5600 5200 0 0.000 0.983
5600-6400 6000 0 0.000 0.983
6400-7200 6800 0 0.000 0.983
7200-8000 7600 1 0.017 1.000
Part b
0-800 800-
1600 1600-
2400 2400-
3200 3200-
4000 4000-
4800 4800-
5600 5600-
6400 6400-
7200 7200-
8000
0
5
10
15
20
25
30
35
Distribution of the number of passengers
Class Interval
Frequency
The above figure presents the histogram of the number of passengers.
ANSWER 1
Part a
Class Interval Class Midpoint Frequency Relative
Frequency
Cumulative
Relative
frequency
0-800 400 31 0.517 0.517
800-1600 1200 19 0.317 0.833
1600-2400 2000 6 0.100 0.933
2400-3200 2800 3 0.050 0.983
3200-4000 3600 0 0.000 0.983
4000-4800 4400 0 0.000 0.983
4800-5600 5200 0 0.000 0.983
5600-6400 6000 0 0.000 0.983
6400-7200 6800 0 0.000 0.983
7200-8000 7600 1 0.017 1.000
Part b
0-800 800-
1600 1600-
2400 2400-
3200 3200-
4000 4000-
4800 4800-
5600 5600-
6400 6400-
7200 7200-
8000
0
5
10
15
20
25
30
35
Distribution of the number of passengers
Class Interval
Frequency
The above figure presents the histogram of the number of passengers.
Paraphrase This Document
Need a fresh take? Get an instant paraphrase of this document with our AI Paraphraser
4STATISTICS
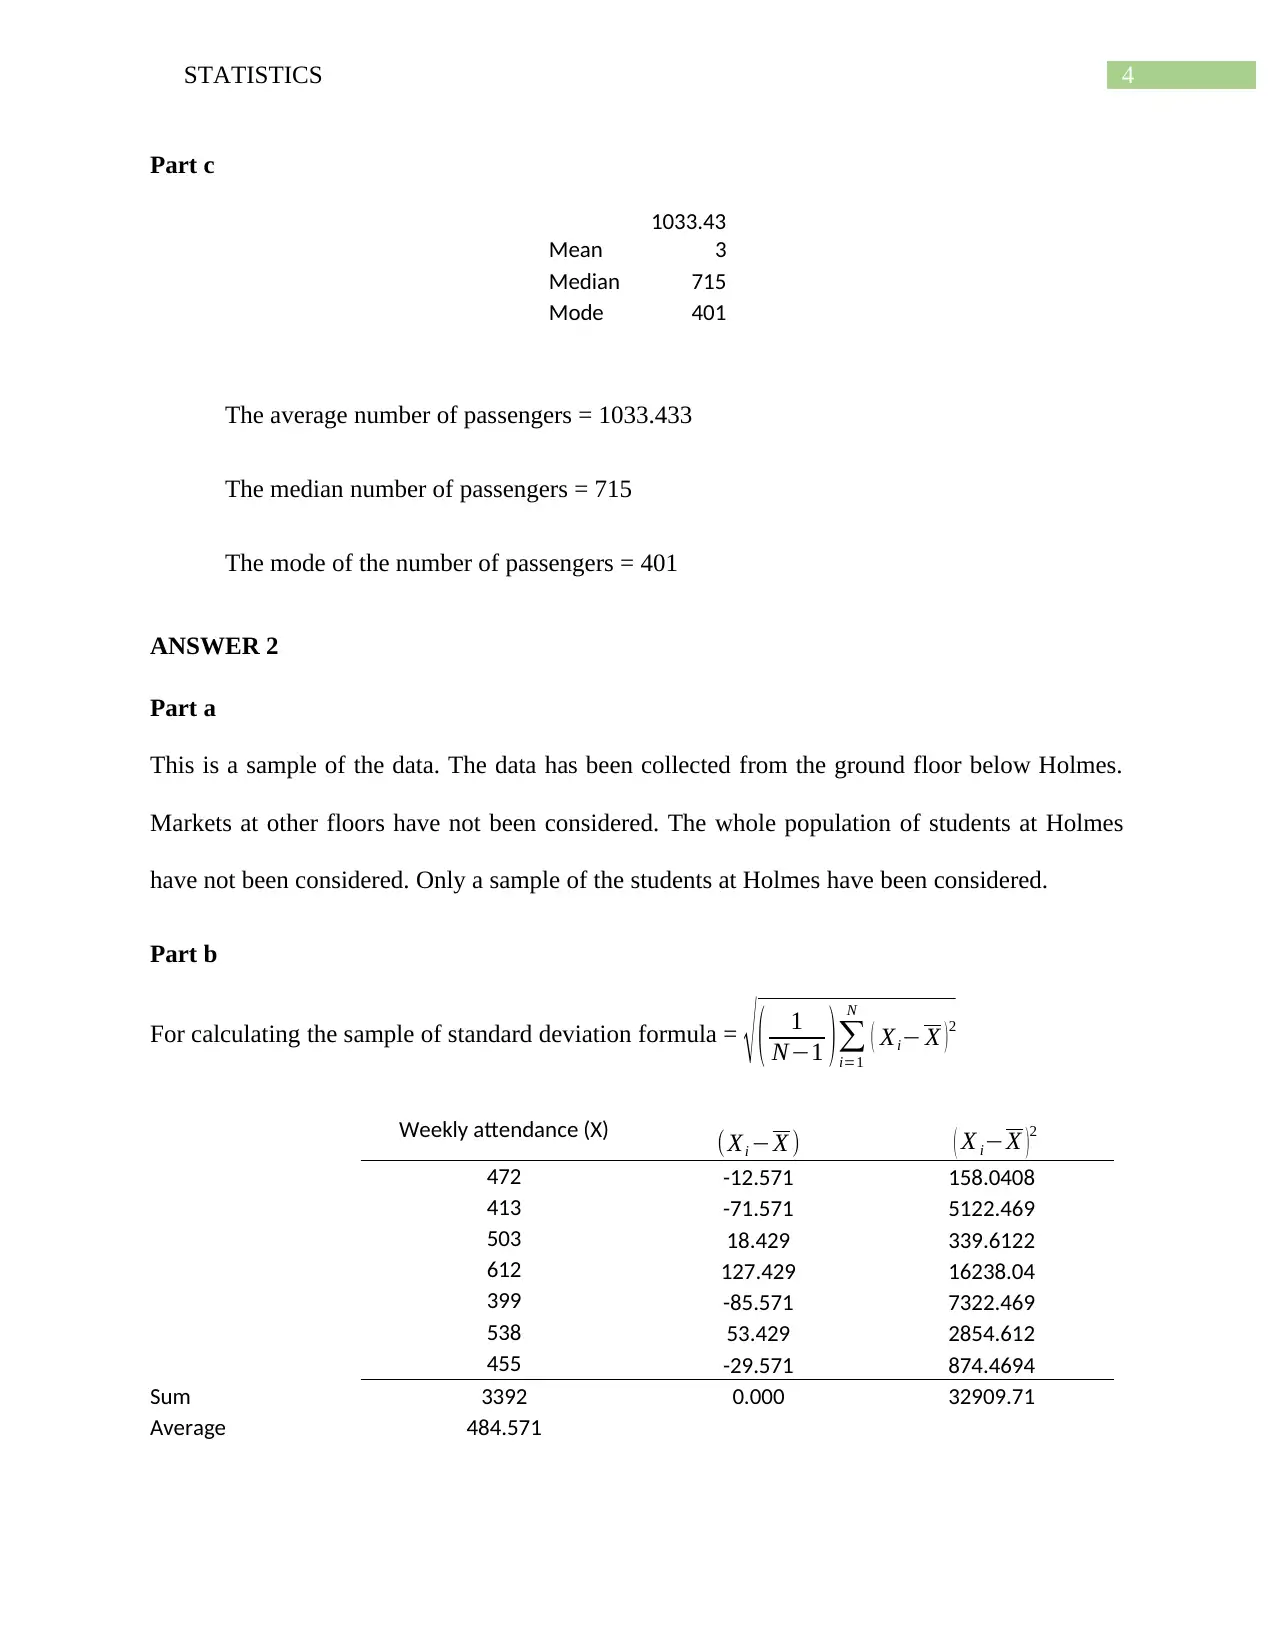
Part c
Mean
1033.43
3
Median 715
Mode 401
The average number of passengers = 1033.433
The median number of passengers = 715
The mode of the number of passengers = 401
ANSWER 2
Part a
This is a sample of the data. The data has been collected from the ground floor below Holmes.
Markets at other floors have not been considered. The whole population of students at Holmes
have not been considered. Only a sample of the students at Holmes have been considered.
Part b
For calculating the sample of standard deviation formula = √ ( 1
N−1 ) ∑
i=1
N
( Xi− X ) 2
Weekly attendance (X) (Xi −X ) ( X i−X )2
472 -12.571 158.0408
413 -71.571 5122.469
503 18.429 339.6122
612 127.429 16238.04
399 -85.571 7322.469
538 53.429 2854.612
455 -29.571 874.4694
Sum 3392 0.000 32909.71
Average 484.571
5STATISTICS
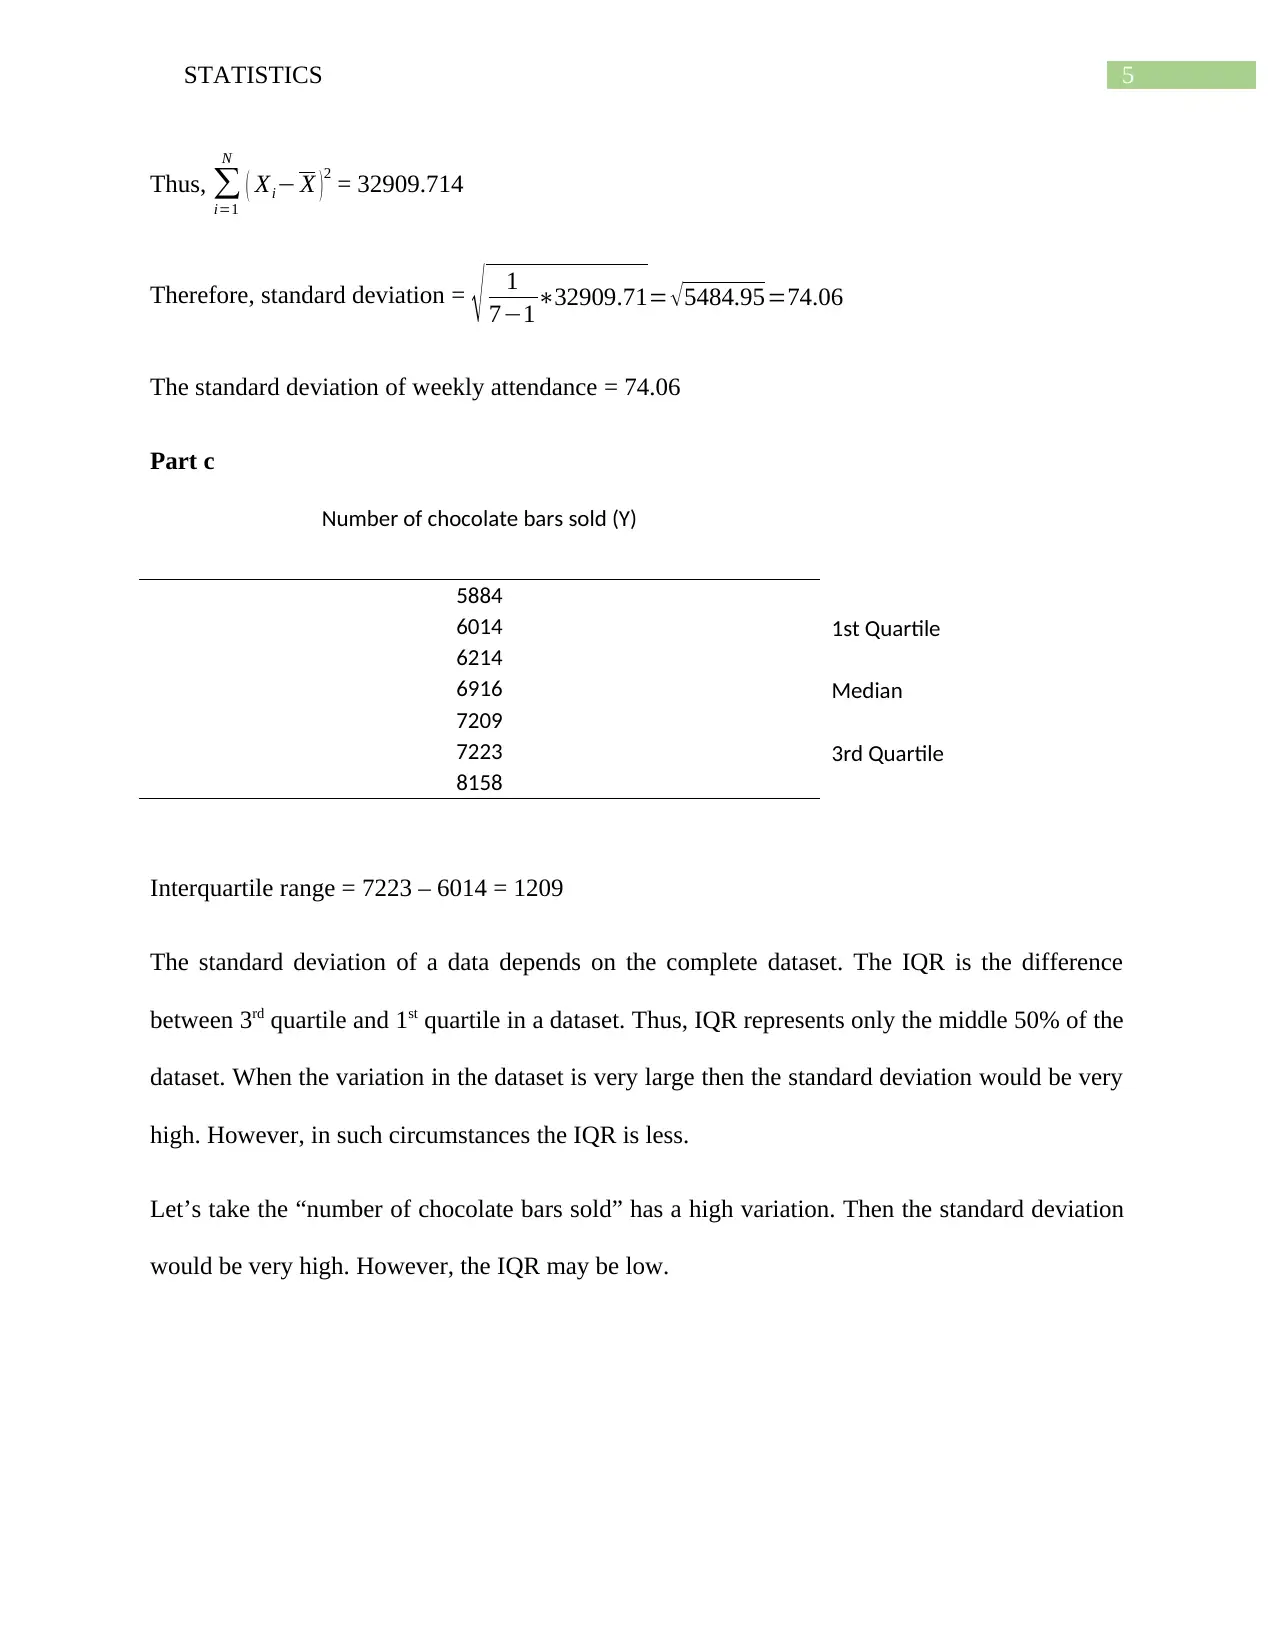
Thus, ∑
i=1
N
( Xi− X ) 2 = 32909.714
Therefore, standard deviation = √ 1
7−1∗32909.71= √ 5484.95=74.06
The standard deviation of weekly attendance = 74.06
Part c
Number of chocolate bars sold (Y)
5884
6014 1st Quartile
6214
6916 Median
7209
7223 3rd Quartile
8158
Interquartile range = 7223 – 6014 = 1209
The standard deviation of a data depends on the complete dataset. The IQR is the difference
between 3rd quartile and 1st quartile in a dataset. Thus, IQR represents only the middle 50% of the
dataset. When the variation in the dataset is very large then the standard deviation would be very
high. However, in such circumstances the IQR is less.
Let’s take the “number of chocolate bars sold” has a high variation. Then the standard deviation
would be very high. However, the IQR may be low.
⊘ This is a preview!⊘
Do you want full access?
Subscribe today to unlock all pages.
Trusted by 1+ million students worldwide
6STATISTICS
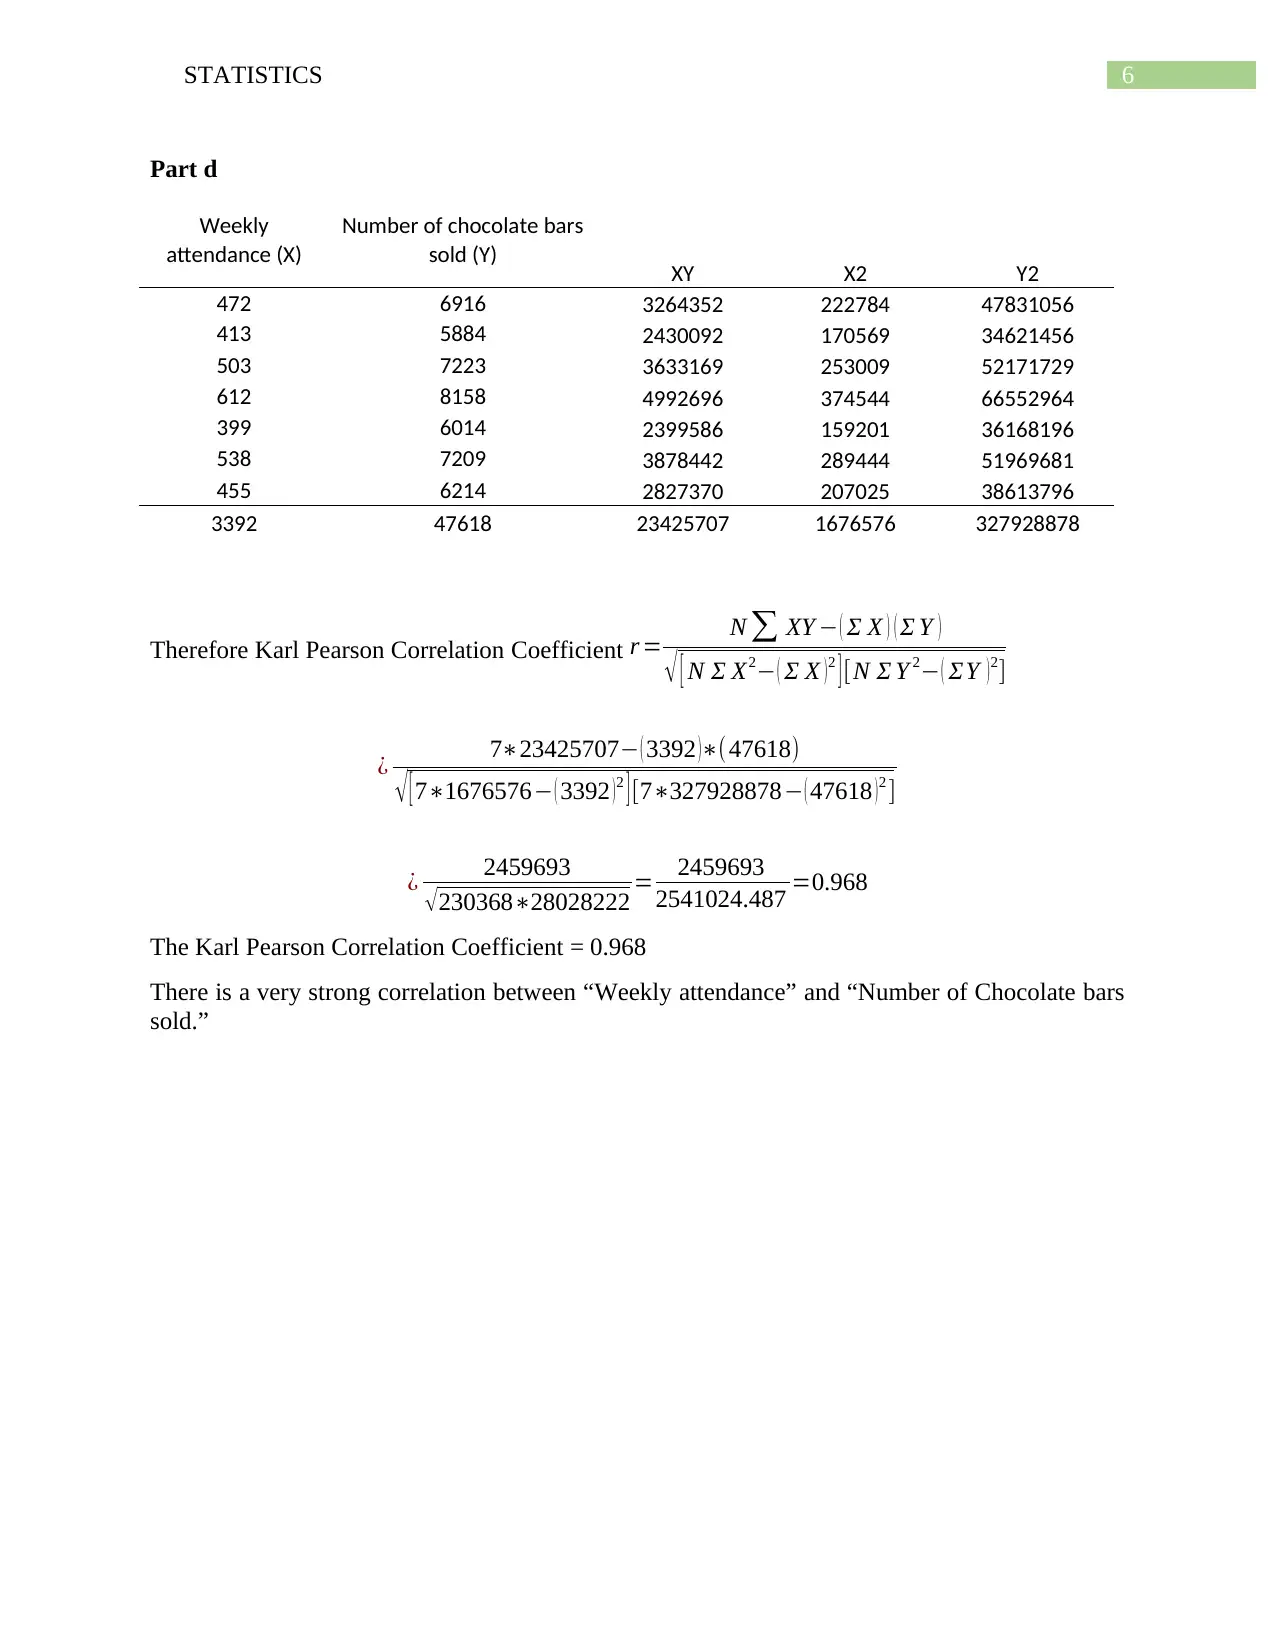
Part d
Weekly
attendance (X)
Number of chocolate bars
sold (Y) XY X2 Y2
472 6916 3264352 222784 47831056
413 5884 2430092 170569 34621456
503 7223 3633169 253009 52171729
612 8158 4992696 374544 66552964
399 6014 2399586 159201 36168196
538 7209 3878442 289444 51969681
455 6214 2827370 207025 38613796
3392 47618 23425707 1676576 327928878
Therefore Karl Pearson Correlation Coefficient r = N ∑ XY − ( Σ X ) ( Σ Y )
√ [ N Σ X2− ( Σ X )2 ] [N Σ Y 2− ( ΣY )2]
¿ 7∗23425707− ( 3392 )∗(47618)
√ [ 7∗1676576− ( 3392 )2 ] [7∗327928878− ( 47618 )2 ]
¿ 2459693
√ 230368∗28028222 = 2459693
2541024.487 =0.968
The Karl Pearson Correlation Coefficient = 0.968
There is a very strong correlation between “Weekly attendance” and “Number of Chocolate bars
sold.”
Paraphrase This Document
Need a fresh take? Get an instant paraphrase of this document with our AI Paraphraser
7STATISTICS
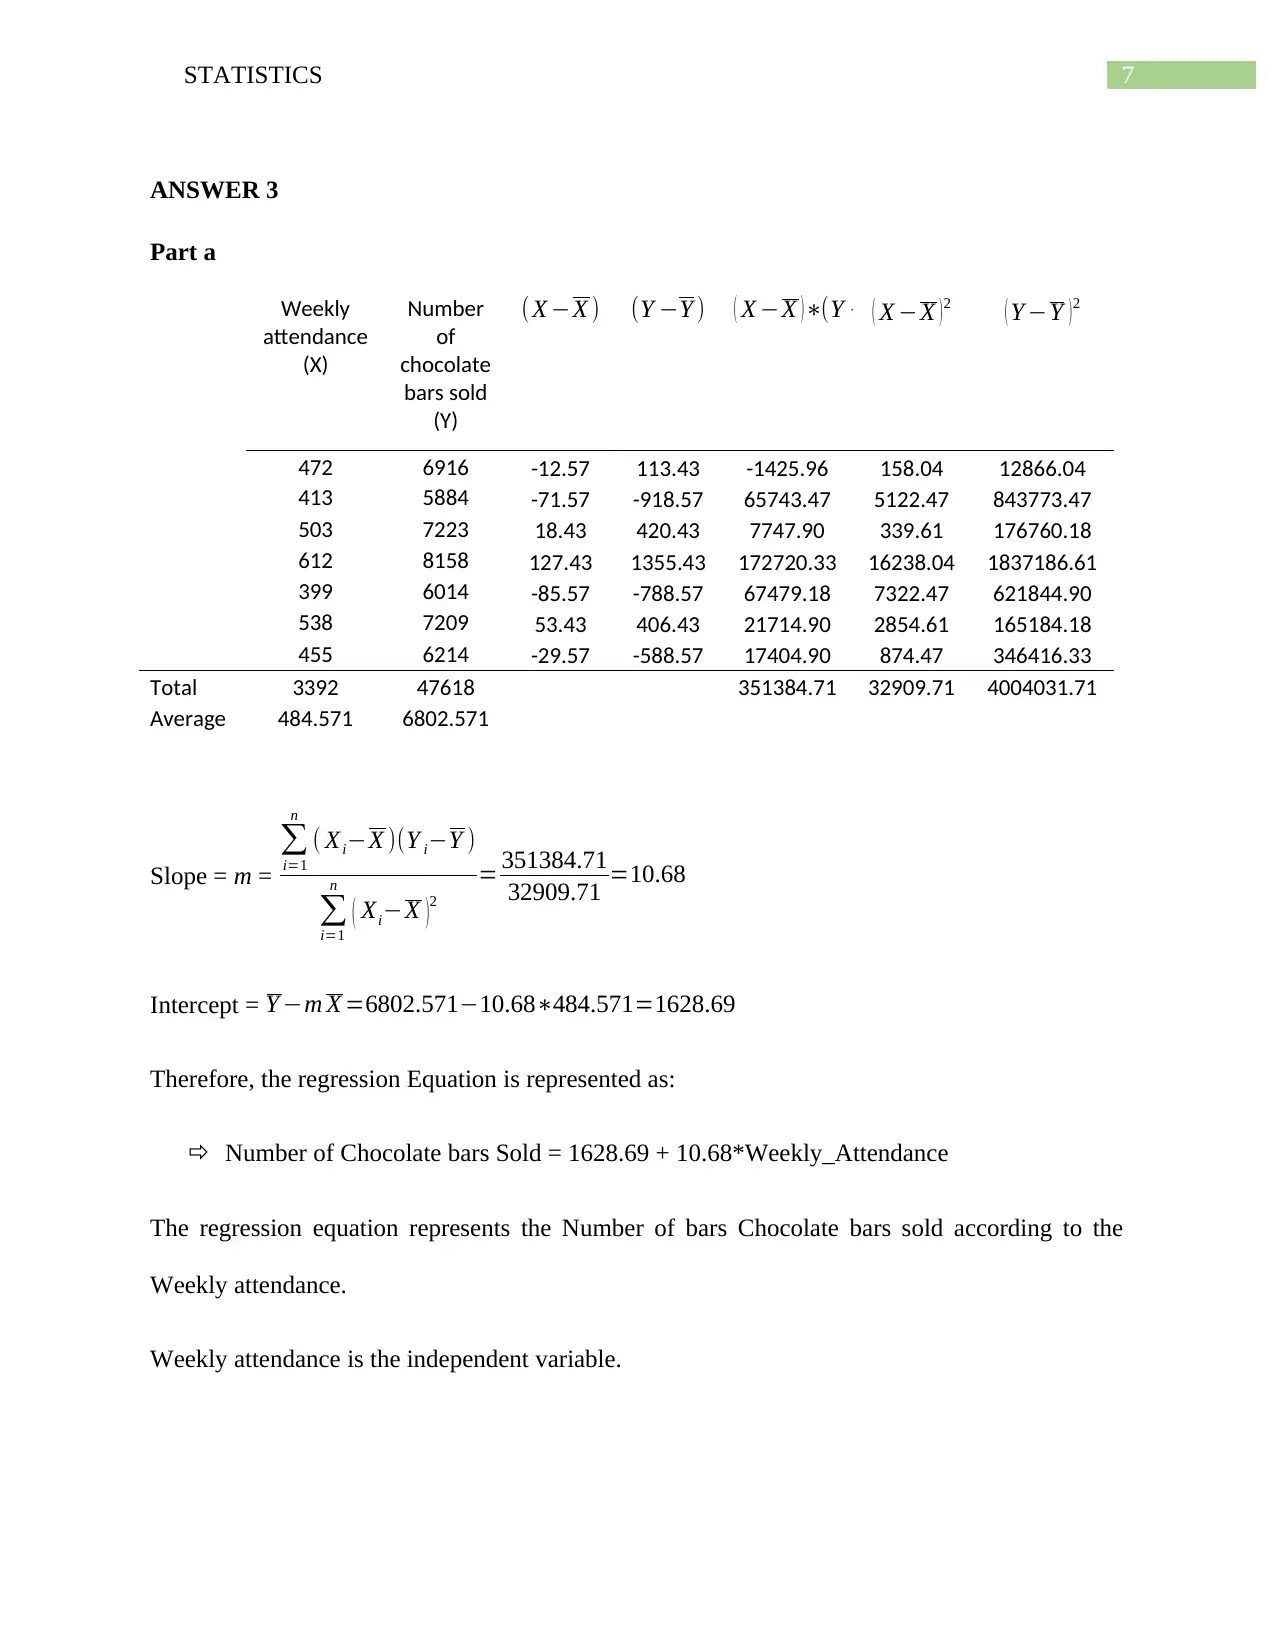
ANSWER 3
Part a
Weekly
attendance
(X)
Number
of
chocolate
bars sold
(Y)
(X −X ) (Y −Y ) ( X −X ) ∗(Y −Y )( X −X ) 2 ( Y −Y ) 2
472 6916 -12.57 113.43 -1425.96 158.04 12866.04
413 5884 -71.57 -918.57 65743.47 5122.47 843773.47
503 7223 18.43 420.43 7747.90 339.61 176760.18
612 8158 127.43 1355.43 172720.33 16238.04 1837186.61
399 6014 -85.57 -788.57 67479.18 7322.47 621844.90
538 7209 53.43 406.43 21714.90 2854.61 165184.18
455 6214 -29.57 -588.57 17404.90 874.47 346416.33
Total 3392 47618 351384.71 32909.71 4004031.71
Average 484.571 6802.571
Slope = m =
∑
i=1
n
( Xi−X )(Y i−Y )
∑
i=1
n
( Xi−X )2
= 351384.71
32909.71 =10.68
Intercept = Y −m X =6802.571−10.68∗484.571=1628.69
Therefore, the regression Equation is represented as:
Number of Chocolate bars Sold = 1628.69 + 10.68*Weekly_Attendance
The regression equation represents the Number of bars Chocolate bars sold according to the
Weekly attendance.
Weekly attendance is the independent variable.
8STATISTICS
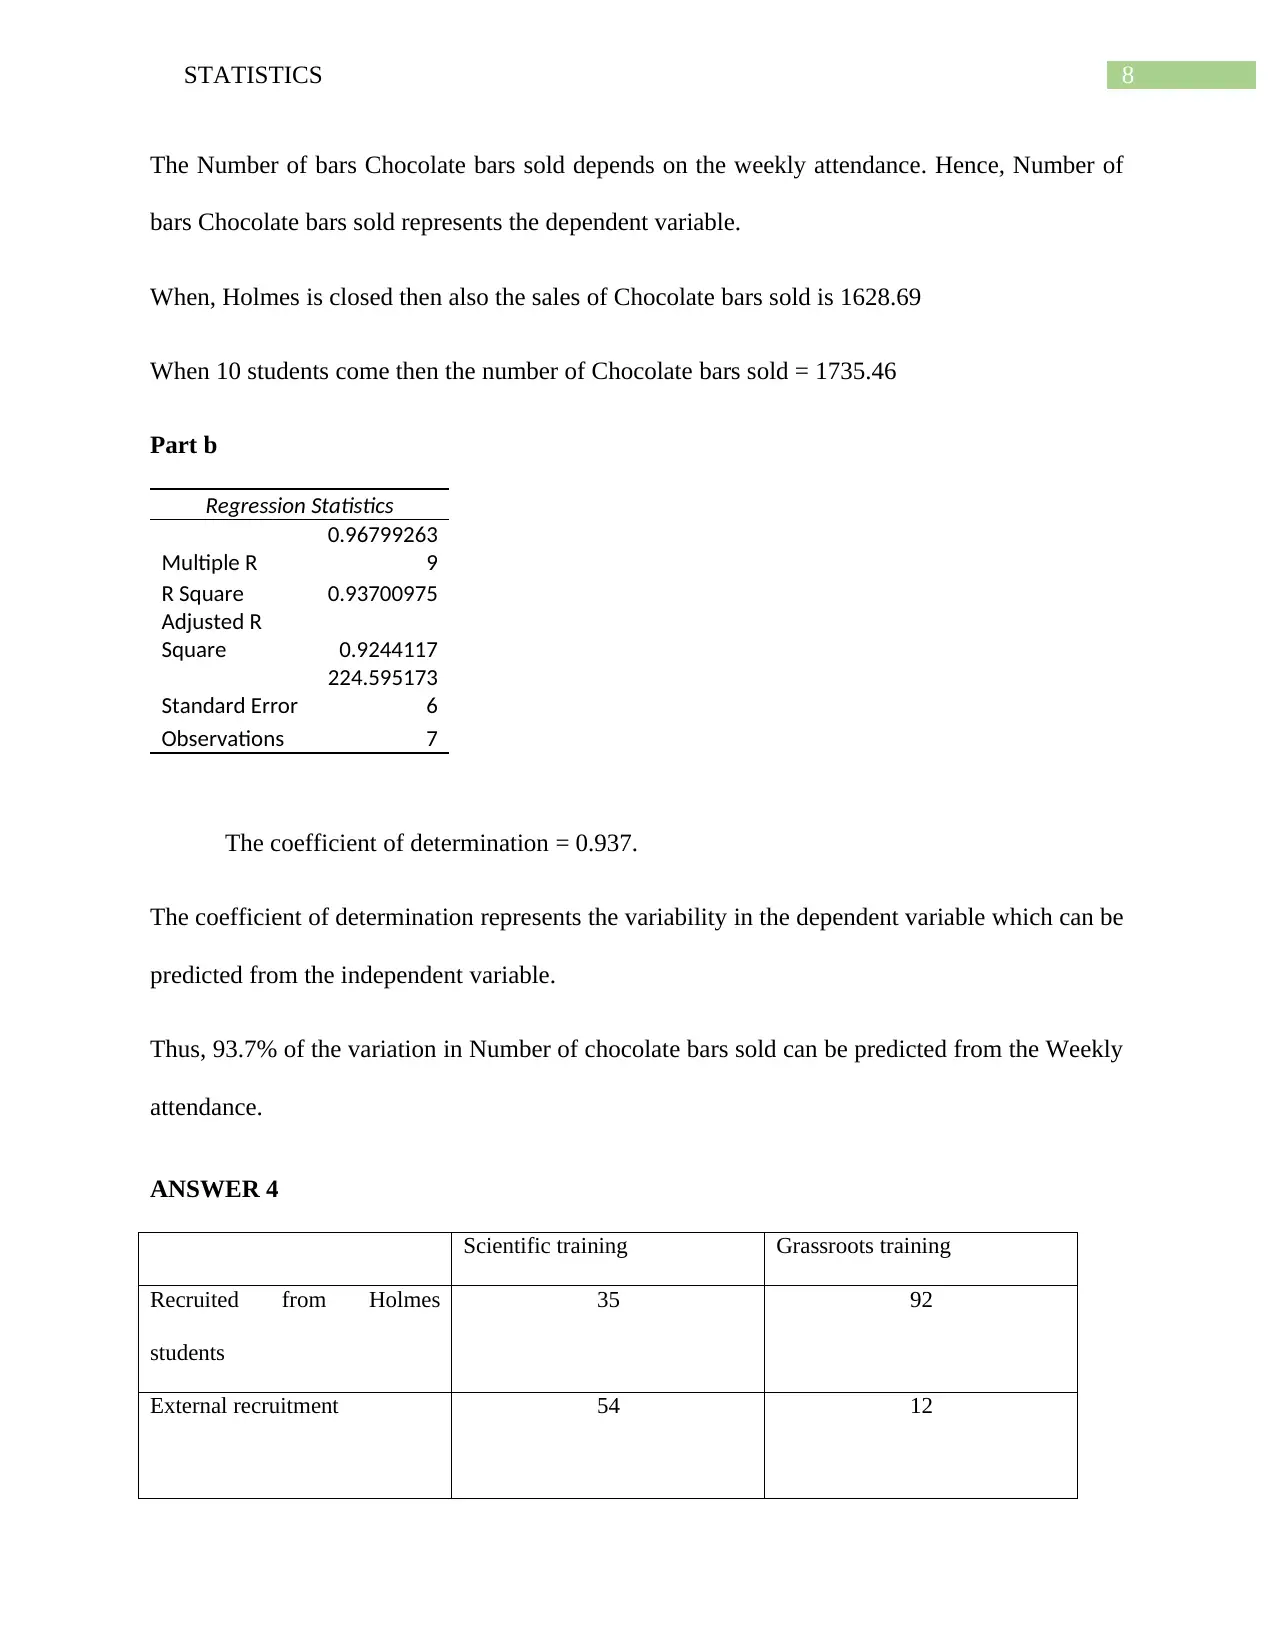
The Number of bars Chocolate bars sold depends on the weekly attendance. Hence, Number of
bars Chocolate bars sold represents the dependent variable.
When, Holmes is closed then also the sales of Chocolate bars sold is 1628.69
When 10 students come then the number of Chocolate bars sold = 1735.46
Part b
Regression Statistics
Multiple R
0.96799263
9
R Square 0.93700975
Adjusted R
Square 0.9244117
Standard Error
224.595173
6
Observations 7
The coefficient of determination = 0.937.
The coefficient of determination represents the variability in the dependent variable which can be
predicted from the independent variable.
Thus, 93.7% of the variation in Number of chocolate bars sold can be predicted from the Weekly
attendance.
ANSWER 4
Scientific training Grassroots training
Recruited from Holmes
students
35 92
External recruitment 54 12
⊘ This is a preview!⊘
Do you want full access?
Subscribe today to unlock all pages.
Trusted by 1+ million students worldwide
9STATISTICS
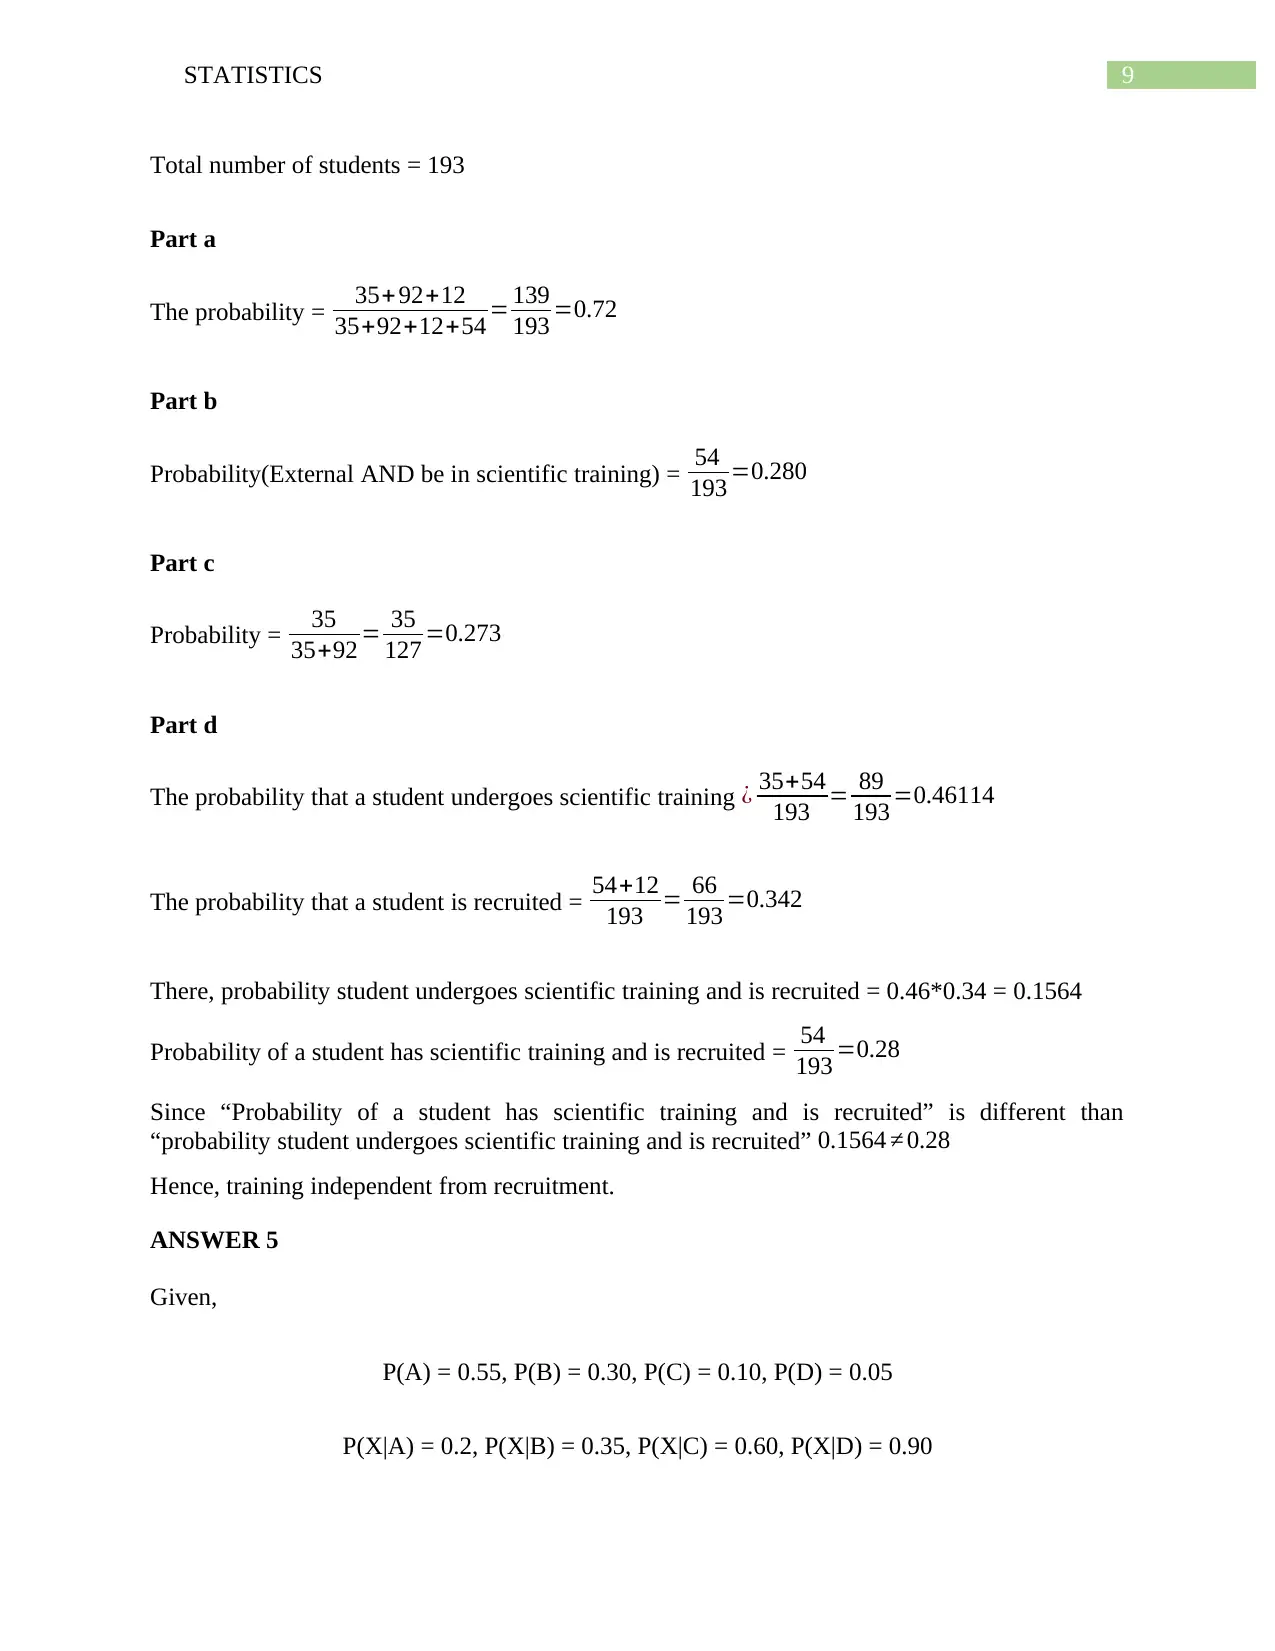
Total number of students = 193
Part a
The probability = 35+ 92+12
35+92+12+54 = 139
193 =0.72
Part b
Probability(External AND be in scientific training) = 54
193 =0.280
Part c
Probability = 35
35+92 = 35
127 =0.273
Part d
The probability that a student undergoes scientific training ¿ 35+54
193 = 89
193 =0.46114
The probability that a student is recruited = 54+12
193 = 66
193 =0.342
There, probability student undergoes scientific training and is recruited = 0.46*0.34 = 0.1564
Probability of a student has scientific training and is recruited = 54
193 =0.28
Since “Probability of a student has scientific training and is recruited” is different than
“probability student undergoes scientific training and is recruited” 0.1564 ≠ 0.28
Hence, training independent from recruitment.
ANSWER 5
Given,
P(A) = 0.55, P(B) = 0.30, P(C) = 0.10, P(D) = 0.05
P(X|A) = 0.2, P(X|B) = 0.35, P(X|C) = 0.60, P(X|D) = 0.90
Paraphrase This Document
Need a fresh take? Get an instant paraphrase of this document with our AI Paraphraser
10STATISTICS
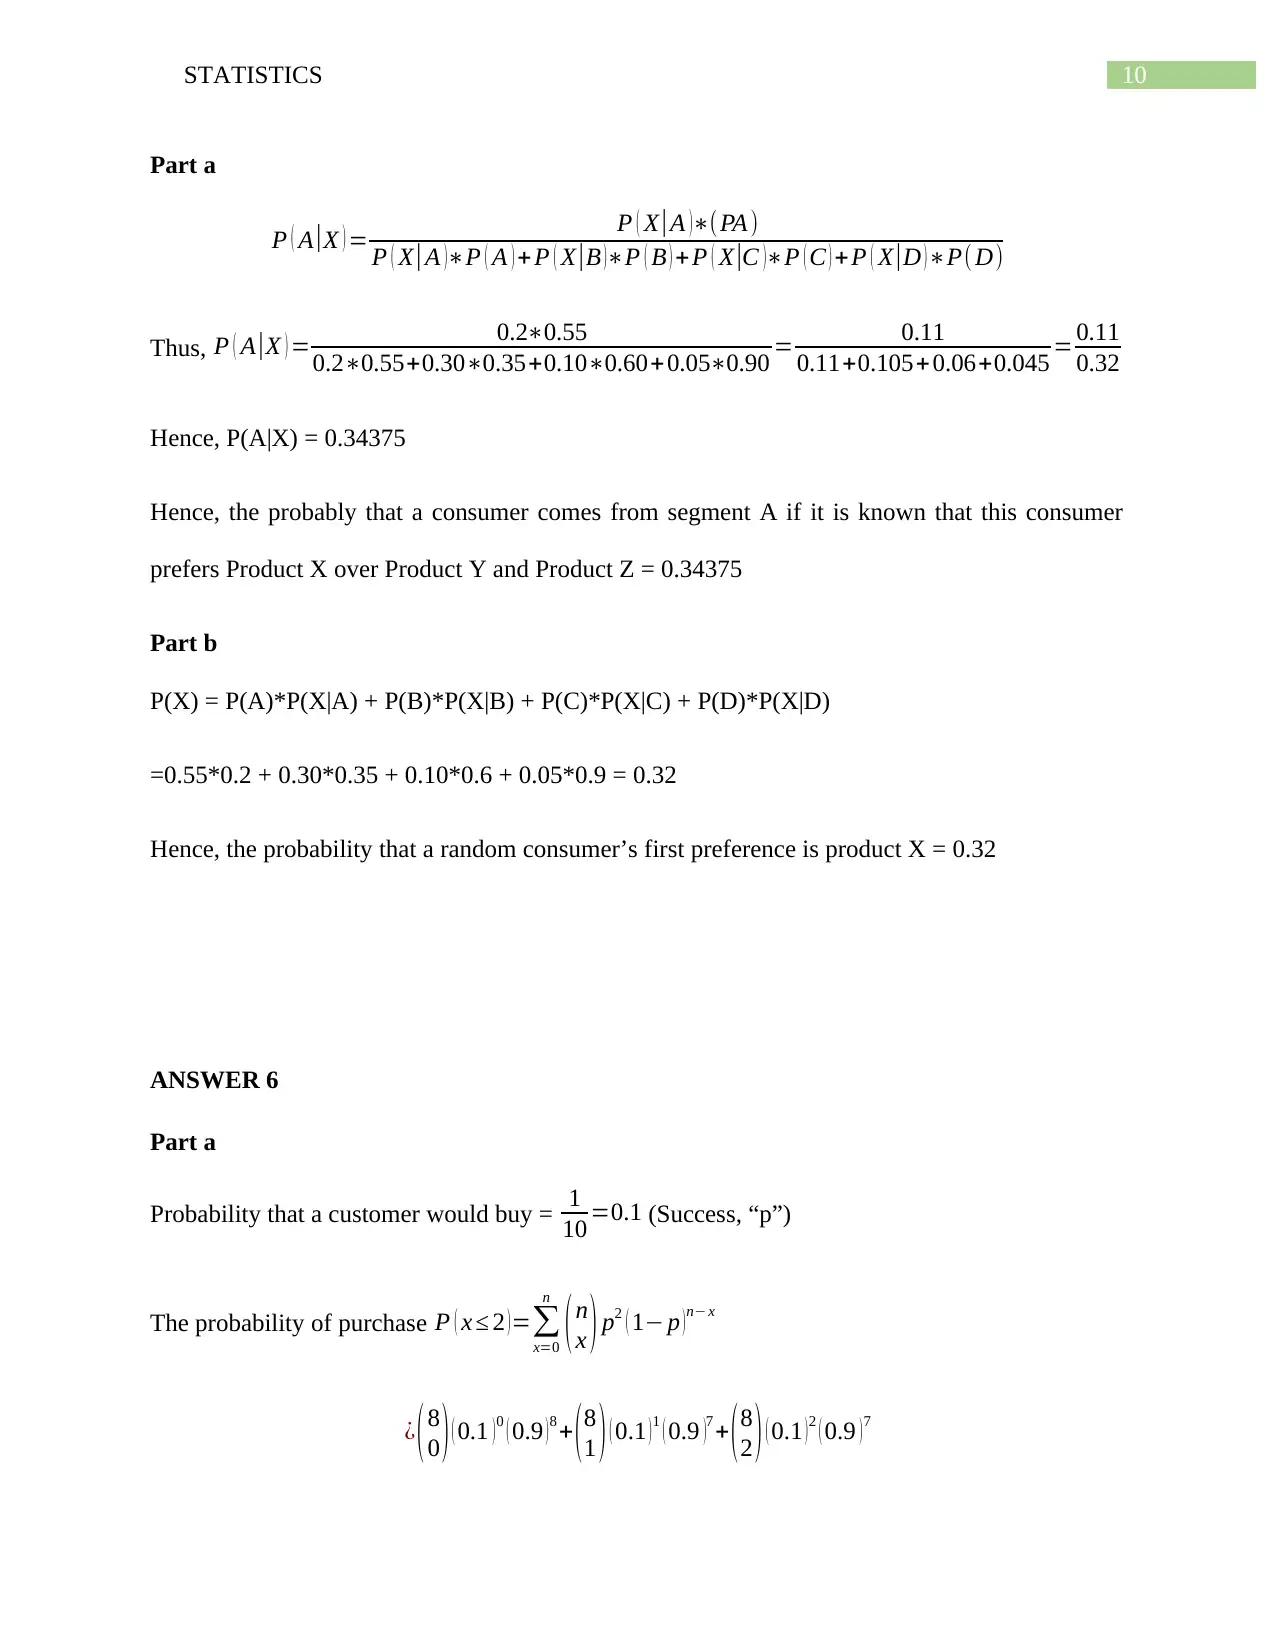
Part a
P ( A |X ) = P ( X |A )∗(PA)
P ( X |A )∗P ( A ) + P ( X |B )∗P ( B ) +P ( X |C )∗P ( C ) +P ( X |D )∗P( D)
Thus, P ( A |X ) = 0.2∗0.55
0.2∗0.55+0.30∗0.35+0.10∗0.60+0.05∗0.90 = 0.11
0.11+0.105+0.06+0.045 = 0.11
0.32
Hence, P(A|X) = 0.34375
Hence, the probably that a consumer comes from segment A if it is known that this consumer
prefers Product X over Product Y and Product Z = 0.34375
Part b
P(X) = P(A)*P(X|A) + P(B)*P(X|B) + P(C)*P(X|C) + P(D)*P(X|D)
=0.55*0.2 + 0.30*0.35 + 0.10*0.6 + 0.05*0.9 = 0.32
Hence, the probability that a random consumer’s first preference is product X = 0.32
ANSWER 6
Part a
Probability that a customer would buy = 1
10 =0.1 (Success, “p”)
The probability of purchase P ( x ≤ 2 )=∑
x=0
n
(n
x ) p2 ( 1− p )n− x
¿ ( 8
0 ) ( 0.1 ) 0 ( 0.9 ) 8 + ( 8
1 ) ( 0.1 ) 1 ( 0.9 )7 + ( 8
2 ) ( 0.1 ) 2 ( 0.9 ) 7
Part a
P ( A |X ) = P ( X |A )∗(PA)
P ( X |A )∗P ( A ) + P ( X |B )∗P ( B ) +P ( X |C )∗P ( C ) +P ( X |D )∗P( D)
Thus, P ( A |X ) = 0.2∗0.55
0.2∗0.55+0.30∗0.35+0.10∗0.60+0.05∗0.90 = 0.11
0.11+0.105+0.06+0.045 = 0.11
0.32
Hence, P(A|X) = 0.34375
Hence, the probably that a consumer comes from segment A if it is known that this consumer
prefers Product X over Product Y and Product Z = 0.34375
Part b
P(X) = P(A)*P(X|A) + P(B)*P(X|B) + P(C)*P(X|C) + P(D)*P(X|D)
=0.55*0.2 + 0.30*0.35 + 0.10*0.6 + 0.05*0.9 = 0.32
Hence, the probability that a random consumer’s first preference is product X = 0.32
ANSWER 6
Part a
Probability that a customer would buy = 1
10 =0.1 (Success, “p”)
The probability of purchase P ( x ≤ 2 )=∑
x=0
n
(n
x ) p2 ( 1− p )n− x
¿ ( 8
0 ) ( 0.1 ) 0 ( 0.9 ) 8 + ( 8
1 ) ( 0.1 ) 1 ( 0.9 )7 + ( 8
2 ) ( 0.1 ) 2 ( 0.9 ) 7
11STATISTICS
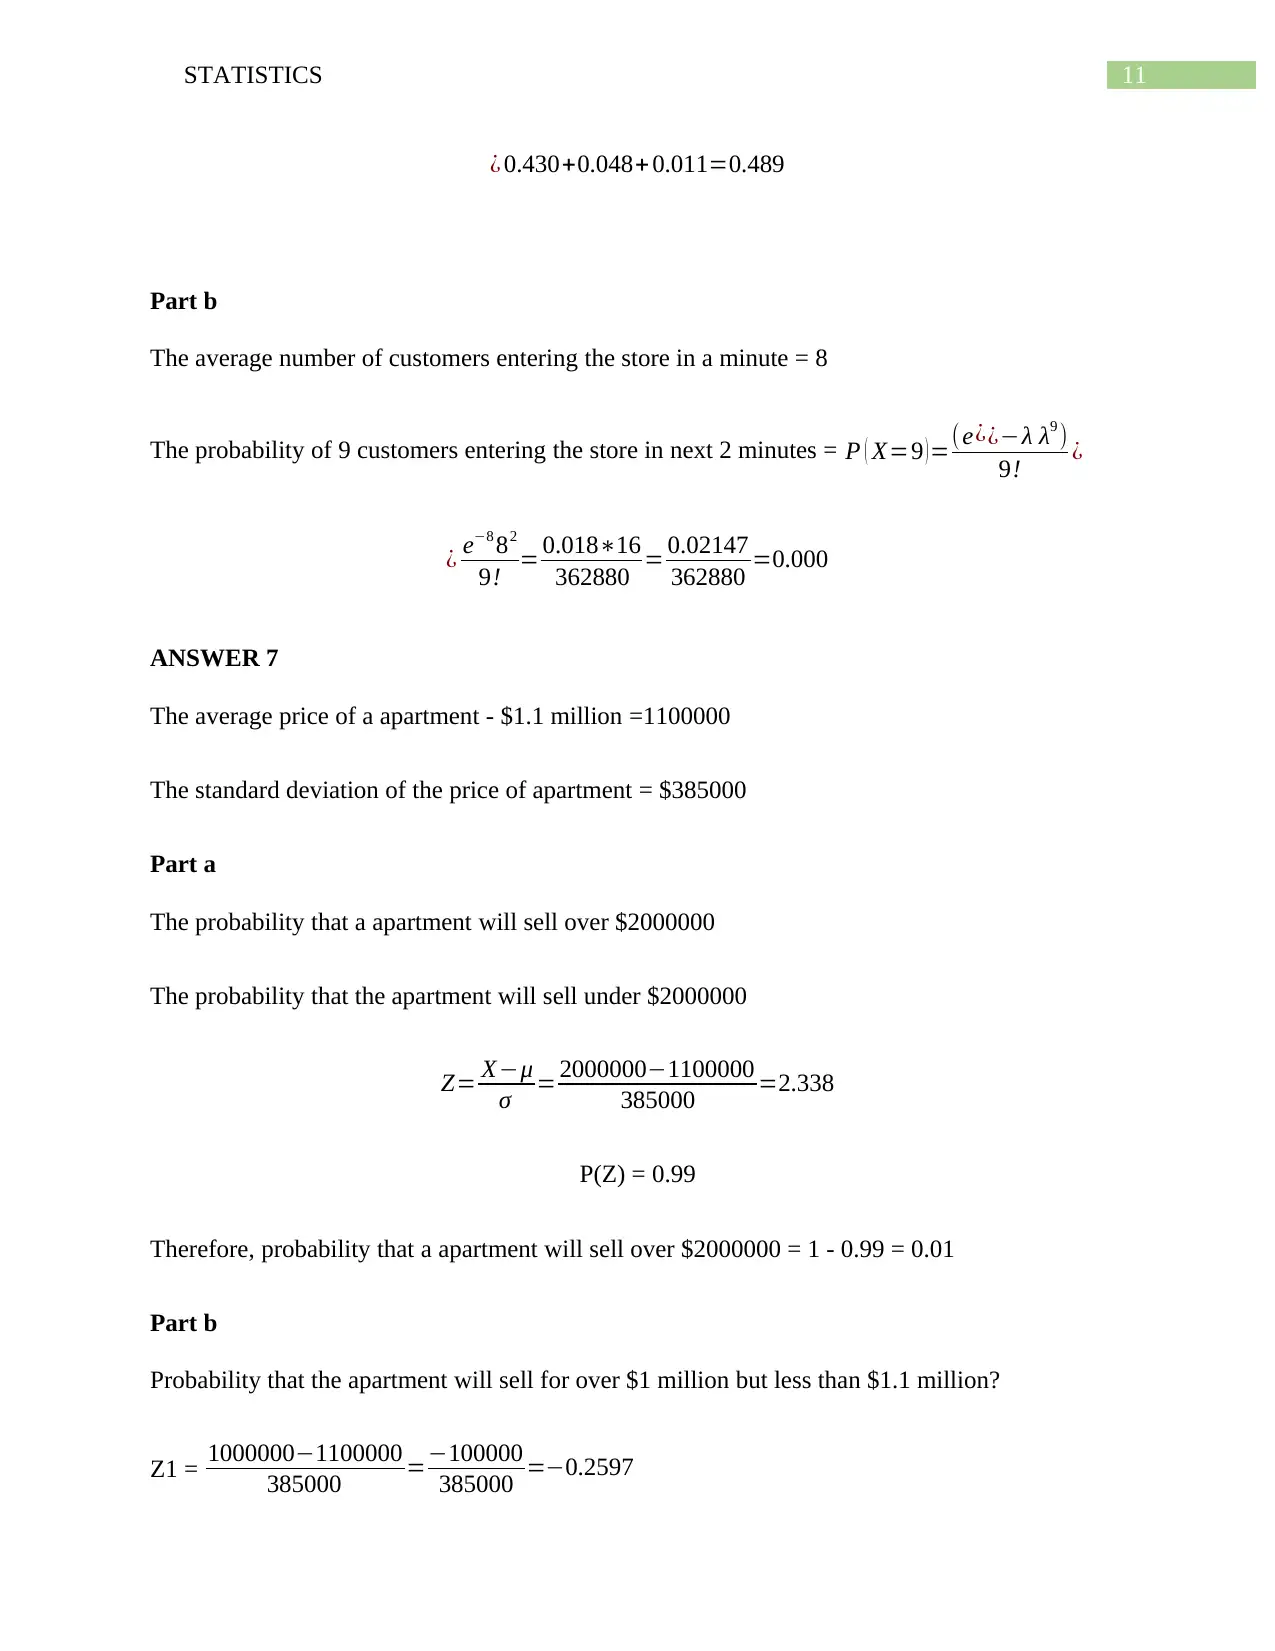
¿ 0.430+0.048+ 0.011=0.489
Part b
The average number of customers entering the store in a minute = 8
The probability of 9 customers entering the store in next 2 minutes = P ( X=9 ) =(e¿¿−λ λ9 )
9! ¿
¿ e−8 82
9! = 0.018∗16
362880 = 0.02147
362880 =0.000
ANSWER 7
The average price of a apartment - $1.1 million =1100000
The standard deviation of the price of apartment = $385000
Part a
The probability that a apartment will sell over $2000000
The probability that the apartment will sell under $2000000
Z= X−μ
σ = 2000000−1100000
385000 =2.338
P(Z) = 0.99
Therefore, probability that a apartment will sell over $2000000 = 1 - 0.99 = 0.01
Part b
Probability that the apartment will sell for over $1 million but less than $1.1 million?
Z1 = 1000000−1100000
385000 =−100000
385000 =−0.2597
⊘ This is a preview!⊘
Do you want full access?
Subscribe today to unlock all pages.
Trusted by 1+ million students worldwide
1 out of 13
Related Documents


Your All-in-One AI-Powered Toolkit for Academic Success.
+13062052269
info@desklib.com
Available 24*7 on WhatsApp / Email
![[object Object]](/_next/static/media/star-bottom.7253800d.svg)
Unlock your academic potential
Copyright © 2020–2026 A2Z Services. All Rights Reserved. Developed and managed by ZUCOL.