University Statistics for Business 161.101 Assignment 2 Analysis
VerifiedAdded on 2022/08/26
|5
|1806
|41
Homework Assignment
AI Summary
This document presents a complete solution to a statistics assignment for a business course. The assignment covers several key statistical concepts, including probability calculations related to executive loyalty and coffee consumption, binomial distribution analysis of transaction errors, and normal distribution applications to orange juice extraction. It also includes confidence interval estimations for diesel purchases and fuel consumption, along with an extension question exploring probabilities in a group scenario. The solution provides detailed explanations, calculations, and interpretations, offering a comprehensive understanding of the statistical methods applied. The assignment aims to assess students' ability to apply statistical techniques to real-world business problems and interpret the results accurately.
Michael Langdon
20003727
Name: 161.101 Statistics for Business
ID Number:
ASSIGNMENT 2 Due 10January 2020
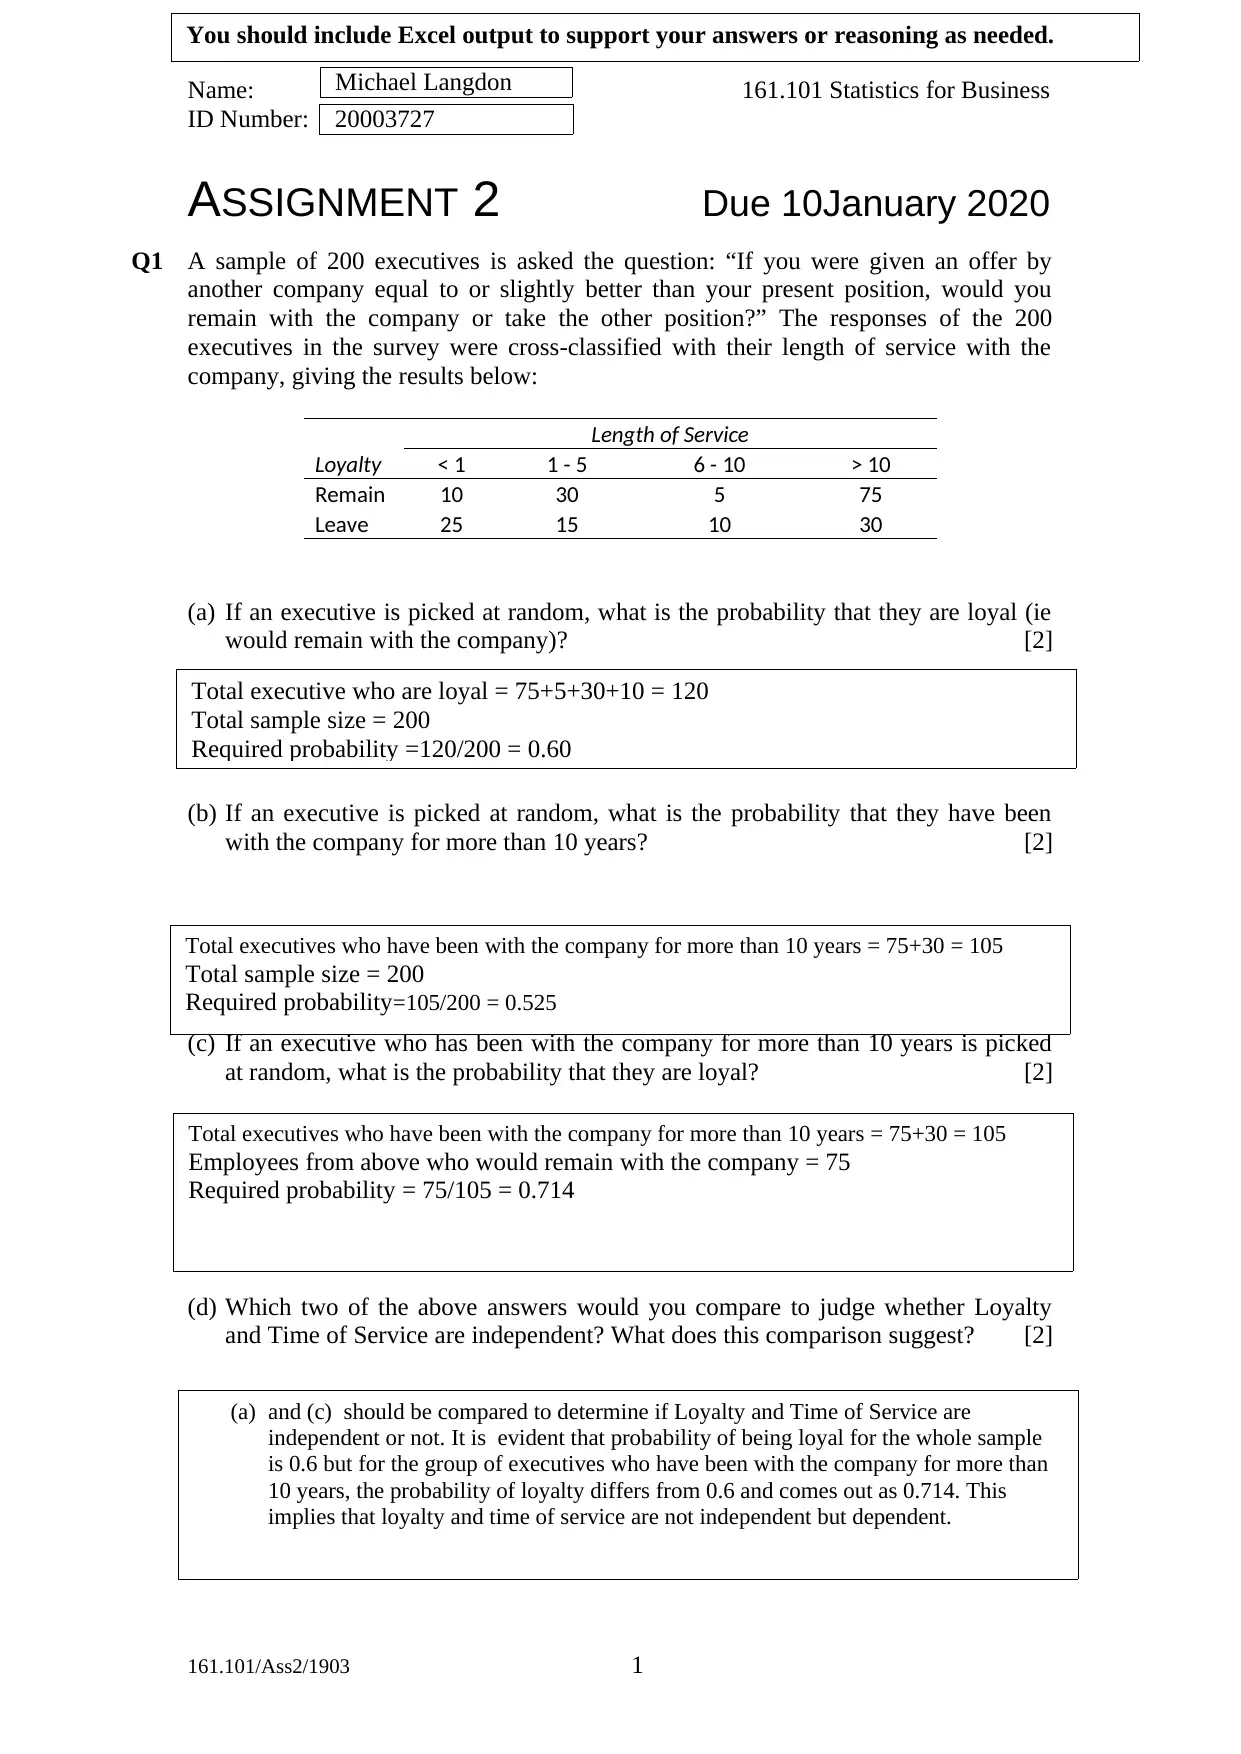
Q1 A sample of 200 executives is asked the question: “If you were given an offer by
another company equal to or slightly better than your present position, would you
remain with the company or take the other position?” The responses of the 200
executives in the survey were cross-classified with their length of service with the
company, giving the results below:
Length of Service
Loyalty < 1 1 - 5 6 - 10 > 10
Remain 10 30 5 75
Leave 25 15 10 30
(a) If an executive is picked at random, what is the probability that they are loyal (ie
would remain with the company)? [2]
(b) If an executive is picked at random, what is the probability that they have been
with the company for more than 10 years? [2]
(c) If an executive who has been with the company for more than 10 years is picked
at random, what is the probability that they are loyal? [2]
(d) Which two of the above answers would you compare to judge whether Loyalty
and Time of Service are independent? What does this comparison suggest? [2]
161.101/Ass2/1903 1
Total executive who are loyal = 75+5+30+10 = 120
Total sample size = 200
Required probability =120/200 = 0.60
Total executives who have been with the company for more than 10 years = 75+30 = 105
Total sample size = 200
Required probability=105/200 = 0.525
Total executives who have been with the company for more than 10 years = 75+30 = 105
Employees from above who would remain with the company = 75
Required probability = 75/105 = 0.714
(a) and (c) should be compared to determine if Loyalty and Time of Service are
independent or not. It is evident that probability of being loyal for the whole sample
is 0.6 but for the group of executives who have been with the company for more than
10 years, the probability of loyalty differs from 0.6 and comes out as 0.714. This
implies that loyalty and time of service are not independent but dependent.
You should include Excel output to support your answers or reasoning as needed.
20003727
Name: 161.101 Statistics for Business
ID Number:
ASSIGNMENT 2 Due 10January 2020
Q1 A sample of 200 executives is asked the question: “If you were given an offer by
another company equal to or slightly better than your present position, would you
remain with the company or take the other position?” The responses of the 200
executives in the survey were cross-classified with their length of service with the
company, giving the results below:
Length of Service
Loyalty < 1 1 - 5 6 - 10 > 10
Remain 10 30 5 75
Leave 25 15 10 30
(a) If an executive is picked at random, what is the probability that they are loyal (ie
would remain with the company)? [2]
(b) If an executive is picked at random, what is the probability that they have been
with the company for more than 10 years? [2]
(c) If an executive who has been with the company for more than 10 years is picked
at random, what is the probability that they are loyal? [2]
(d) Which two of the above answers would you compare to judge whether Loyalty
and Time of Service are independent? What does this comparison suggest? [2]
161.101/Ass2/1903 1
Total executive who are loyal = 75+5+30+10 = 120
Total sample size = 200
Required probability =120/200 = 0.60
Total executives who have been with the company for more than 10 years = 75+30 = 105
Total sample size = 200
Required probability=105/200 = 0.525
Total executives who have been with the company for more than 10 years = 75+30 = 105
Employees from above who would remain with the company = 75
Required probability = 75/105 = 0.714
(a) and (c) should be compared to determine if Loyalty and Time of Service are
independent or not. It is evident that probability of being loyal for the whole sample
is 0.6 but for the group of executives who have been with the company for more than
10 years, the probability of loyalty differs from 0.6 and comes out as 0.714. This
implies that loyalty and time of service are not independent but dependent.
You should include Excel output to support your answers or reasoning as needed.
Paraphrase This Document
Need a fresh take? Get an instant paraphrase of this document with our AI Paraphraser
Michael Langdon
20003727
Name: 161.101 Statistics for Business
ID Number:
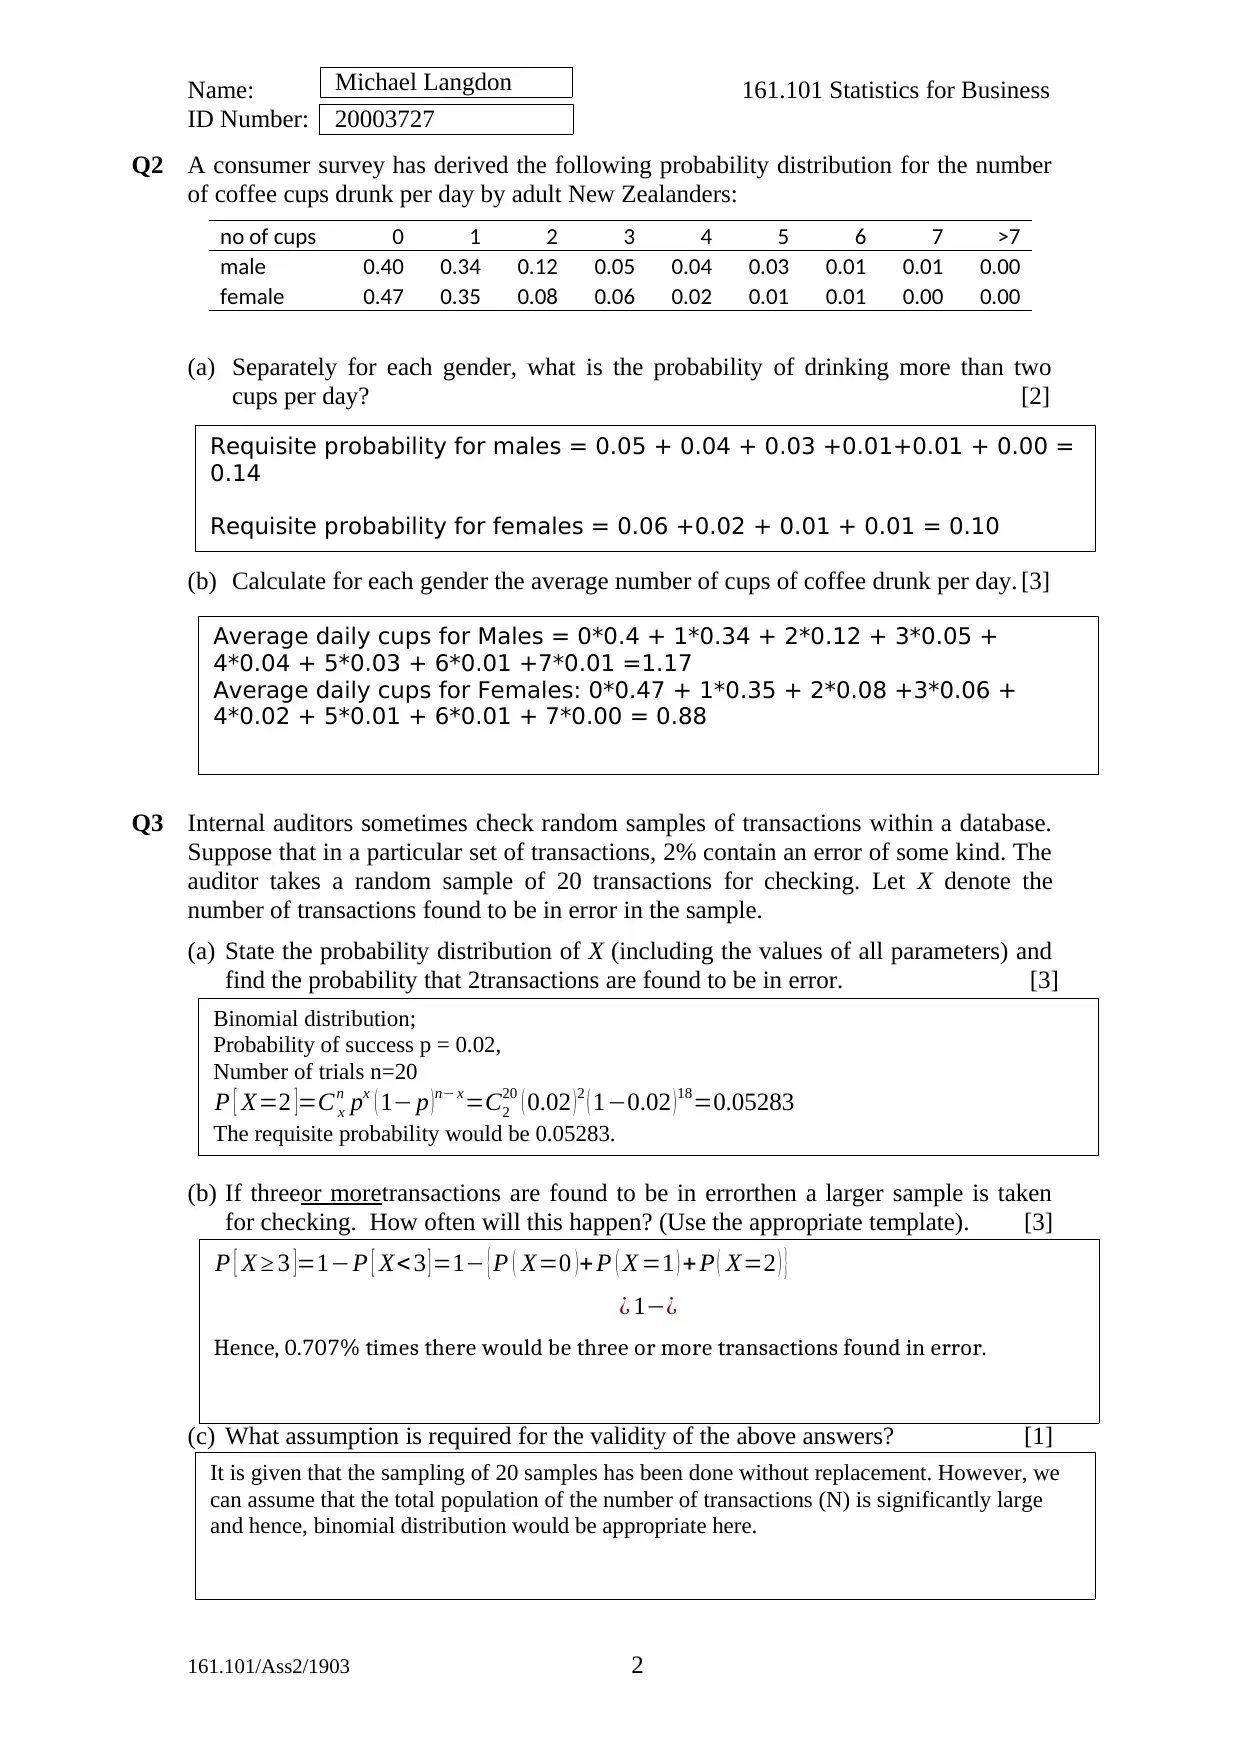
Q2 A consumer survey has derived the following probability distribution for the number
of coffee cups drunk per day by adult New Zealanders:
no of cups 0 1 2 3 4 5 6 7 >7
male 0.40 0.34 0.12 0.05 0.04 0.03 0.01 0.01 0.00
female 0.47 0.35 0.08 0.06 0.02 0.01 0.01 0.00 0.00
(a) Separately for each gender, what is the probability of drinking more than two
cups per day? [2]
(b) Calculate for each gender the average number of cups of coffee drunk per day. [3]
Q3 Internal auditors sometimes check random samples of transactions within a database.
Suppose that in a particular set of transactions, 2% contain an error of some kind. The
auditor takes a random sample of 20 transactions for checking. Let X denote the
number of transactions found to be in error in the sample.
(a) State the probability distribution of X (including the values of all parameters) and
find the probability that 2transactions are found to be in error. [3]
(b) If threeor moretransactions are found to be in errorthen a larger sample is taken
for checking. How often will this happen? (Use the appropriate template). [3]
(c) What assumption is required for the validity of the above answers? [1]
161.101/Ass2/1903 2
Requisite probability for males = 0.05 + 0.04 + 0.03 +0.01+0.01 + 0.00 =
0.14
Requisite probability for females = 0.06 +0.02 + 0.01 + 0.01 = 0.10
Average daily cups for Males = 0*0.4 + 1*0.34 + 2*0.12 + 3*0.05 +
4*0.04 + 5*0.03 + 6*0.01 +7*0.01 =1.17
Average daily cups for Females: 0*0.47 + 1*0.35 + 2*0.08 +3*0.06 +
4*0.02 + 5*0.01 + 6*0.01 + 7*0.00 = 0.88
Binomial distribution;
Probability of success p = 0.02,
Number of trials n=20
P [ X=2 ]=C x
n px ( 1− p ) n− x=C2
20 ( 0.02 ) 2 ( 1−0.02 ) 18=0.05283
The requisite probability would be 0.05283.
P [ X ≥ 3 ]=1−P [ X< 3 ] =1− { P ( X=0 ) + P ( X =1 ) + P ( X=2 ) }
¿ 1−¿
Hence, 0.707% times there would be three or more transactions found in error.
It is given that the sampling of 20 samples has been done without replacement. However, we
can assume that the total population of the number of transactions (N) is significantly large
and hence, binomial distribution would be appropriate here.
20003727
Name: 161.101 Statistics for Business
ID Number:
Q2 A consumer survey has derived the following probability distribution for the number
of coffee cups drunk per day by adult New Zealanders:
no of cups 0 1 2 3 4 5 6 7 >7
male 0.40 0.34 0.12 0.05 0.04 0.03 0.01 0.01 0.00
female 0.47 0.35 0.08 0.06 0.02 0.01 0.01 0.00 0.00
(a) Separately for each gender, what is the probability of drinking more than two
cups per day? [2]
(b) Calculate for each gender the average number of cups of coffee drunk per day. [3]
Q3 Internal auditors sometimes check random samples of transactions within a database.
Suppose that in a particular set of transactions, 2% contain an error of some kind. The
auditor takes a random sample of 20 transactions for checking. Let X denote the
number of transactions found to be in error in the sample.
(a) State the probability distribution of X (including the values of all parameters) and
find the probability that 2transactions are found to be in error. [3]
(b) If threeor moretransactions are found to be in errorthen a larger sample is taken
for checking. How often will this happen? (Use the appropriate template). [3]
(c) What assumption is required for the validity of the above answers? [1]
161.101/Ass2/1903 2
Requisite probability for males = 0.05 + 0.04 + 0.03 +0.01+0.01 + 0.00 =
0.14
Requisite probability for females = 0.06 +0.02 + 0.01 + 0.01 = 0.10
Average daily cups for Males = 0*0.4 + 1*0.34 + 2*0.12 + 3*0.05 +
4*0.04 + 5*0.03 + 6*0.01 +7*0.01 =1.17
Average daily cups for Females: 0*0.47 + 1*0.35 + 2*0.08 +3*0.06 +
4*0.02 + 5*0.01 + 6*0.01 + 7*0.00 = 0.88
Binomial distribution;
Probability of success p = 0.02,
Number of trials n=20
P [ X=2 ]=C x
n px ( 1− p ) n− x=C2
20 ( 0.02 ) 2 ( 1−0.02 ) 18=0.05283
The requisite probability would be 0.05283.
P [ X ≥ 3 ]=1−P [ X< 3 ] =1− { P ( X=0 ) + P ( X =1 ) + P ( X=2 ) }
¿ 1−¿
Hence, 0.707% times there would be three or more transactions found in error.
It is given that the sampling of 20 samples has been done without replacement. However, we
can assume that the total population of the number of transactions (N) is significantly large
and hence, binomial distribution would be appropriate here.
Michael Langdon
20003727
Name: 161.101 Statistics for Business
ID Number:
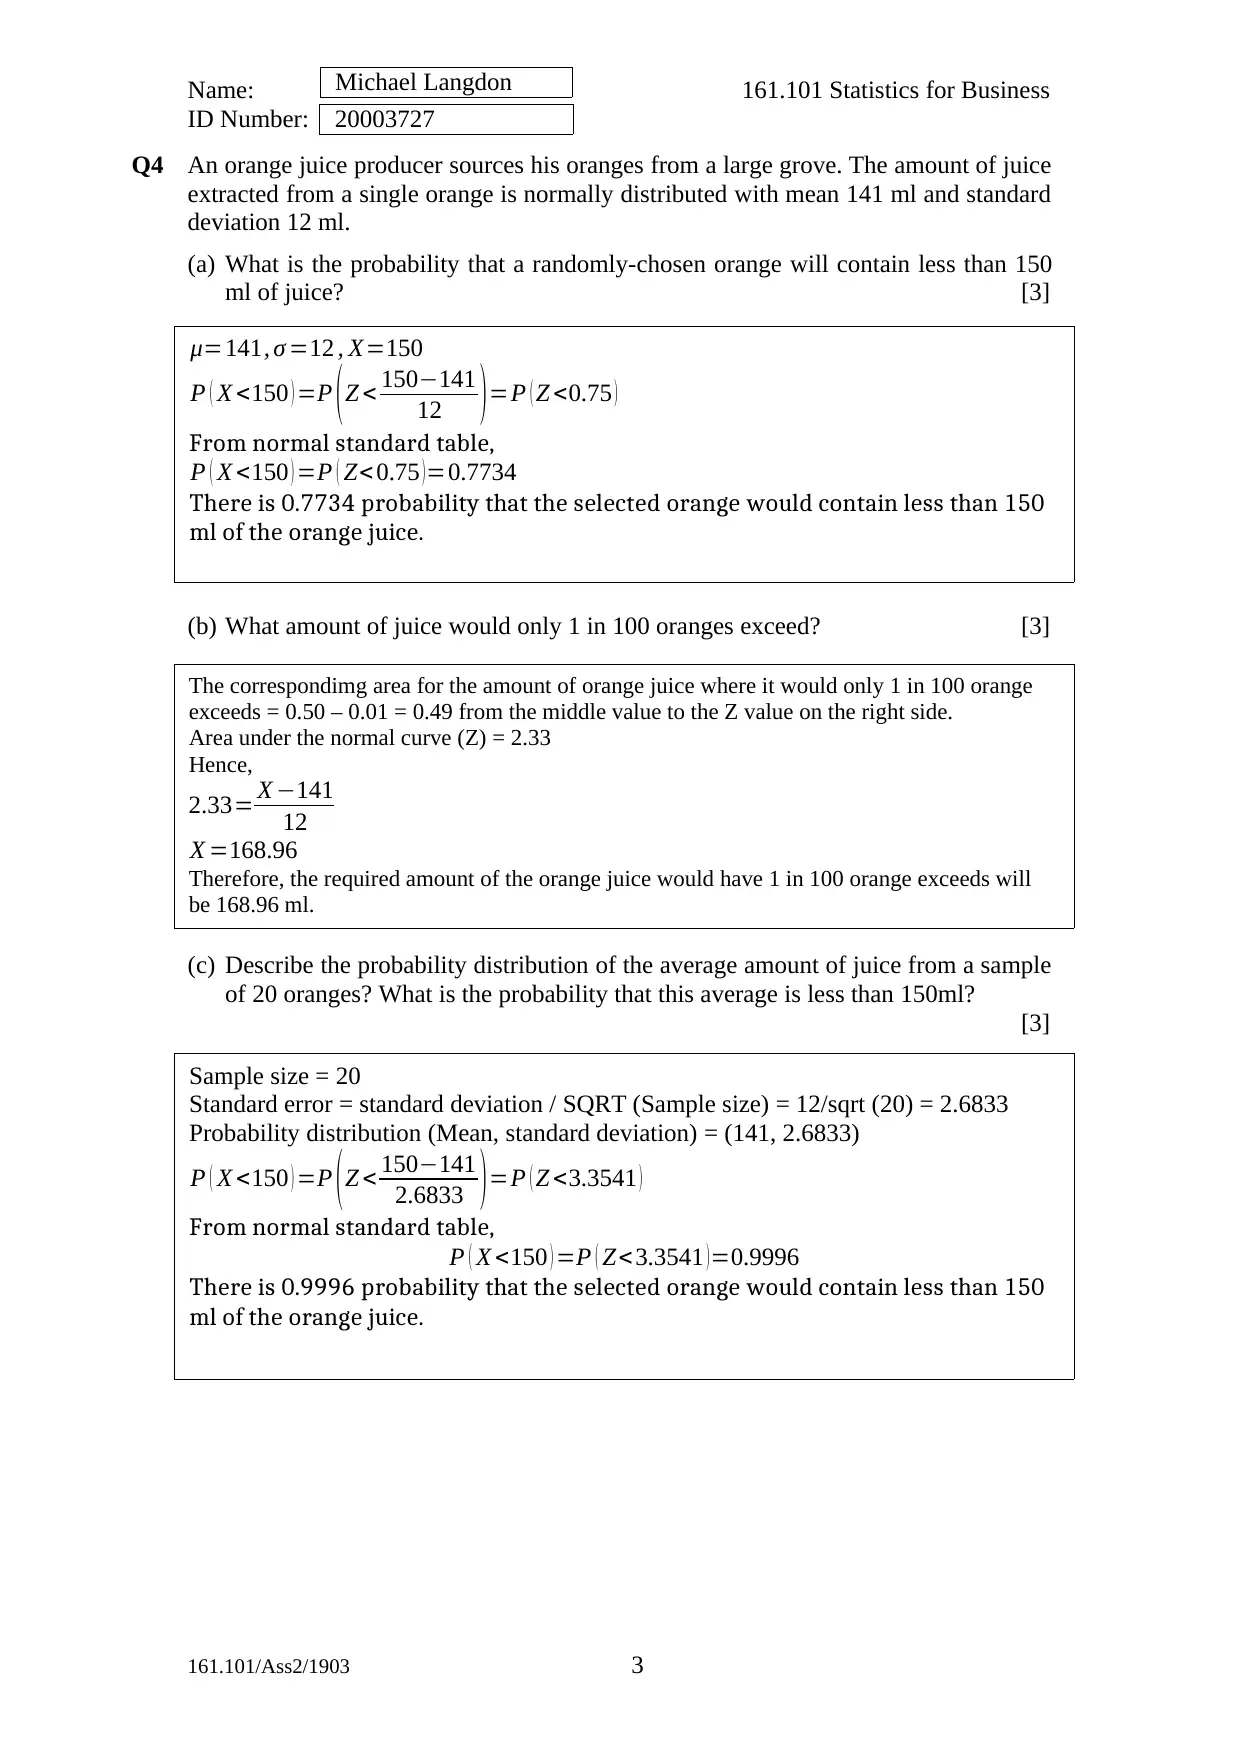
Q4 An orange juice producer sources his oranges from a large grove. The amount of juice
extracted from a single orange is normally distributed with mean 141 ml and standard
deviation 12 ml.
(a) What is the probability that a randomly-chosen orange will contain less than 150
ml of juice? [3]
(b) What amount of juice would only 1 in 100 oranges exceed? [3]
(c) Describe the probability distribution of the average amount of juice from a sample
of 20 oranges? What is the probability that this average is less than 150ml?
[3]
161.101/Ass2/1903 3
μ=141, σ =12 , X=150
P ( X <150 ) =P (Z < 150−141
12 )=P ( Z <0.75 )
From normal standard table,
P ( X <150 ) =P ( Z< 0.75 ) =0.7734
There is 0.7734 probability that the selected orange would contain less than 150
ml of the orange juice.
The correspondimg area for the amount of orange juice where it would only 1 in 100 orange
exceeds = 0.50 – 0.01 = 0.49 from the middle value to the Z value on the right side.
Area under the normal curve (Z) = 2.33
Hence,
2.33= X −141
12
X =168.96
Therefore, the required amount of the orange juice would have 1 in 100 orange exceeds will
be 168.96 ml.
Sample size = 20
Standard error = standard deviation / SQRT (Sample size) = 12/sqrt (20) = 2.6833
Probability distribution (Mean, standard deviation) = (141, 2.6833)
P ( X <150 ) =P ( Z < 150−141
2.6833 ) =P ( Z <3.3541 )
From normal standard table,
P ( X <150 ) =P ( Z< 3.3541 )=0.9996
There is 0.9996 probability that the selected orange would contain less than 150
ml of the orange juice.
20003727
Name: 161.101 Statistics for Business
ID Number:
Q4 An orange juice producer sources his oranges from a large grove. The amount of juice
extracted from a single orange is normally distributed with mean 141 ml and standard
deviation 12 ml.
(a) What is the probability that a randomly-chosen orange will contain less than 150
ml of juice? [3]
(b) What amount of juice would only 1 in 100 oranges exceed? [3]
(c) Describe the probability distribution of the average amount of juice from a sample
of 20 oranges? What is the probability that this average is less than 150ml?
[3]
161.101/Ass2/1903 3
μ=141, σ =12 , X=150
P ( X <150 ) =P (Z < 150−141
12 )=P ( Z <0.75 )
From normal standard table,
P ( X <150 ) =P ( Z< 0.75 ) =0.7734
There is 0.7734 probability that the selected orange would contain less than 150
ml of the orange juice.
The correspondimg area for the amount of orange juice where it would only 1 in 100 orange
exceeds = 0.50 – 0.01 = 0.49 from the middle value to the Z value on the right side.
Area under the normal curve (Z) = 2.33
Hence,
2.33= X −141
12
X =168.96
Therefore, the required amount of the orange juice would have 1 in 100 orange exceeds will
be 168.96 ml.
Sample size = 20
Standard error = standard deviation / SQRT (Sample size) = 12/sqrt (20) = 2.6833
Probability distribution (Mean, standard deviation) = (141, 2.6833)
P ( X <150 ) =P ( Z < 150−141
2.6833 ) =P ( Z <3.3541 )
From normal standard table,
P ( X <150 ) =P ( Z< 3.3541 )=0.9996
There is 0.9996 probability that the selected orange would contain less than 150
ml of the orange juice.
⊘ This is a preview!⊘
Do you want full access?
Subscribe today to unlock all pages.
Trusted by 1+ million students worldwide
Michael Langdon
20003727
Name: 161.101 Statistics for Business
ID Number:
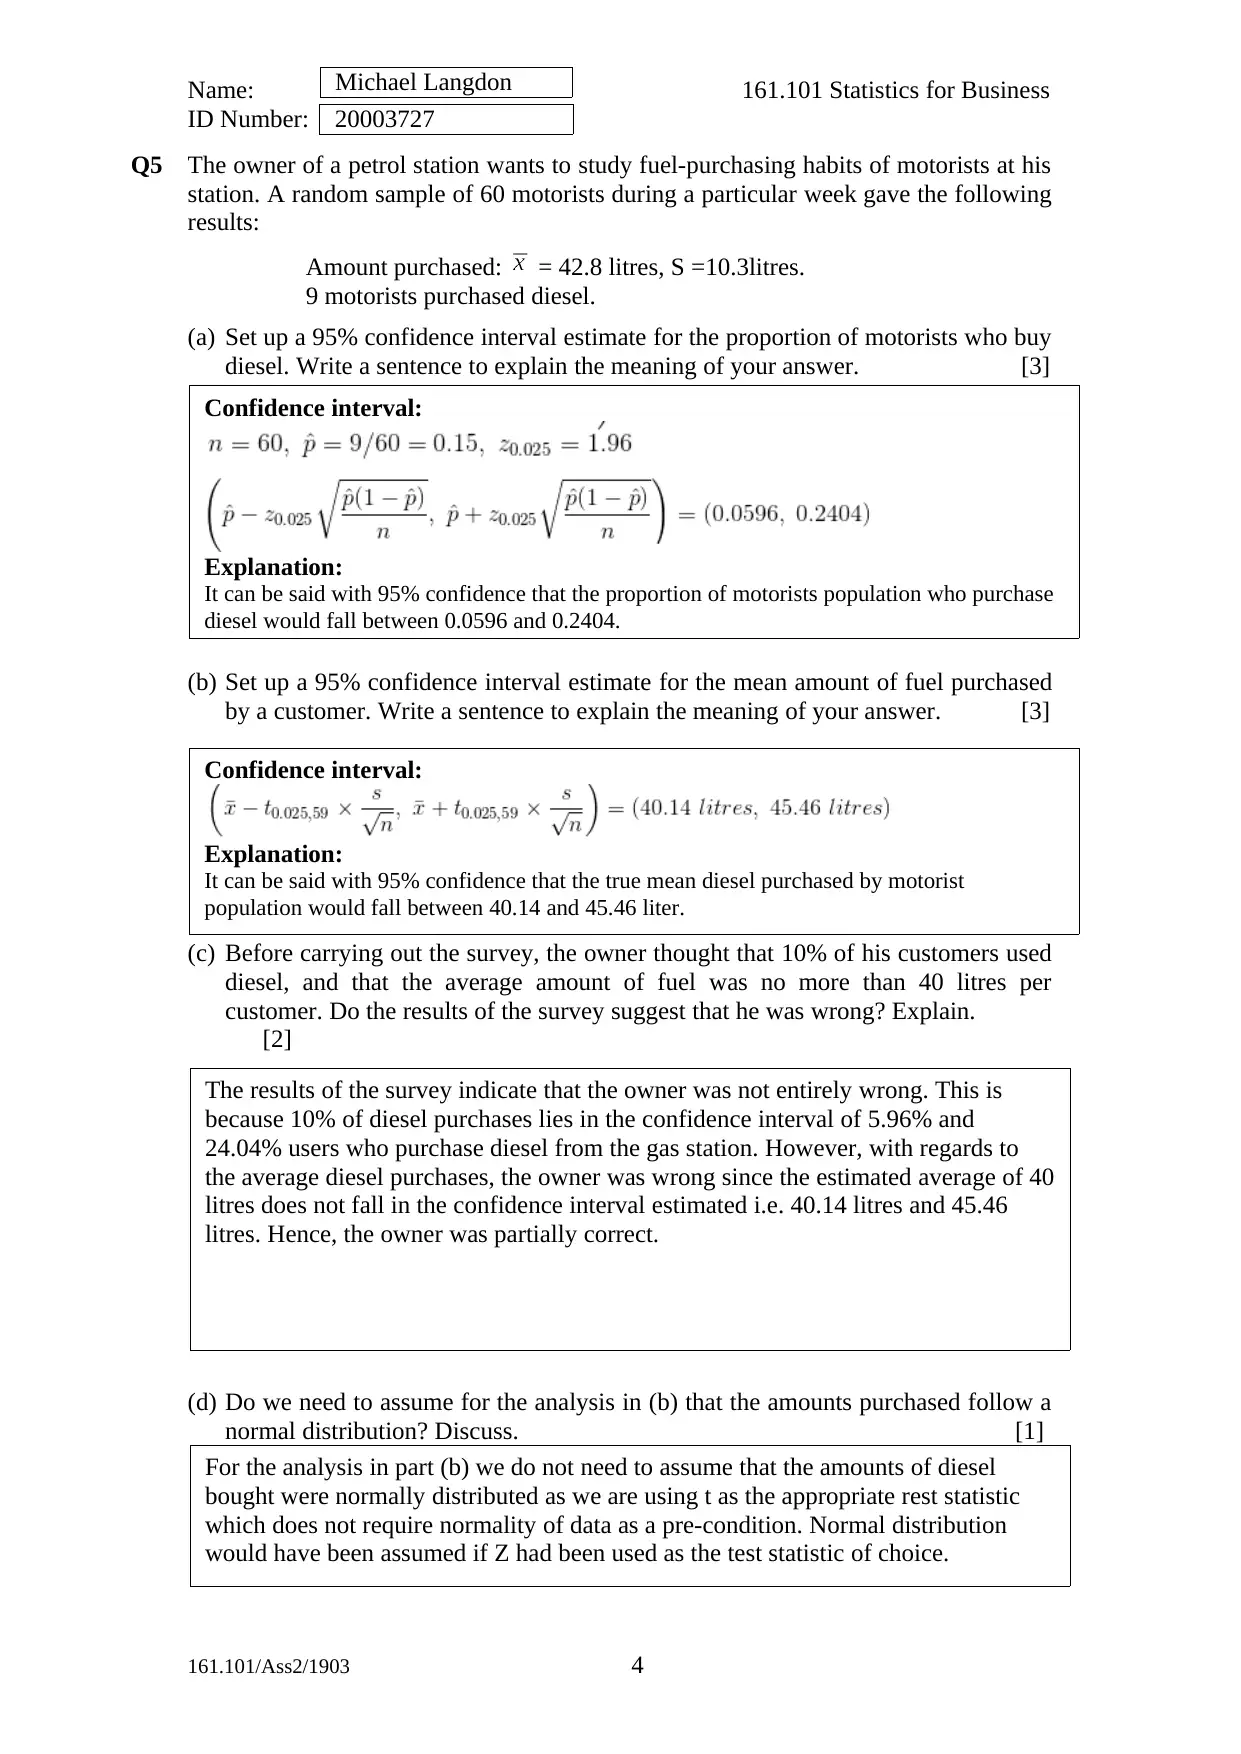
Q5 The owner of a petrol station wants to study fuel-purchasing habits of motorists at his
station. A random sample of 60 motorists during a particular week gave the following
results:
Amount purchased: = 42.8 litres, S =10.3litres.
9 motorists purchased diesel.
(a) Set up a 95% confidence interval estimate for the proportion of motorists who buy
diesel. Write a sentence to explain the meaning of your answer. [3]
(b) Set up a 95% confidence interval estimate for the mean amount of fuel purchased
by a customer. Write a sentence to explain the meaning of your answer. [3]
(c) Before carrying out the survey, the owner thought that 10% of his customers used
diesel, and that the average amount of fuel was no more than 40 litres per
customer. Do the results of the survey suggest that he was wrong? Explain.
[2]
+ + + + + + +
(d) Do we need to assume for the analysis in (b) that the amounts purchased follow a
normal distribution? Discuss. [1]
161.101/Ass2/1903 4
Confidence interval:
Explanation:
It can be said with 95% confidence that the proportion of motorists population who purchase
diesel would fall between 0.0596 and 0.2404.
Confidence interval:
Explanation:
It can be said with 95% confidence that the true mean diesel purchased by motorist
population would fall between 40.14 and 45.46 liter.
The results of the survey indicate that the owner was not entirely wrong. This is
because 10% of diesel purchases lies in the confidence interval of 5.96% and
24.04% users who purchase diesel from the gas station. However, with regards to
the average diesel purchases, the owner was wrong since the estimated average of 40
litres does not fall in the confidence interval estimated i.e. 40.14 litres and 45.46
litres. Hence, the owner was partially correct.
For the analysis in part (b) we do not need to assume that the amounts of diesel
bought were normally distributed as we are using t as the appropriate rest statistic
which does not require normality of data as a pre-condition. Normal distribution
would have been assumed if Z had been used as the test statistic of choice.
20003727
Name: 161.101 Statistics for Business
ID Number:
Q5 The owner of a petrol station wants to study fuel-purchasing habits of motorists at his
station. A random sample of 60 motorists during a particular week gave the following
results:
Amount purchased: = 42.8 litres, S =10.3litres.
9 motorists purchased diesel.
(a) Set up a 95% confidence interval estimate for the proportion of motorists who buy
diesel. Write a sentence to explain the meaning of your answer. [3]
(b) Set up a 95% confidence interval estimate for the mean amount of fuel purchased
by a customer. Write a sentence to explain the meaning of your answer. [3]
(c) Before carrying out the survey, the owner thought that 10% of his customers used
diesel, and that the average amount of fuel was no more than 40 litres per
customer. Do the results of the survey suggest that he was wrong? Explain.
[2]
+ + + + + + +
(d) Do we need to assume for the analysis in (b) that the amounts purchased follow a
normal distribution? Discuss. [1]
161.101/Ass2/1903 4
Confidence interval:
Explanation:
It can be said with 95% confidence that the proportion of motorists population who purchase
diesel would fall between 0.0596 and 0.2404.
Confidence interval:
Explanation:
It can be said with 95% confidence that the true mean diesel purchased by motorist
population would fall between 40.14 and 45.46 liter.
The results of the survey indicate that the owner was not entirely wrong. This is
because 10% of diesel purchases lies in the confidence interval of 5.96% and
24.04% users who purchase diesel from the gas station. However, with regards to
the average diesel purchases, the owner was wrong since the estimated average of 40
litres does not fall in the confidence interval estimated i.e. 40.14 litres and 45.46
litres. Hence, the owner was partially correct.
For the analysis in part (b) we do not need to assume that the amounts of diesel
bought were normally distributed as we are using t as the appropriate rest statistic
which does not require normality of data as a pre-condition. Normal distribution
would have been assumed if Z had been used as the test statistic of choice.
Paraphrase This Document
Need a fresh take? Get an instant paraphrase of this document with our AI Paraphraser
Michael Langdon
20003727
Name: 161.101 Statistics for Business
ID Number:
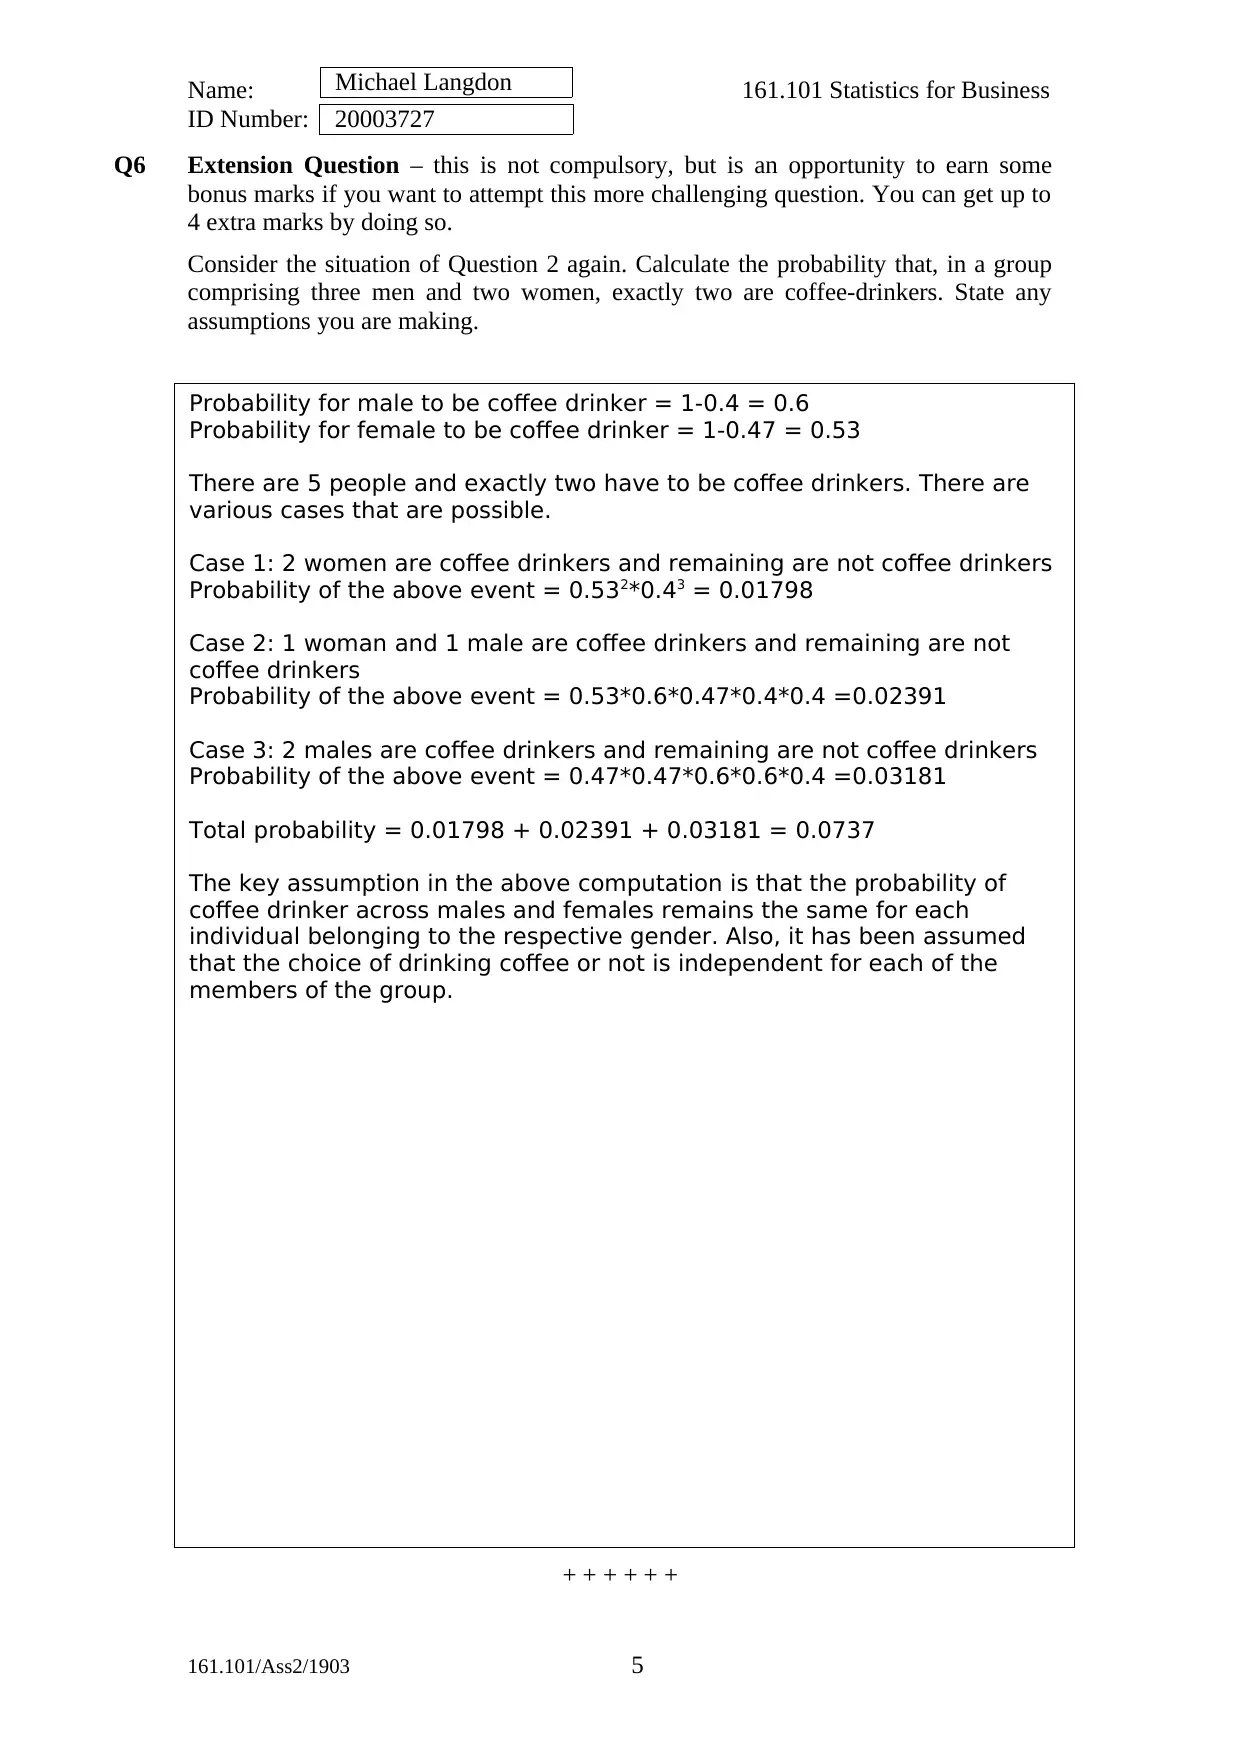
Q6 Extension Question – this is not compulsory, but is an opportunity to earn some
bonus marks if you want to attempt this more challenging question. You can get up to
4 extra marks by doing so.
Consider the situation of Question 2 again. Calculate the probability that, in a group
comprising three men and two women, exactly two are coffee-drinkers. State any
assumptions you are making.
+ + + + + + +
+ + + + + +
161.101/Ass2/1903 5
Probability for male to be coffee drinker = 1-0.4 = 0.6
Probability for female to be coffee drinker = 1-0.47 = 0.53
There are 5 people and exactly two have to be coffee drinkers. There are
various cases that are possible.
Case 1: 2 women are coffee drinkers and remaining are not coffee drinkers
Probability of the above event = 0.532*0.43 = 0.01798
Case 2: 1 woman and 1 male are coffee drinkers and remaining are not
coffee drinkers
Probability of the above event = 0.53*0.6*0.47*0.4*0.4 =0.02391
Case 3: 2 males are coffee drinkers and remaining are not coffee drinkers
Probability of the above event = 0.47*0.47*0.6*0.6*0.4 =0.03181
Total probability = 0.01798 + 0.02391 + 0.03181 = 0.0737
The key assumption in the above computation is that the probability of
coffee drinker across males and females remains the same for each
individual belonging to the respective gender. Also, it has been assumed
that the choice of drinking coffee or not is independent for each of the
members of the group.
20003727
Name: 161.101 Statistics for Business
ID Number:
Q6 Extension Question – this is not compulsory, but is an opportunity to earn some
bonus marks if you want to attempt this more challenging question. You can get up to
4 extra marks by doing so.
Consider the situation of Question 2 again. Calculate the probability that, in a group
comprising three men and two women, exactly two are coffee-drinkers. State any
assumptions you are making.
+ + + + + + +
+ + + + + +
161.101/Ass2/1903 5
Probability for male to be coffee drinker = 1-0.4 = 0.6
Probability for female to be coffee drinker = 1-0.47 = 0.53
There are 5 people and exactly two have to be coffee drinkers. There are
various cases that are possible.
Case 1: 2 women are coffee drinkers and remaining are not coffee drinkers
Probability of the above event = 0.532*0.43 = 0.01798
Case 2: 1 woman and 1 male are coffee drinkers and remaining are not
coffee drinkers
Probability of the above event = 0.53*0.6*0.47*0.4*0.4 =0.02391
Case 3: 2 males are coffee drinkers and remaining are not coffee drinkers
Probability of the above event = 0.47*0.47*0.6*0.6*0.4 =0.03181
Total probability = 0.01798 + 0.02391 + 0.03181 = 0.0737
The key assumption in the above computation is that the probability of
coffee drinker across males and females remains the same for each
individual belonging to the respective gender. Also, it has been assumed
that the choice of drinking coffee or not is independent for each of the
members of the group.
1 out of 5
Your All-in-One AI-Powered Toolkit for Academic Success.
+13062052269
info@desklib.com
Available 24*7 on WhatsApp / Email
![[object Object]](/_next/static/media/star-bottom.7253800d.svg)
Unlock your academic potential
Copyright © 2020–2026 A2Z Services. All Rights Reserved. Developed and managed by ZUCOL.