Statistics for Management: Statistical Data Analysis Report, 2024
VerifiedAdded on 2020/11/23
|23
|4220
|39
Report
AI Summary
This report provides a comprehensive analysis of statistical tools and their application in management. It begins with an introduction to statistics and its importance in business, followed by an analysis of national statistical data, including CPI and RPI indices, and a comparison of their differences. The report then delves into graphical and tabular representations of data from the Office of National Statistics, illustrating trends in inflation and price changes. Activity 2 focuses on the use of ogive curves, median hourly earnings, quartiles, mean, and standard deviation to analyze data from London and Manchester areas. The report further explores the concept of economic order quantity in Activity 3 and assesses the requirements for reordering T-shirts, inventory policy costs, and service levels. Finally, Activity 4 examines the production line of the Office of National Statistics and produces an ogive for cumulative staff percentage versus hourly earnings. The report concludes with a summary of the findings and a list of references.
STATISTICS FOR
MANAGEMENT
MANAGEMENT
Paraphrase This Document
Need a fresh take? Get an instant paraphrase of this document with our AI Paraphraser
Table of Contents
INTRODUCTION...........................................................................................................................3
ACTIVITY 1....................................................................................................................................3
a) National Statistical Data..........................................................................................................3
b) Graphical and tabular representation of data acquired form Office of National Statistics.....6
c) Differences between CPI, CPIH and RPI Indices...................................................................8
d) Use of data collected form CPI subject to evaluate the annual inflation................................8
e) Importance of rate of inflation and requirement.....................................................................8
ACTIVITY 2....................................................................................................................................9
a) Use of ogive and median hourly earnings and the quartiles, mean and standard deviation. . .9
b) Mean and standard deviation for hourly earnings of London area.......................................11
c) Comparison of earning of London and Manchester area......................................................13
ACTIVITY 3..................................................................................................................................13
a) Evaluation of economic order quantity.................................................................................13
b) Assessment of requirement of re-ordering T-Shirts.............................................................15
c) The inventory policy cost......................................................................................................15
d) Current service level to the customers..................................................................................16
e) Work out for the reorder level to accomplishment of desired service level.........................16
ACTIVITY 4..................................................................................................................................16
a) The Office of the National Statistics produce line................................................................16
b) Data used form activity 2 to produce an ogive for cumulative % of staff vs hourly earnings
...................................................................................................................................................18
CONSLUSION..............................................................................................................................18
REFERENCES..............................................................................................................................19
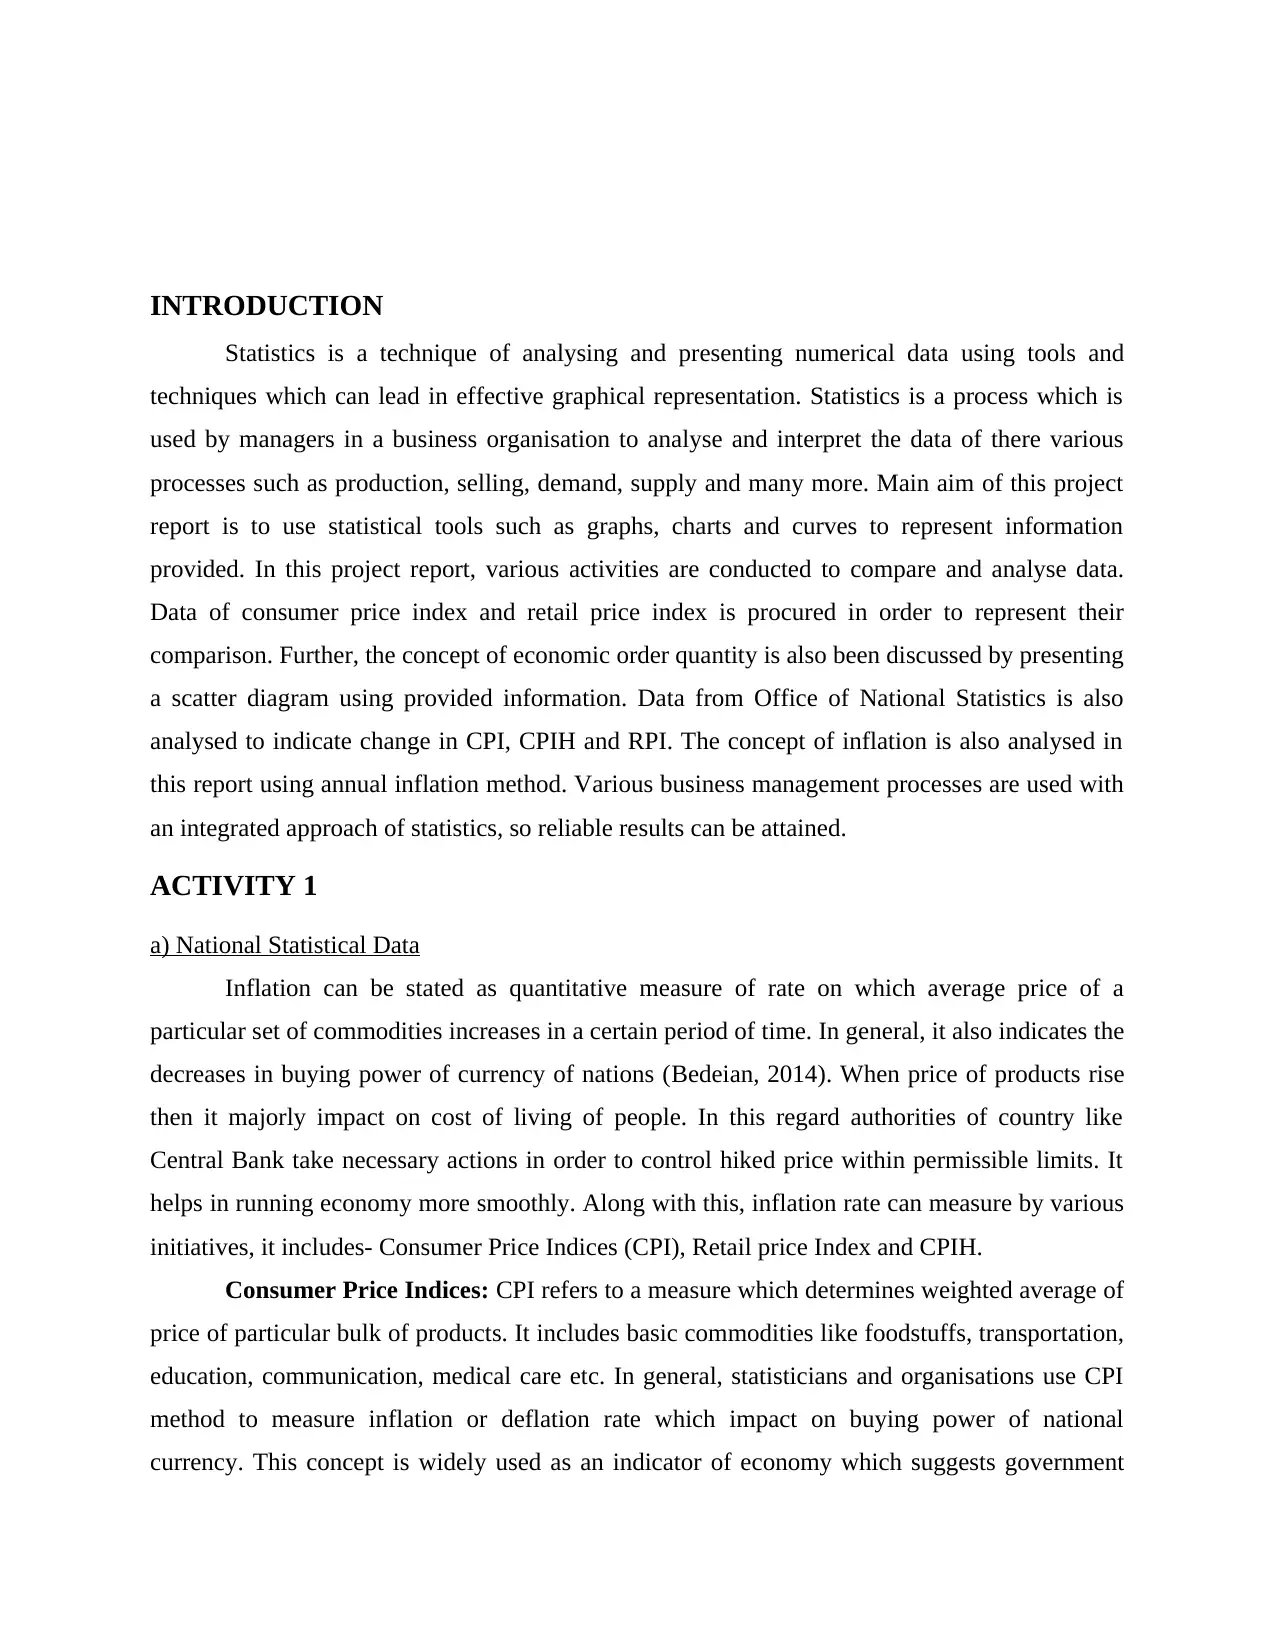
INTRODUCTION
Statistics is a technique of analysing and presenting numerical data using tools and
techniques which can lead in effective graphical representation. Statistics is a process which is
used by managers in a business organisation to analyse and interpret the data of there various
processes such as production, selling, demand, supply and many more. Main aim of this project
report is to use statistical tools such as graphs, charts and curves to represent information
provided. In this project report, various activities are conducted to compare and analyse data.
Data of consumer price index and retail price index is procured in order to represent their
comparison. Further, the concept of economic order quantity is also been discussed by presenting
a scatter diagram using provided information. Data from Office of National Statistics is also
analysed to indicate change in CPI, CPIH and RPI. The concept of inflation is also analysed in
this report using annual inflation method. Various business management processes are used with
an integrated approach of statistics, so reliable results can be attained.
ACTIVITY 1
a) National Statistical Data
Inflation can be stated as quantitative measure of rate on which average price of a
particular set of commodities increases in a certain period of time. In general, it also indicates the
decreases in buying power of currency of nations (Bedeian, 2014). When price of products rise
then it majorly impact on cost of living of people. In this regard authorities of country like
Central Bank take necessary actions in order to control hiked price within permissible limits. It
helps in running economy more smoothly. Along with this, inflation rate can measure by various
initiatives, it includes- Consumer Price Indices (CPI), Retail price Index and CPIH.
Consumer Price Indices: CPI refers to a measure which determines weighted average of
price of particular bulk of products. It includes basic commodities like foodstuffs, transportation,
education, communication, medical care etc. In general, statisticians and organisations use CPI
method to measure inflation or deflation rate which impact on buying power of national
currency. This concept is widely used as an indicator of economy which suggests government
⊘ This is a preview!⊘
Do you want full access?
Subscribe today to unlock all pages.
Trusted by 1+ million students worldwide
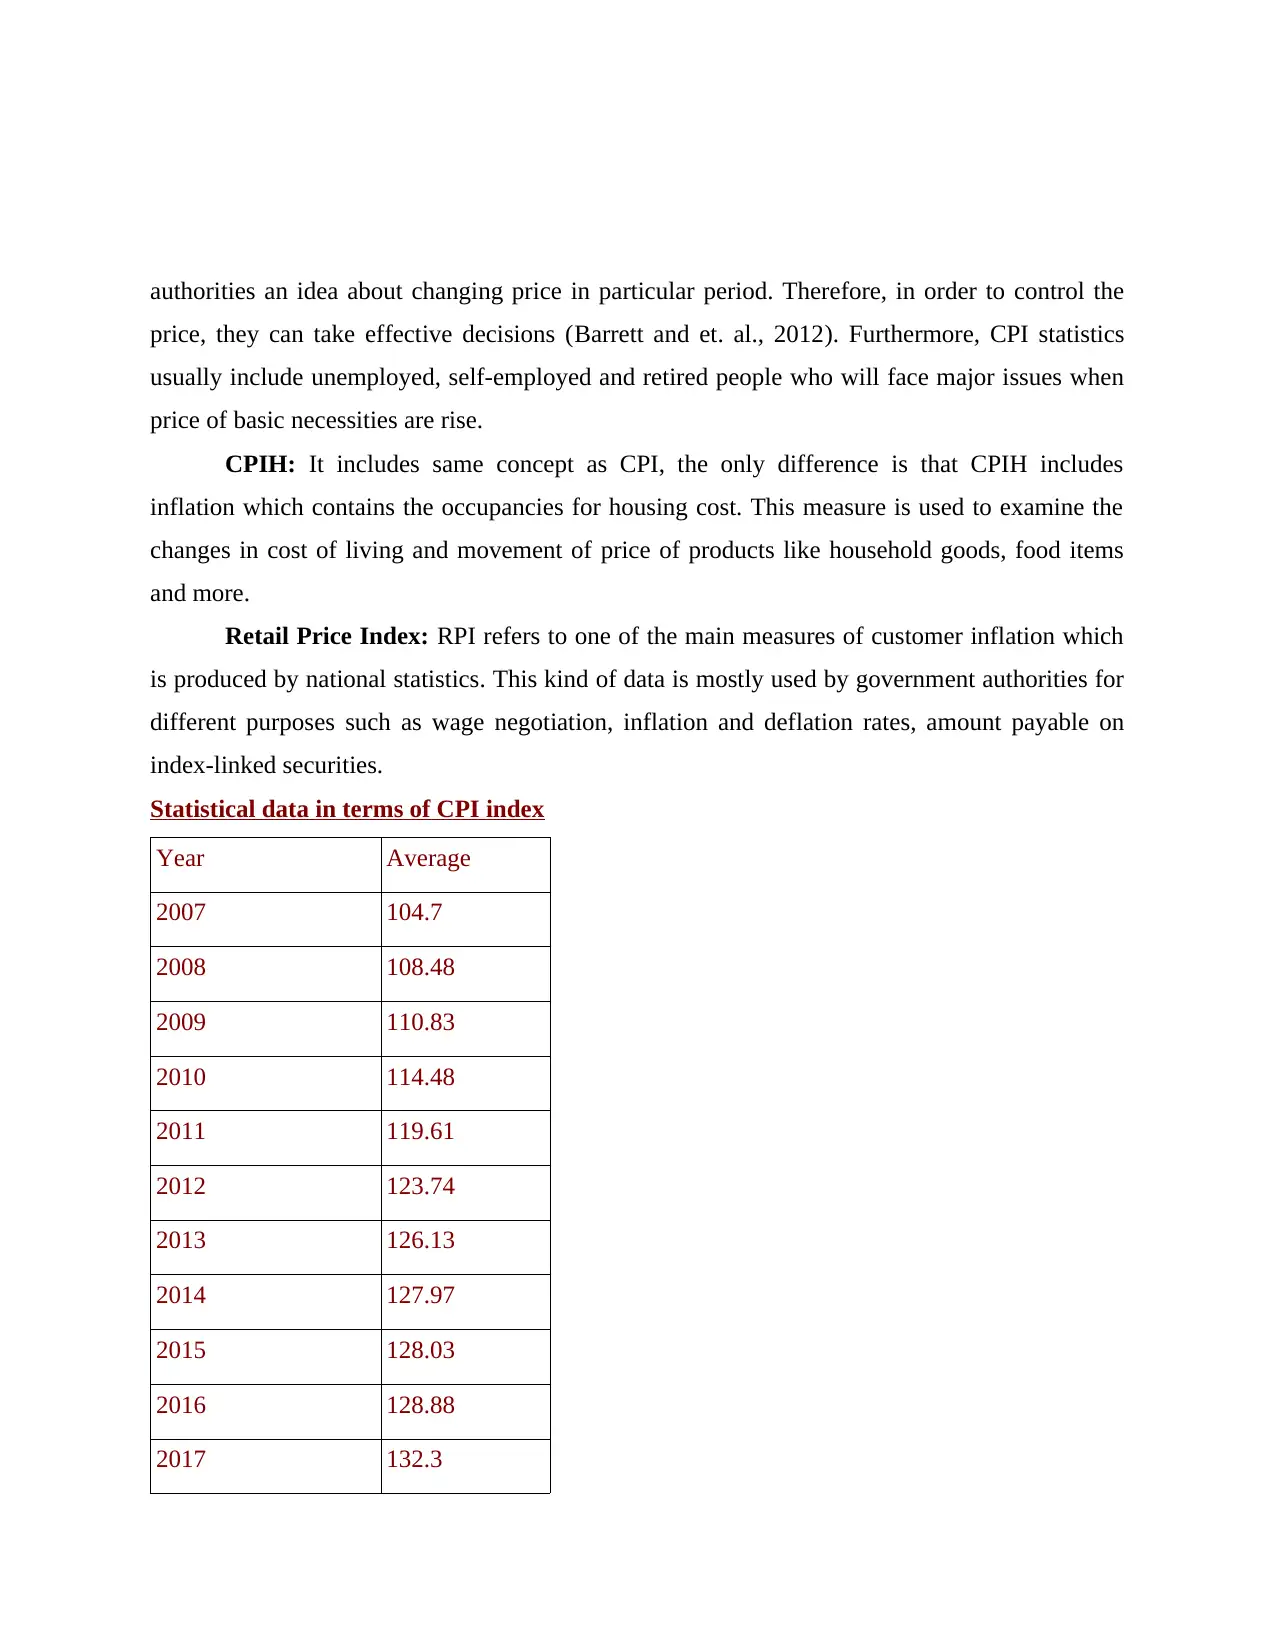
authorities an idea about changing price in particular period. Therefore, in order to control the
price, they can take effective decisions (Barrett and et. al., 2012). Furthermore, CPI statistics
usually include unemployed, self-employed and retired people who will face major issues when
price of basic necessities are rise.
CPIH: It includes same concept as CPI, the only difference is that CPIH includes
inflation which contains the occupancies for housing cost. This measure is used to examine the
changes in cost of living and movement of price of products like household goods, food items
and more.
Retail Price Index: RPI refers to one of the main measures of customer inflation which
is produced by national statistics. This kind of data is mostly used by government authorities for
different purposes such as wage negotiation, inflation and deflation rates, amount payable on
index-linked securities.
Statistical data in terms of CPI index
Year Average
2007 104.7
2008 108.48
2009 110.83
2010 114.48
2011 119.61
2012 123.74
2013 126.13
2014 127.97
2015 128.03
2016 128.88
2017 132.3
Paraphrase This Document
Need a fresh take? Get an instant paraphrase of this document with our AI Paraphraser
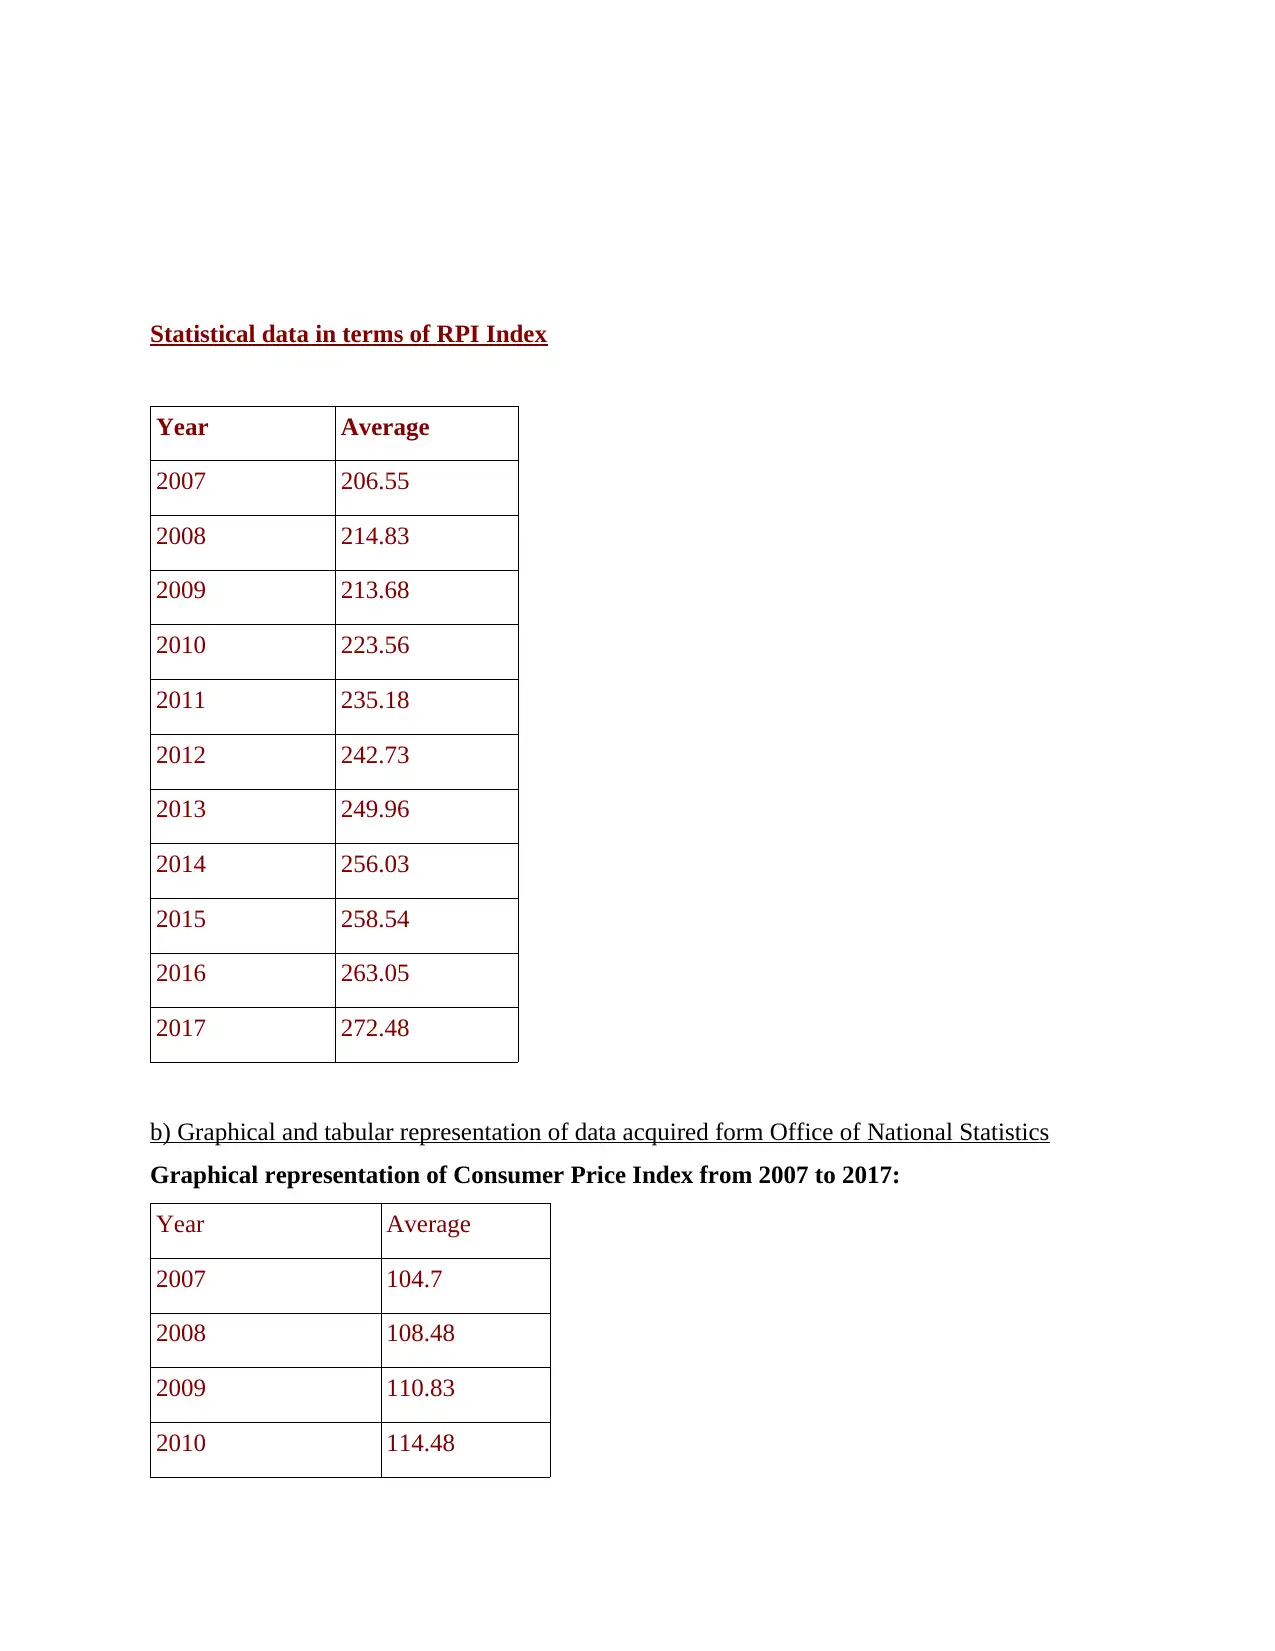
Statistical data in terms of RPI Index
Year Average
2007 206.55
2008 214.83
2009 213.68
2010 223.56
2011 235.18
2012 242.73
2013 249.96
2014 256.03
2015 258.54
2016 263.05
2017 272.48
b) Graphical and tabular representation of data acquired form Office of National Statistics
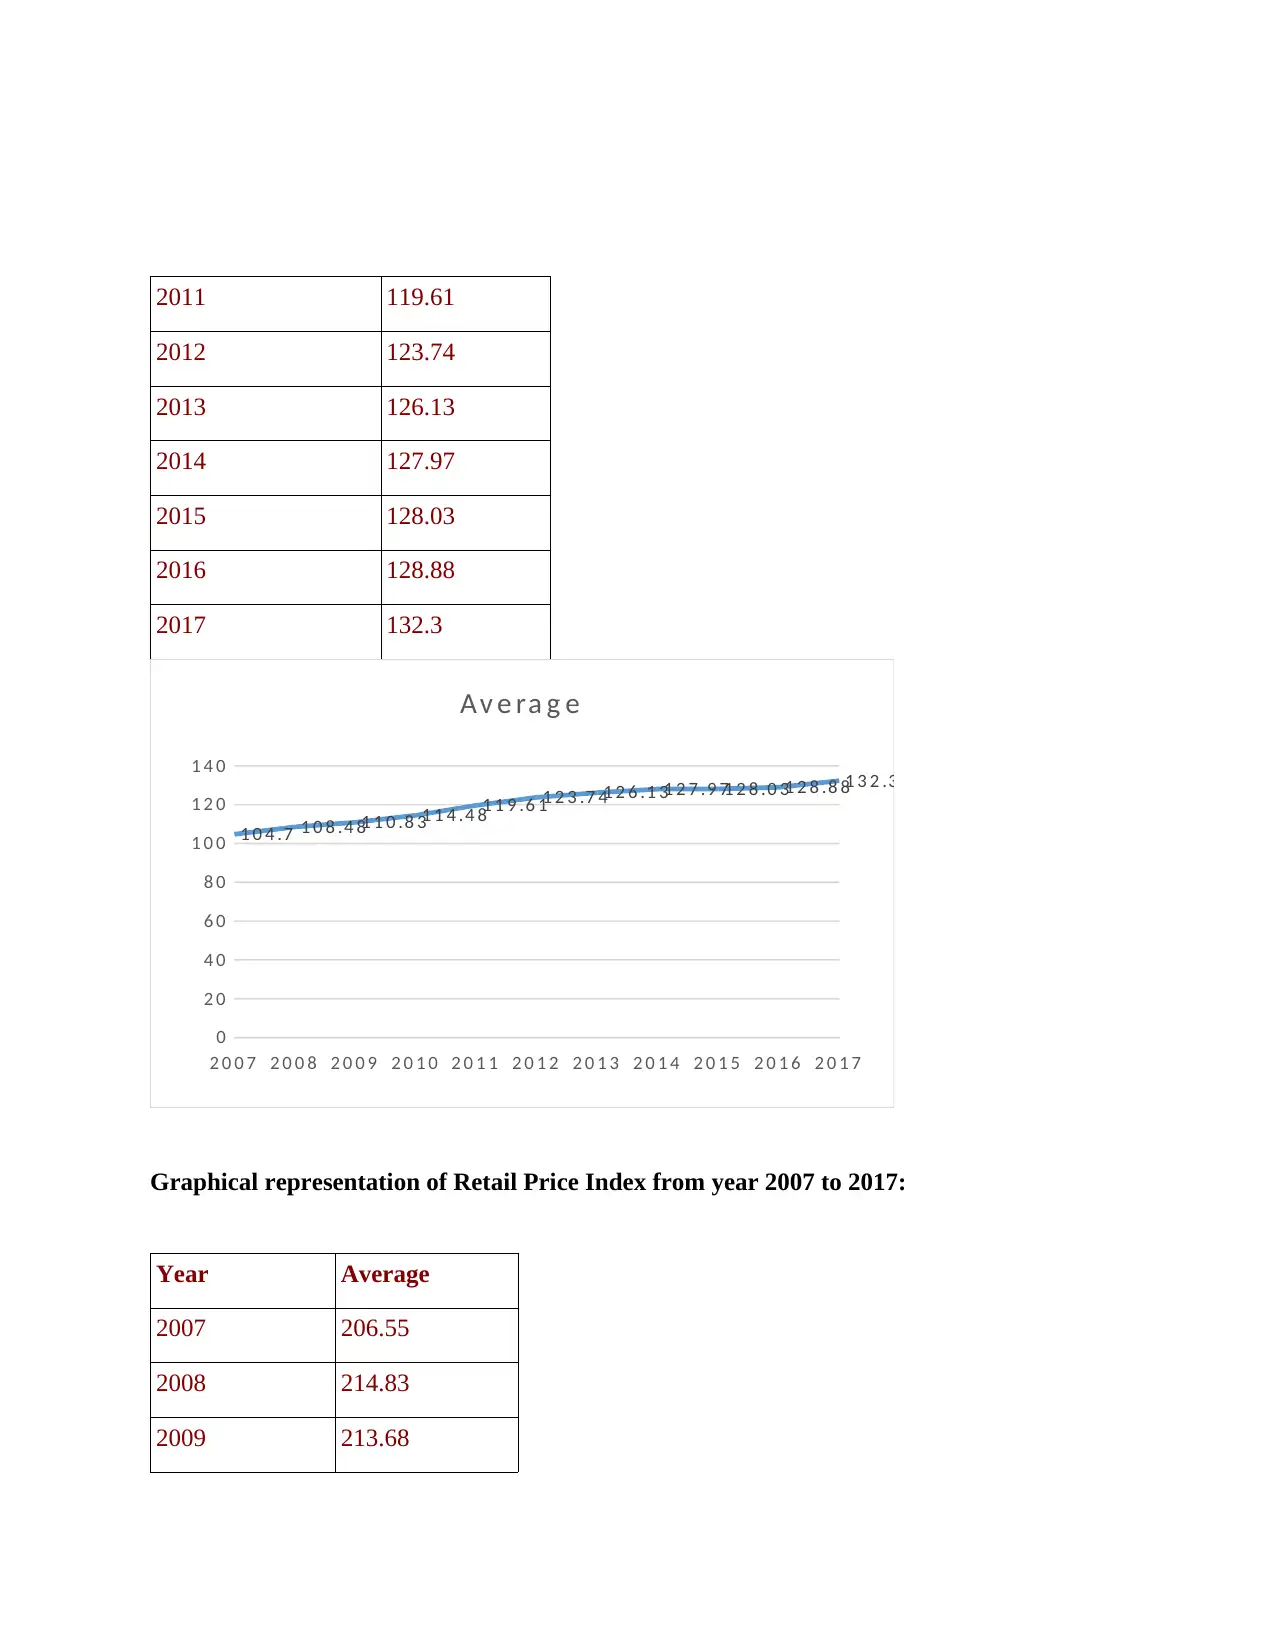
Graphical representation of Consumer Price Index from 2007 to 2017:
Year Average
2007 104.7
2008 108.48
2009 110.83
2010 114.48
Year Average
2007 206.55
2008 214.83
2009 213.68
2010 223.56
2011 235.18
2012 242.73
2013 249.96
2014 256.03
2015 258.54
2016 263.05
2017 272.48
b) Graphical and tabular representation of data acquired form Office of National Statistics
Graphical representation of Consumer Price Index from 2007 to 2017:
Year Average
2007 104.7
2008 108.48
2009 110.83
2010 114.48
2011 119.61
2012 123.74
2013 126.13
2014 127.97
2015 128.03
2016 128.88
2017 132.3
2 0 0 7 2 0 0 8 2 0 0 9 2 0 1 0 2 0 1 1 2 0 1 2 2 0 1 3 2 0 1 4 2 0 1 5 2 0 1 6 2 0 1 7
0
2 0
4 0
6 0
8 0
1 0 0
1 2 0
1 4 0
1 0 4 .7 1 0 8 .4 81 1 0 .8 31 1 4 .4 8
1 1 9 .6 11 2 3 .7 41 2 6 .1 31 2 7 .9 71 2 8 .0 31 2 8 .8 81 3 2 .3
A v e ra g e
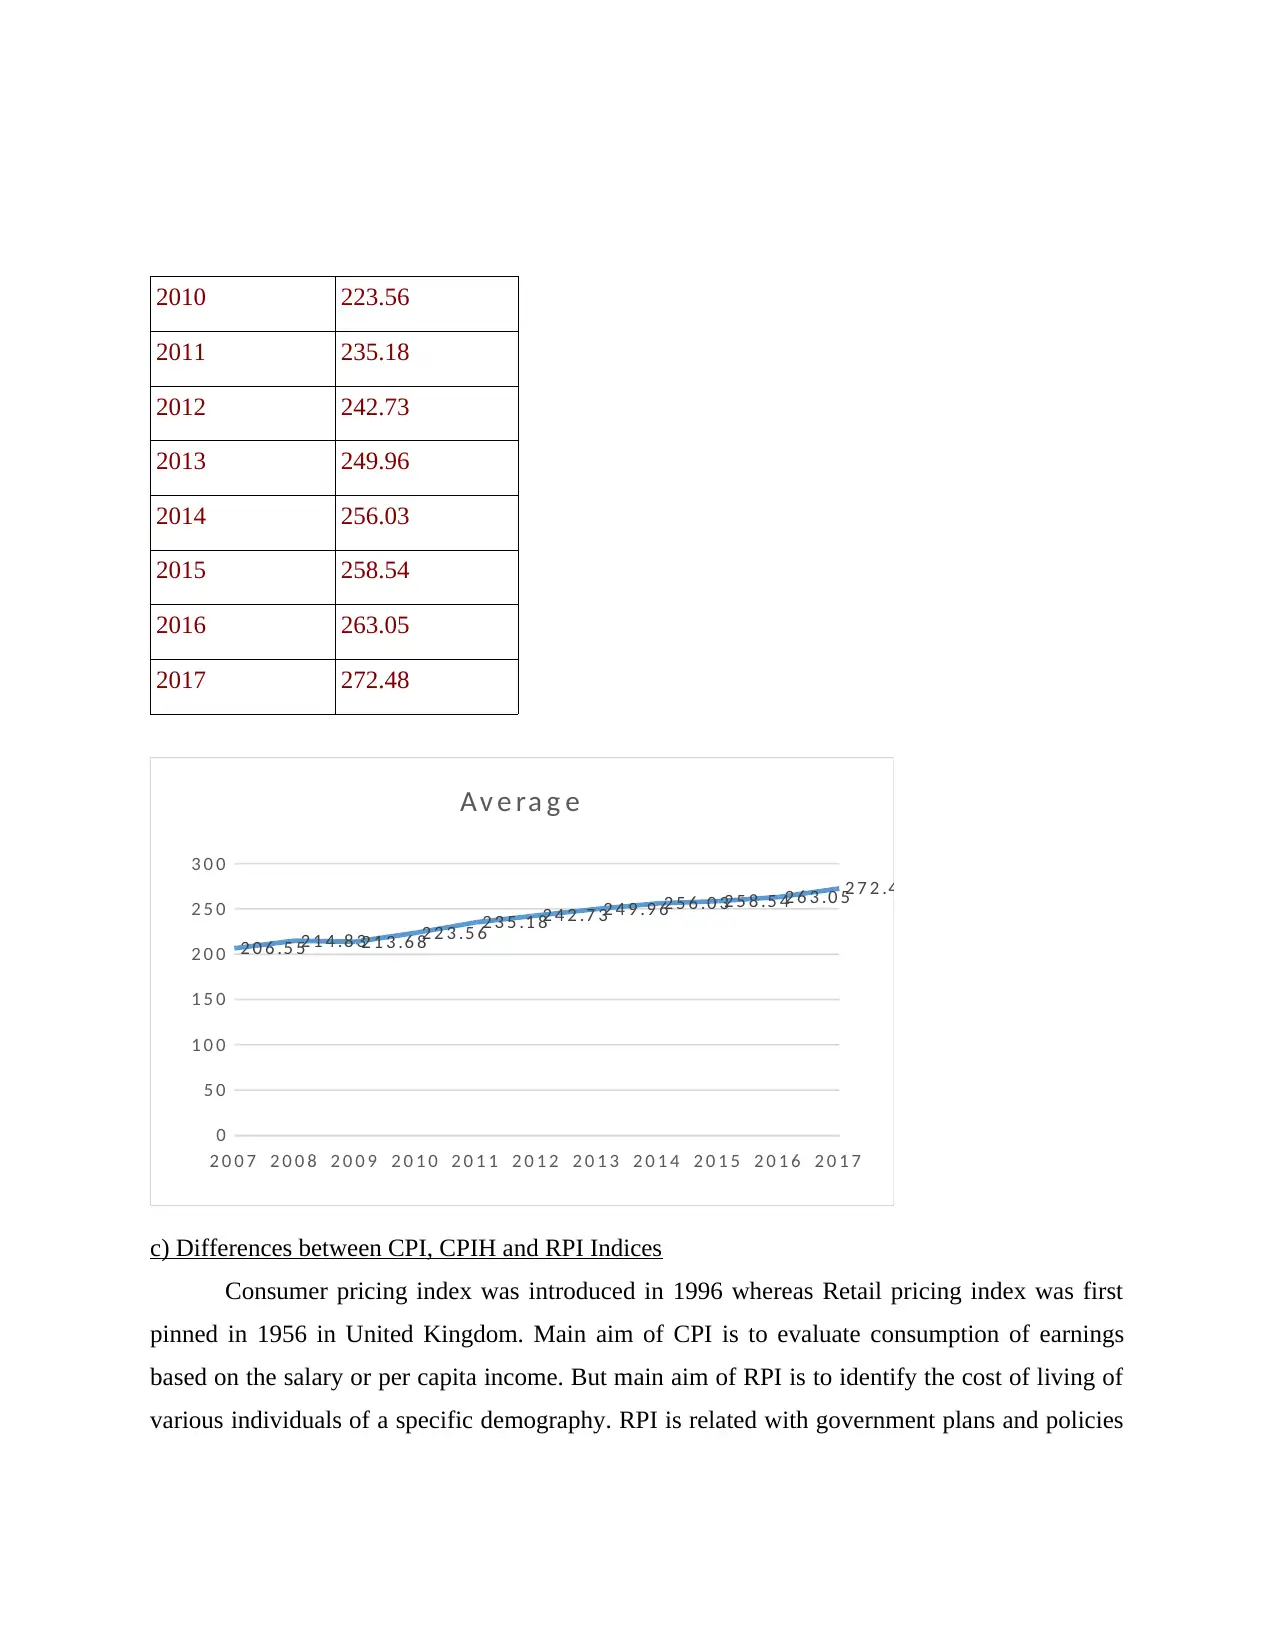
Graphical representation of Retail Price Index from year 2007 to 2017:
Year Average
2007 206.55
2008 214.83
2009 213.68
2012 123.74
2013 126.13
2014 127.97
2015 128.03
2016 128.88
2017 132.3
2 0 0 7 2 0 0 8 2 0 0 9 2 0 1 0 2 0 1 1 2 0 1 2 2 0 1 3 2 0 1 4 2 0 1 5 2 0 1 6 2 0 1 7
0
2 0
4 0
6 0
8 0
1 0 0
1 2 0
1 4 0
1 0 4 .7 1 0 8 .4 81 1 0 .8 31 1 4 .4 8
1 1 9 .6 11 2 3 .7 41 2 6 .1 31 2 7 .9 71 2 8 .0 31 2 8 .8 81 3 2 .3
A v e ra g e
Graphical representation of Retail Price Index from year 2007 to 2017:
Year Average
2007 206.55
2008 214.83
2009 213.68
⊘ This is a preview!⊘
Do you want full access?
Subscribe today to unlock all pages.
Trusted by 1+ million students worldwide
2010 223.56
2011 235.18
2012 242.73
2013 249.96
2014 256.03
2015 258.54
2016 263.05
2017 272.48
2 0 0 7 2 0 0 8 2 0 0 9 2 0 1 0 2 0 1 1 2 0 1 2 2 0 1 3 2 0 1 4 2 0 1 5 2 0 1 6 2 0 1 7
0
5 0
1 0 0
1 5 0
2 0 0
2 5 0
3 0 0
2 0 6 .5 52 1 4 .8 32 1 3 .6 82 2 3 .5 6
2 3 5 .1 82 4 2 .7 32 4 9 .9 62 5 6 .0 32 5 8 .5 42 6 3 .0 52 7 2 .4 8
A v e ra g e
c) Differences between CPI, CPIH and RPI Indices
Consumer pricing index was introduced in 1996 whereas Retail pricing index was first
pinned in 1956 in United Kingdom. Main aim of CPI is to evaluate consumption of earnings
based on the salary or per capita income. But main aim of RPI is to identify the cost of living of
various individuals of a specific demography. RPI is related with government plans and policies
Paraphrase This Document
Need a fresh take? Get an instant paraphrase of this document with our AI Paraphraser
whereas CPI has no interference of these policies. In the case of CPI, data is sourced using
household information whereas information for RPI is used from office of national survey.
d) Use of data collected form CPI subject to evaluate the annual inflation
CPI plays an important role in measuring the inflation rate of nation’s economy. For this
process, statisticians analyse the data in appropriate manner, to create cost of living index.
Indexation is a process of ascertaining impact of inflation on society. Data which is collected of
CPI is used to evaluate annual inflation as it can help in identifying consumer pricing.
e) Importance of rate of inflation and requirement
Price rise is considered as main root of inflation which can be classified into three main
aspects. It includes Built-in, Cost-push and Demand-pull inflation, all of which majorly affects
cost of living index (Andreeva and Kianto, 2012). When demand of a particular commodity is
increased more rapidly as compared to production capacity than under this condition, it is known
as Demand-pull inflation. It also creates a large gap between supply and demand factors which
leads to increase price also. In contrast, Cost-push inflation occurs when production capacity
increases more than demand which contributes to increase cost of finished products. Other than
this, Built-in inflation covers adaptive expectations where labour demands more wages for
maintaining cost of living with increase in price of products.
ACTIVITY 2
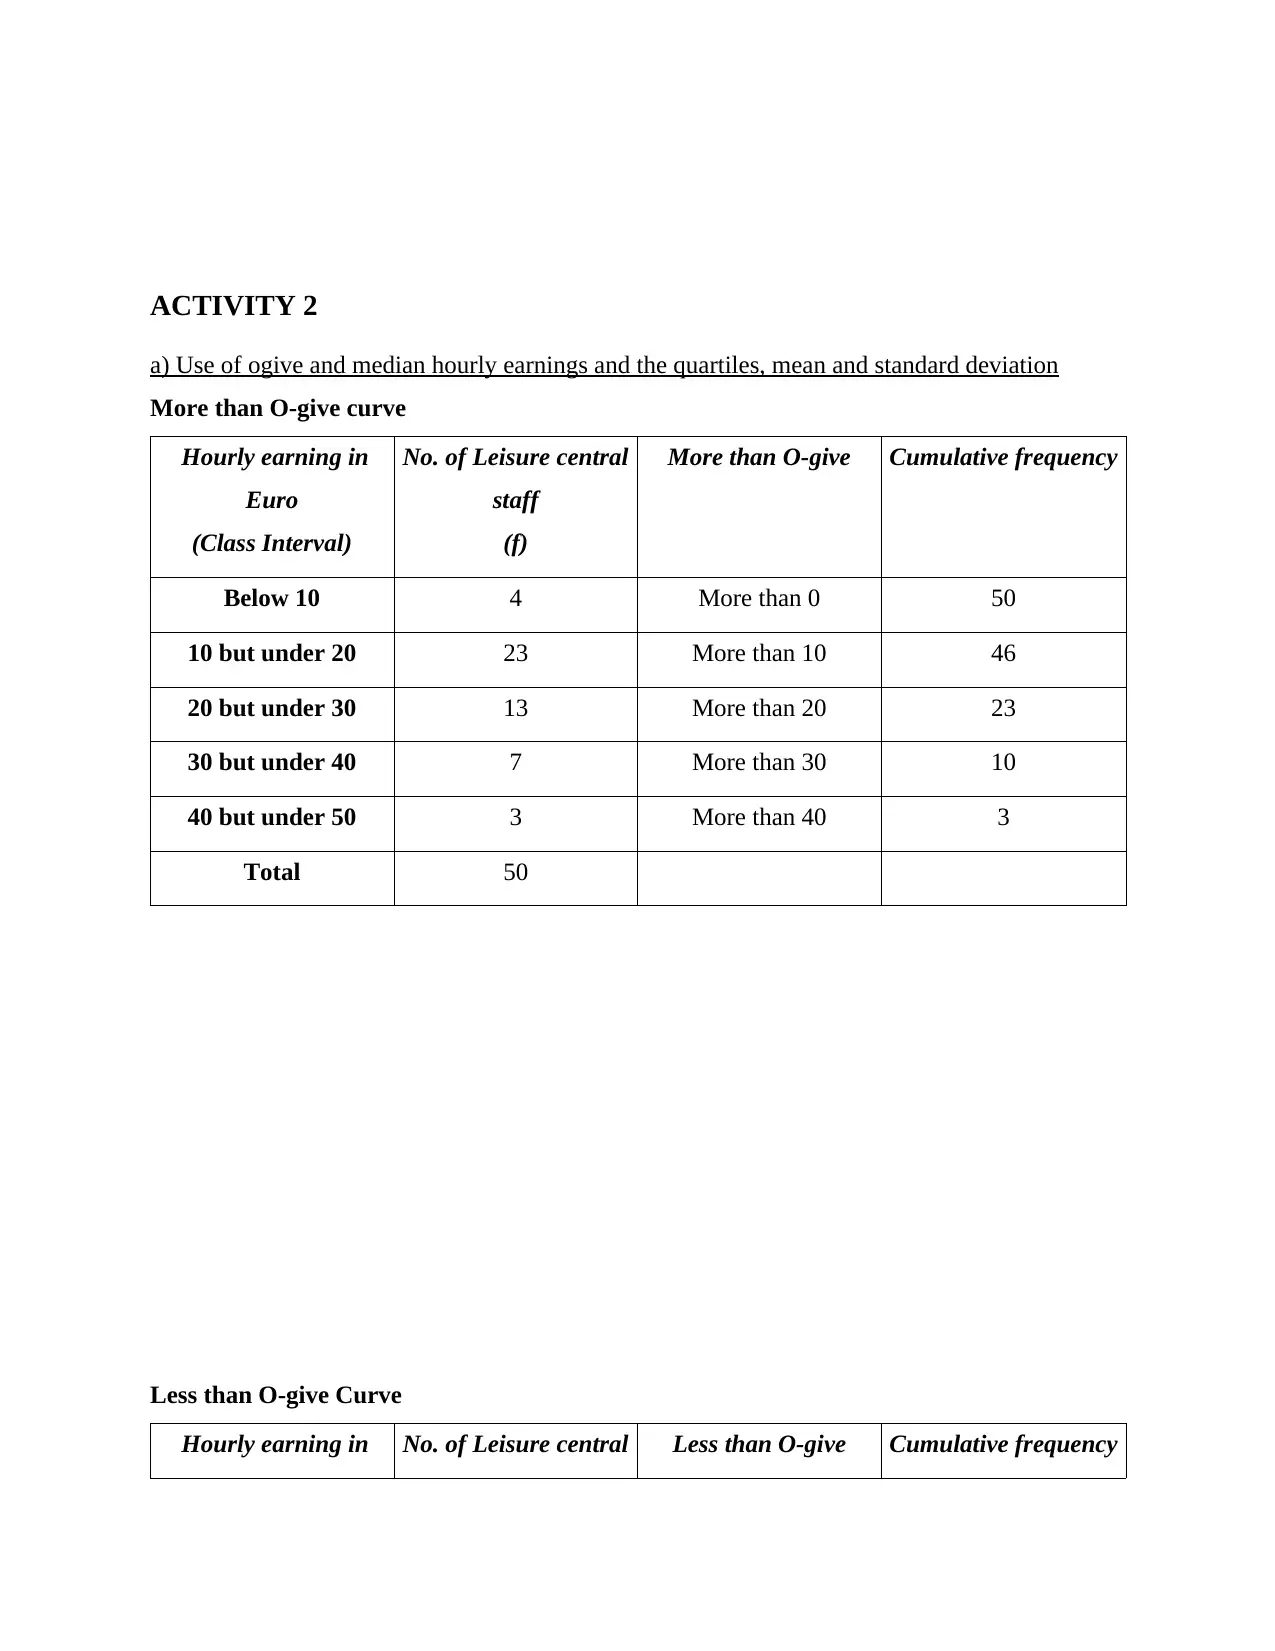
a) Use of ogive and median hourly earnings and the quartiles, mean and standard deviation
More than O-give curve
Hourly earning in
Euro
(Class Interval)
No. of Leisure central
staff
(f)
More than O-give Cumulative frequency
Below 10 4 More than 0 50
10 but under 20 23 More than 10 46
20 but under 30 13 More than 20 23
30 but under 40 7 More than 30 10
40 but under 50 3 More than 40 3
Total 50
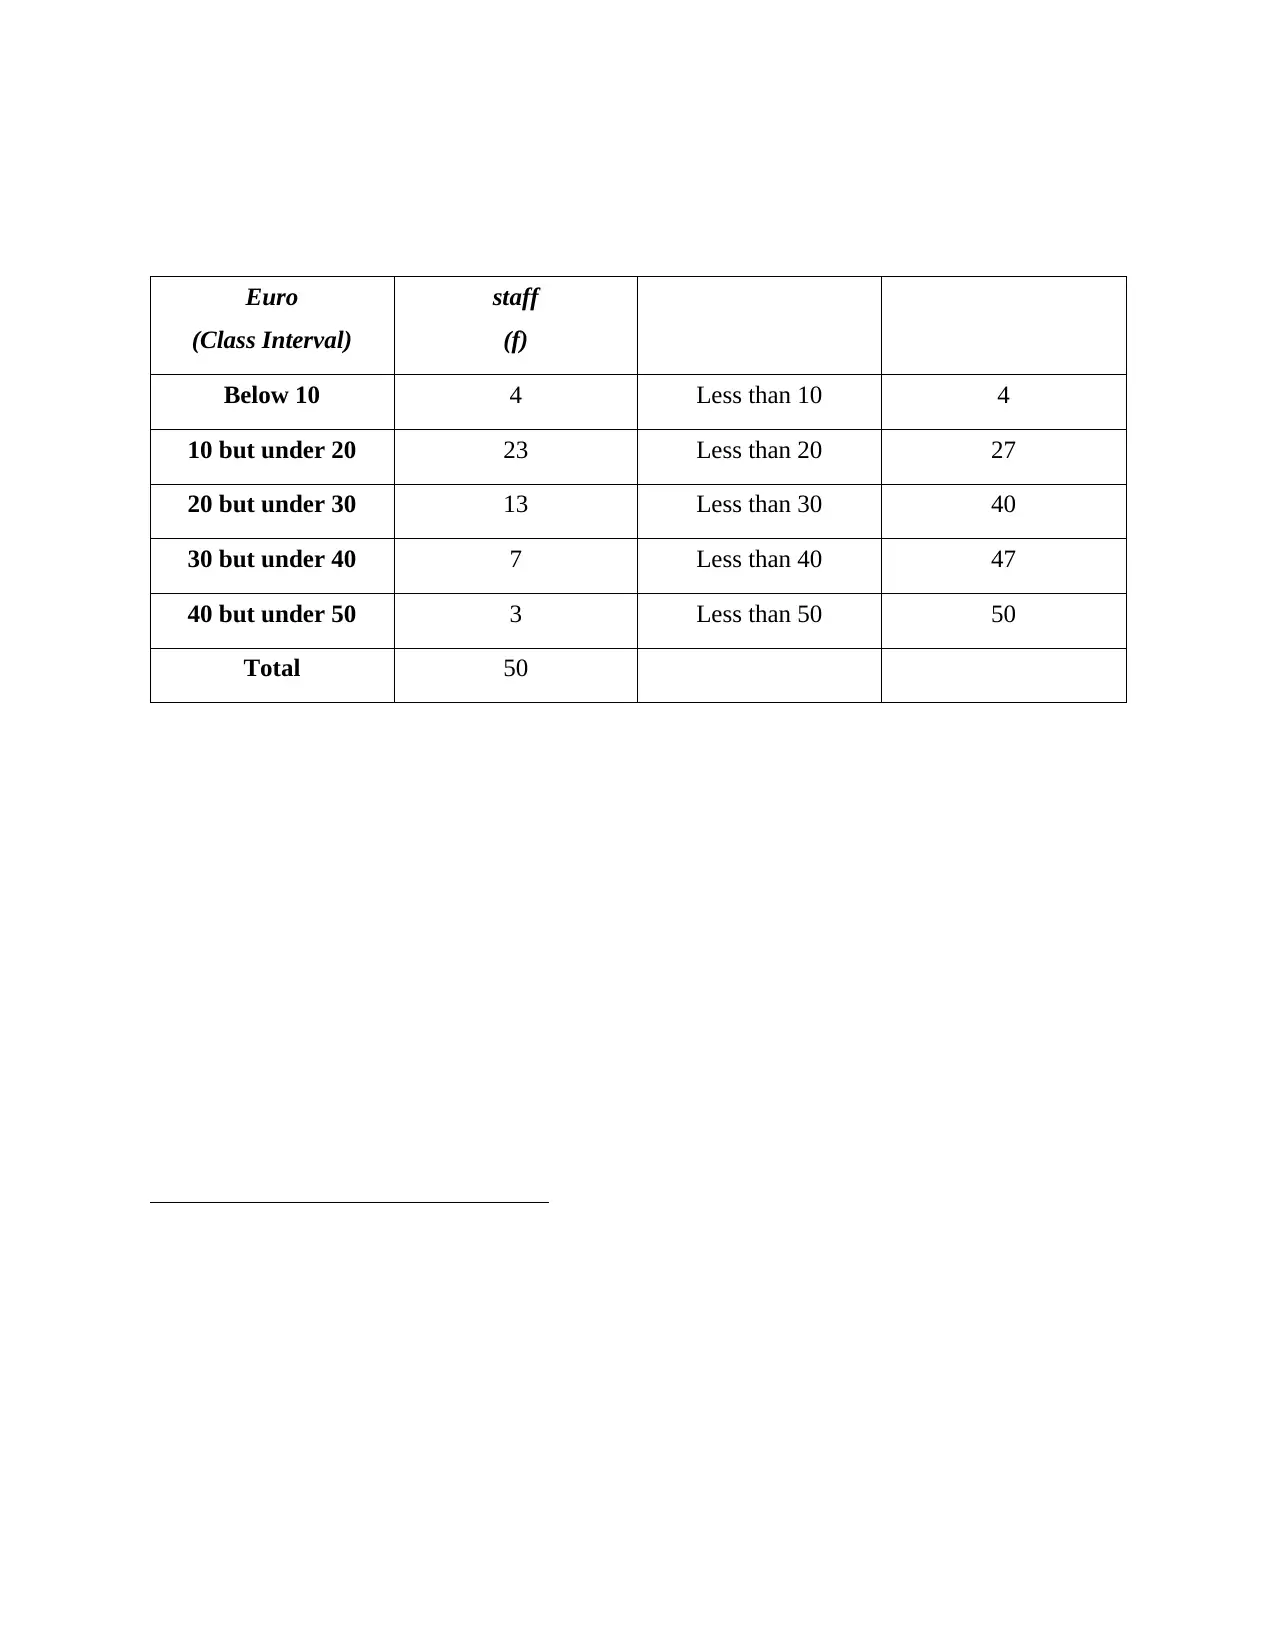
Less than O-give Curve
Hourly earning in No. of Leisure central Less than O-give Cumulative frequency
a) Use of ogive and median hourly earnings and the quartiles, mean and standard deviation
More than O-give curve
Hourly earning in
Euro
(Class Interval)
No. of Leisure central
staff
(f)
More than O-give Cumulative frequency
Below 10 4 More than 0 50
10 but under 20 23 More than 10 46
20 but under 30 13 More than 20 23
30 but under 40 7 More than 30 10
40 but under 50 3 More than 40 3
Total 50
Less than O-give Curve
Hourly earning in No. of Leisure central Less than O-give Cumulative frequency
⊘ This is a preview!⊘
Do you want full access?
Subscribe today to unlock all pages.
Trusted by 1+ million students worldwide
Euro
(Class Interval)
staff
(f)
Below 10 4 Less than 10 4
10 but under 20 23 Less than 20 27
20 but under 30 13 Less than 30 40
30 but under 40 7 Less than 40 47
40 but under 50 3 Less than 50 50
Total 50
(Class Interval)
staff
(f)
Below 10 4 Less than 10 4
10 but under 20 23 Less than 20 27
20 but under 30 13 Less than 30 40
30 but under 40 7 Less than 40 47
40 but under 50 3 Less than 50 50
Total 50
Paraphrase This Document
Need a fresh take? Get an instant paraphrase of this document with our AI Paraphraser
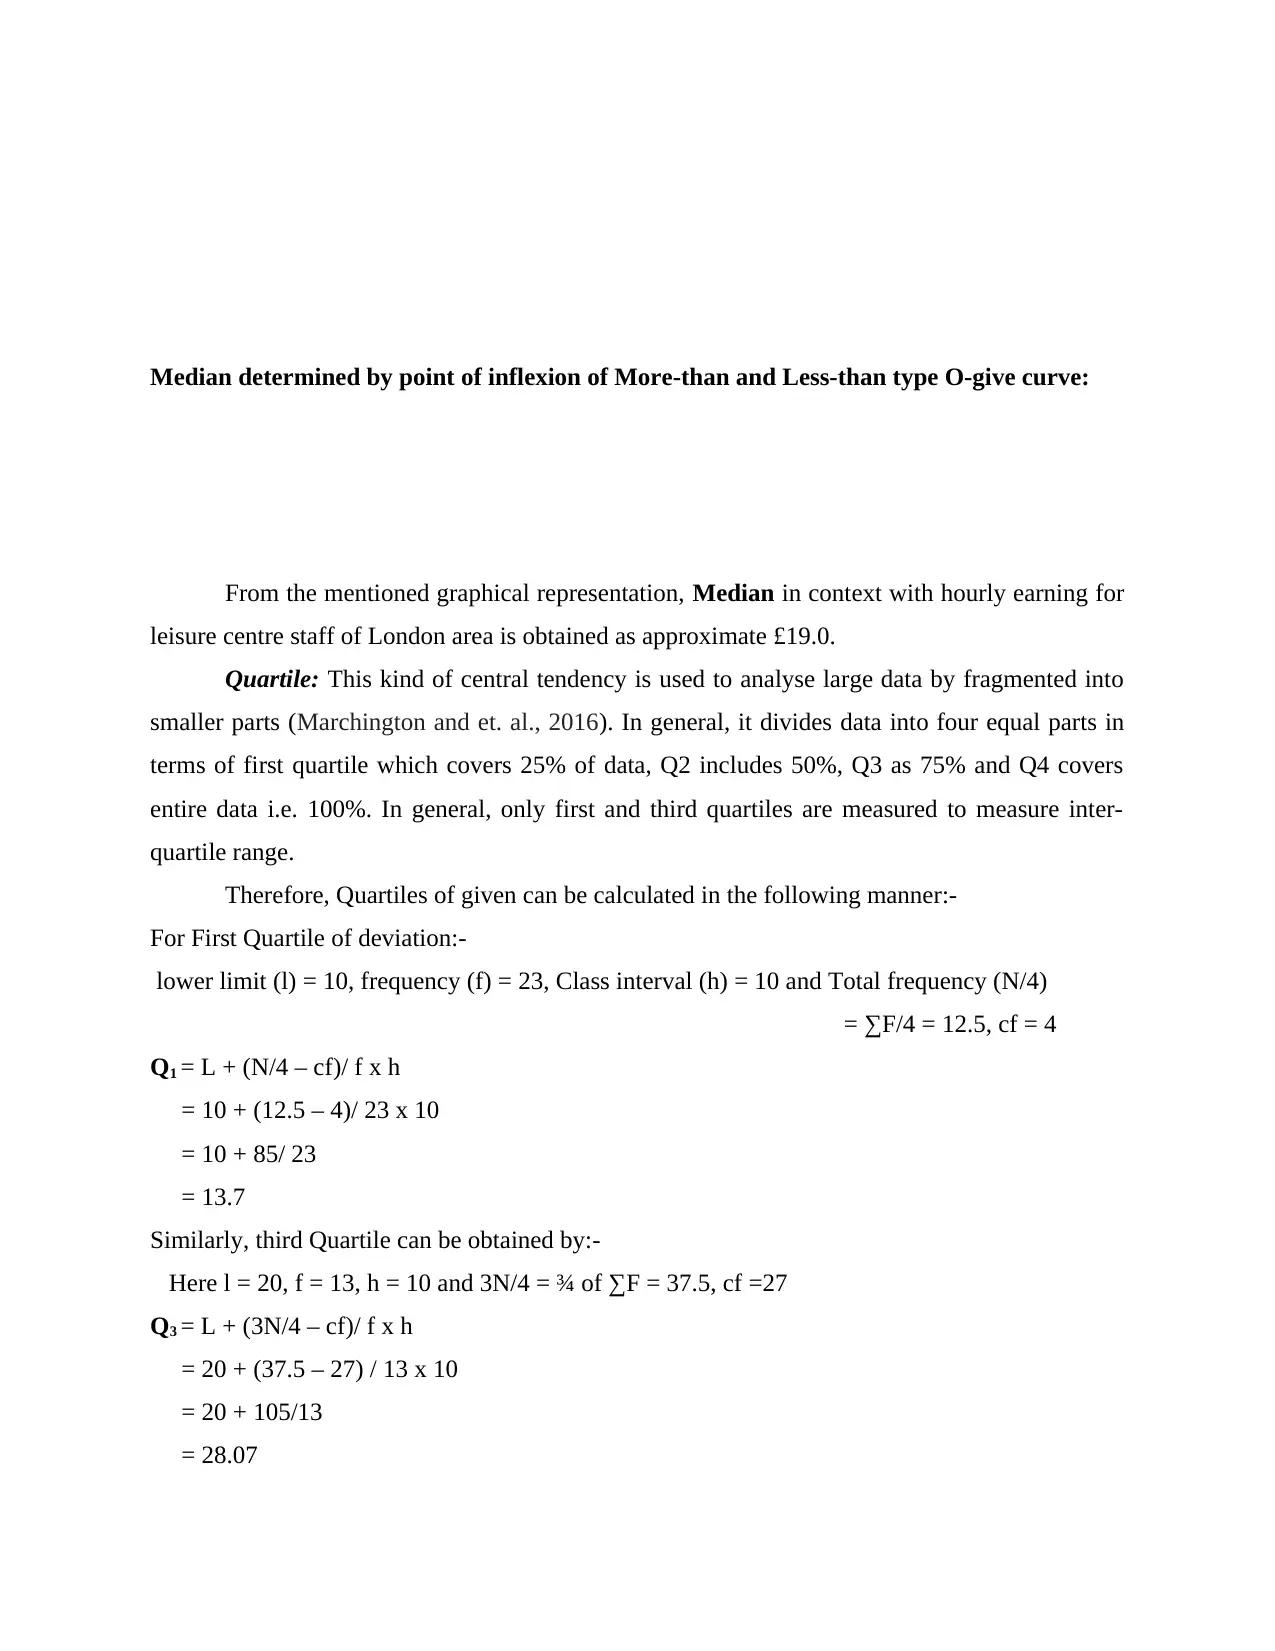
Median determined by point of inflexion of More-than and Less-than type O-give curve:
From the mentioned graphical representation, Median in context with hourly earning for
leisure centre staff of London area is obtained as approximate £19.0.
Quartile: This kind of central tendency is used to analyse large data by fragmented into
smaller parts (Marchington and et. al., 2016). In general, it divides data into four equal parts in
terms of first quartile which covers 25% of data, Q2 includes 50%, Q3 as 75% and Q4 covers
entire data i.e. 100%. In general, only first and third quartiles are measured to measure inter-
quartile range.
Therefore, Quartiles of given can be calculated in the following manner:-
For First Quartile of deviation:-
lower limit (l) = 10, frequency (f) = 23, Class interval (h) = 10 and Total frequency (N/4)
= ∑F/4 = 12.5, cf = 4
Q1 = L + (N/4 – cf)/ f x h
= 10 + (12.5 – 4)/ 23 x 10
= 10 + 85/ 23
= 13.7
Similarly, third Quartile can be obtained by:-
Here l = 20, f = 13, h = 10 and 3N/4 = ¾ of ∑F = 37.5, cf =27
Q3 = L + (3N/4 – cf)/ f x h
= 20 + (37.5 – 27) / 13 x 10
= 20 + 105/13
= 28.07
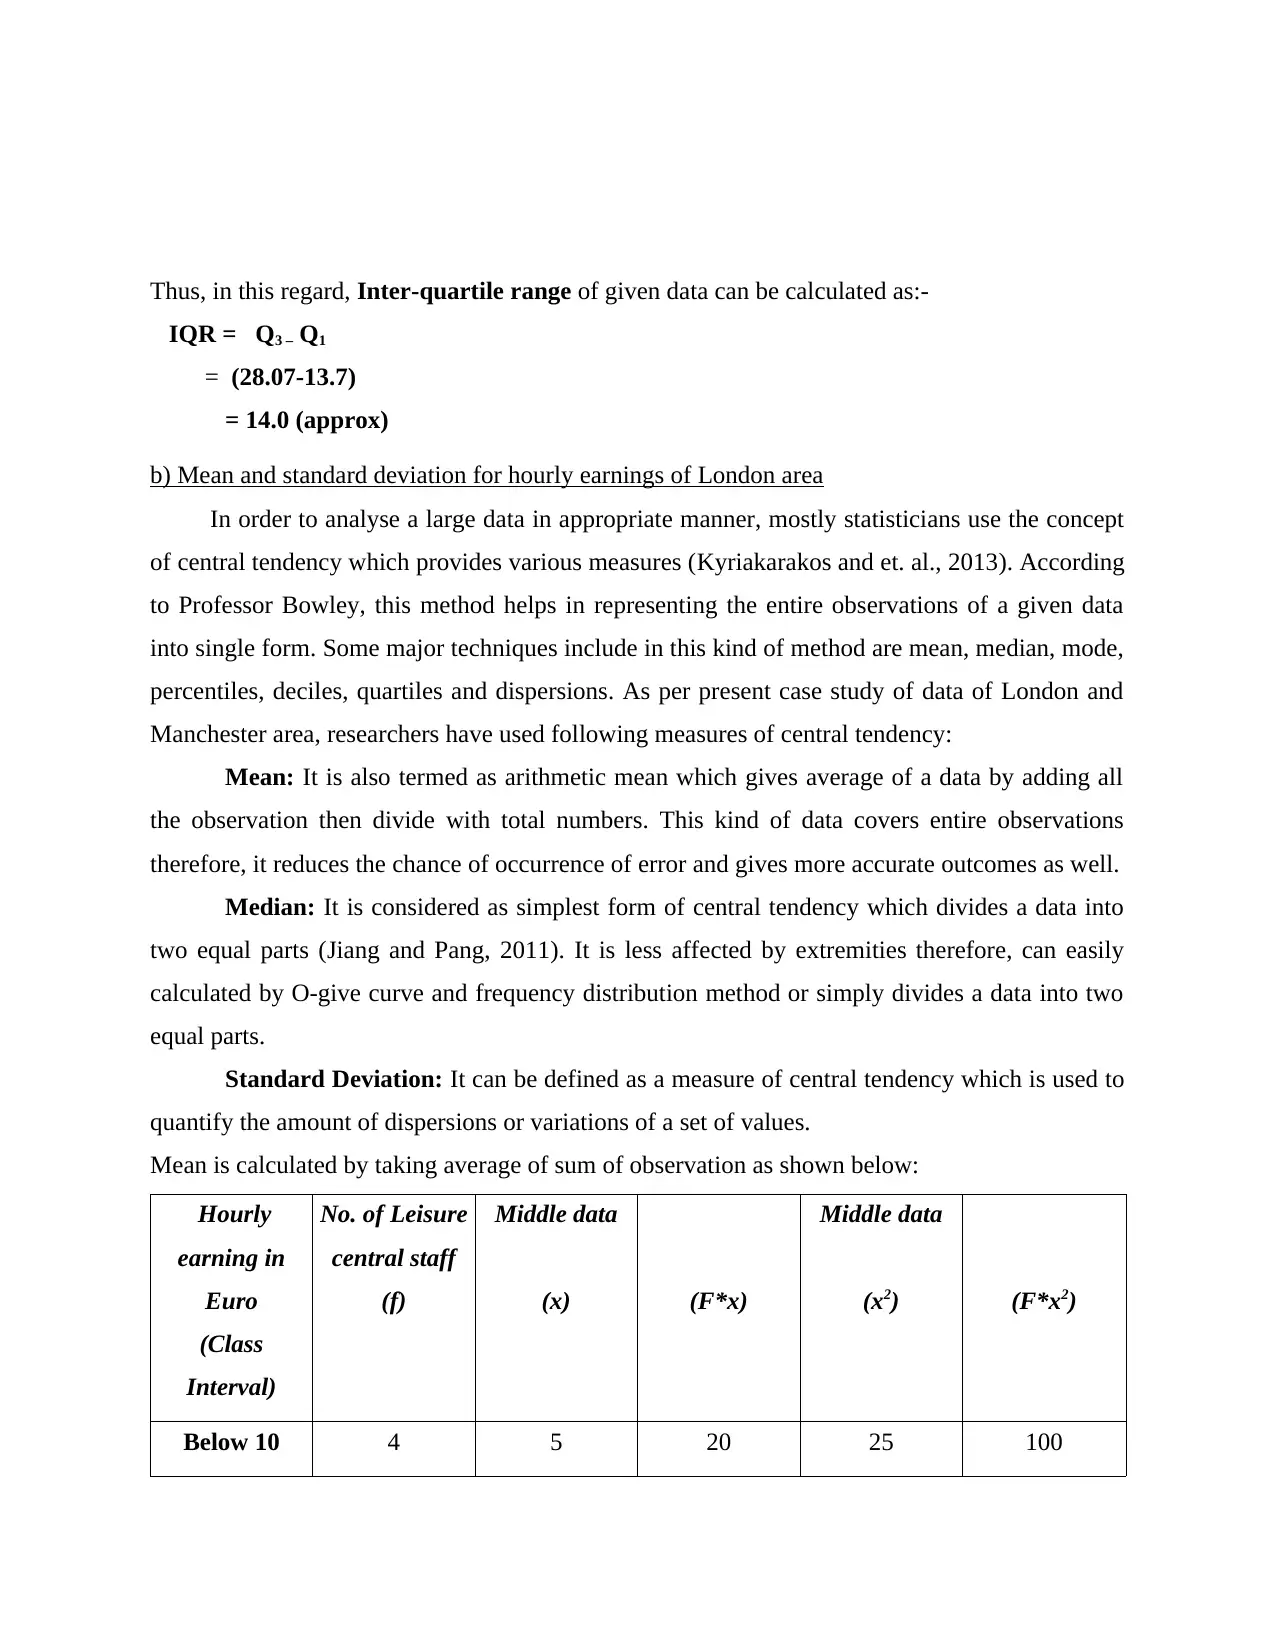
Thus, in this regard, Inter-quartile range of given data can be calculated as:-
IQR = Q3 – Q1
= (28.07-13.7)
= 14.0 (approx)
b) Mean and standard deviation for hourly earnings of London area
In order to analyse a large data in appropriate manner, mostly statisticians use the concept
of central tendency which provides various measures (Kyriakarakos and et. al., 2013). According
to Professor Bowley, this method helps in representing the entire observations of a given data
into single form. Some major techniques include in this kind of method are mean, median, mode,
percentiles, deciles, quartiles and dispersions. As per present case study of data of London and
Manchester area, researchers have used following measures of central tendency:
Mean: It is also termed as arithmetic mean which gives average of a data by adding all
the observation then divide with total numbers. This kind of data covers entire observations
therefore, it reduces the chance of occurrence of error and gives more accurate outcomes as well.
Median: It is considered as simplest form of central tendency which divides a data into
two equal parts (Jiang and Pang, 2011). It is less affected by extremities therefore, can easily
calculated by O-give curve and frequency distribution method or simply divides a data into two
equal parts.
Standard Deviation: It can be defined as a measure of central tendency which is used to
quantify the amount of dispersions or variations of a set of values.
Mean is calculated by taking average of sum of observation as shown below:
Hourly
earning in
Euro
(Class
Interval)
No. of Leisure
central staff
(f)
Middle data
(x) (F*x)
Middle data
(x2) (F*x2)
Below 10 4 5 20 25 100
⊘ This is a preview!⊘
Do you want full access?
Subscribe today to unlock all pages.
Trusted by 1+ million students worldwide
1 out of 23
Related Documents


Your All-in-One AI-Powered Toolkit for Academic Success.
+13062052269
info@desklib.com
Available 24*7 on WhatsApp / Email
![[object Object]](/_next/static/media/star-bottom.7253800d.svg)
Unlock your academic potential
Copyright © 2020–2026 A2Z Services. All Rights Reserved. Developed and managed by ZUCOL.