Investigation of Car Park Usage at University of Tasmania, 2018
VerifiedAdded on 2023/06/04
|13
|2150
|325
Report
AI Summary
This report presents an investigation into car park usage at the University of Tasmania (UTAS), analyzing data collected from four different entrances. The study covers the period from January 1st, 2018, to June 30th, 2018, and aims to understand parking patterns during in-semester and non-semester periods. The analysis includes descriptive statistics to illustrate the dataset, comparing car park usage between in-semester and non-semester days using t-tests to identify significant differences. Furthermore, the research examines the differences in car park usage across the four entrances, employing ANOVA and t-tests to draw conclusions about the utilization of each entrance. The results indicate differences in the usage of car parks during semester and non-semester periods and across different entrances.

INVESTIGATION OF CAR PARK USAGE IN THE UNIVERSITY OF
TASMANIA
TASMANIA
Paraphrase This Document
Need a fresh take? Get an instant paraphrase of this document with our AI Paraphraser
Table of Contents
ABSTRACT................................................................................................................................................3
INRODUCTION.........................................................................................................................................4
RESULTS...................................................................................................................................................5
1. DESCRIPTION AND ILLUSTRATION OF DATASET...........................................................5
2. CAR PARKING DIFFERENCE DURING IN-SEMESTER AND OUTSIDE SEMESTER
TIMES....................................................................................................................................................6
IN-SEMESTER AND NON-SEMESTER DAYS PLOTS COMPARISON.......................................6
T-TEST FOR THE SEMESTER DAYS..............................................................................................7
3. DIFFERENCE IN CAR PARK USAGE BY ENTRANCES......................................................9
DESCRIPTIVE STATISTICS PLOTS FOR THE ENTRANCES......................................................9
ANOVA TEST FOR CAR PARK ENTRANCES.............................................................................10
T-TEST FOR CAR PARK ENTRANCES........................................................................................10
DISCUSSION...........................................................................................................................................11
References.................................................................................................................................................12
2
ABSTRACT
This research focuses on observing the car parking usage in the University of
Tasmania. The aim is to investigate the car parking problem experienced by the
university. This will be done by analyzing data collected from four different car
parking entrances into the university. These entrances will be Alexander Street,
Churchill Avenue, Earl Street and Grace Street. The research will conduct,
descriptive analysis, t-test and ANOVA test in order to draw conclusions.
3
⊘ This is a preview!⊘
Do you want full access?
Subscribe today to unlock all pages.
Trusted by 1+ million students worldwide
INRODUCTION
The provision of adequate parking space is becoming an integral part of modern live.
Organizations and institutions have been forced to think of the means of ensuring
enough parking space is available to improve efficiency and productivity (Farris &
Neil, 2010; Anthony & Johnson, 2008). This is especially for events that are
organized and hosted by institutions.
Lack of parking space is a counterproductive situation. A lot of time and energy is
spent in looking for parking space that would otherwise be used gainfully in other
areas (Kiechel, 2010) . As such, this makes availability and utilization of parking
space an issue of concern for stakeholders in organizations and administrations in
institutions.
The parking problem becomes a point of interest especially when it gets in the way of
the normal operations in an organization or institution. This problem may have
adverse effects on the productivity of the staff and other individuals that use the
facilities and services offered (Kotler, 2009).
University of Tasmania is faced with a problem in parking spaces. This research aims
at investigating the parking space situation in the university. Focus will be on
observing the different entry points and how they are used during different periods of
the learning cycle. The data will assist in gaining a better understanding of the trend
in the parking practices by the staff, students and other individuals that frequent the
university.
4
Paraphrase This Document
Need a fresh take? Get an instant paraphrase of this document with our AI Paraphraser
RESULTS
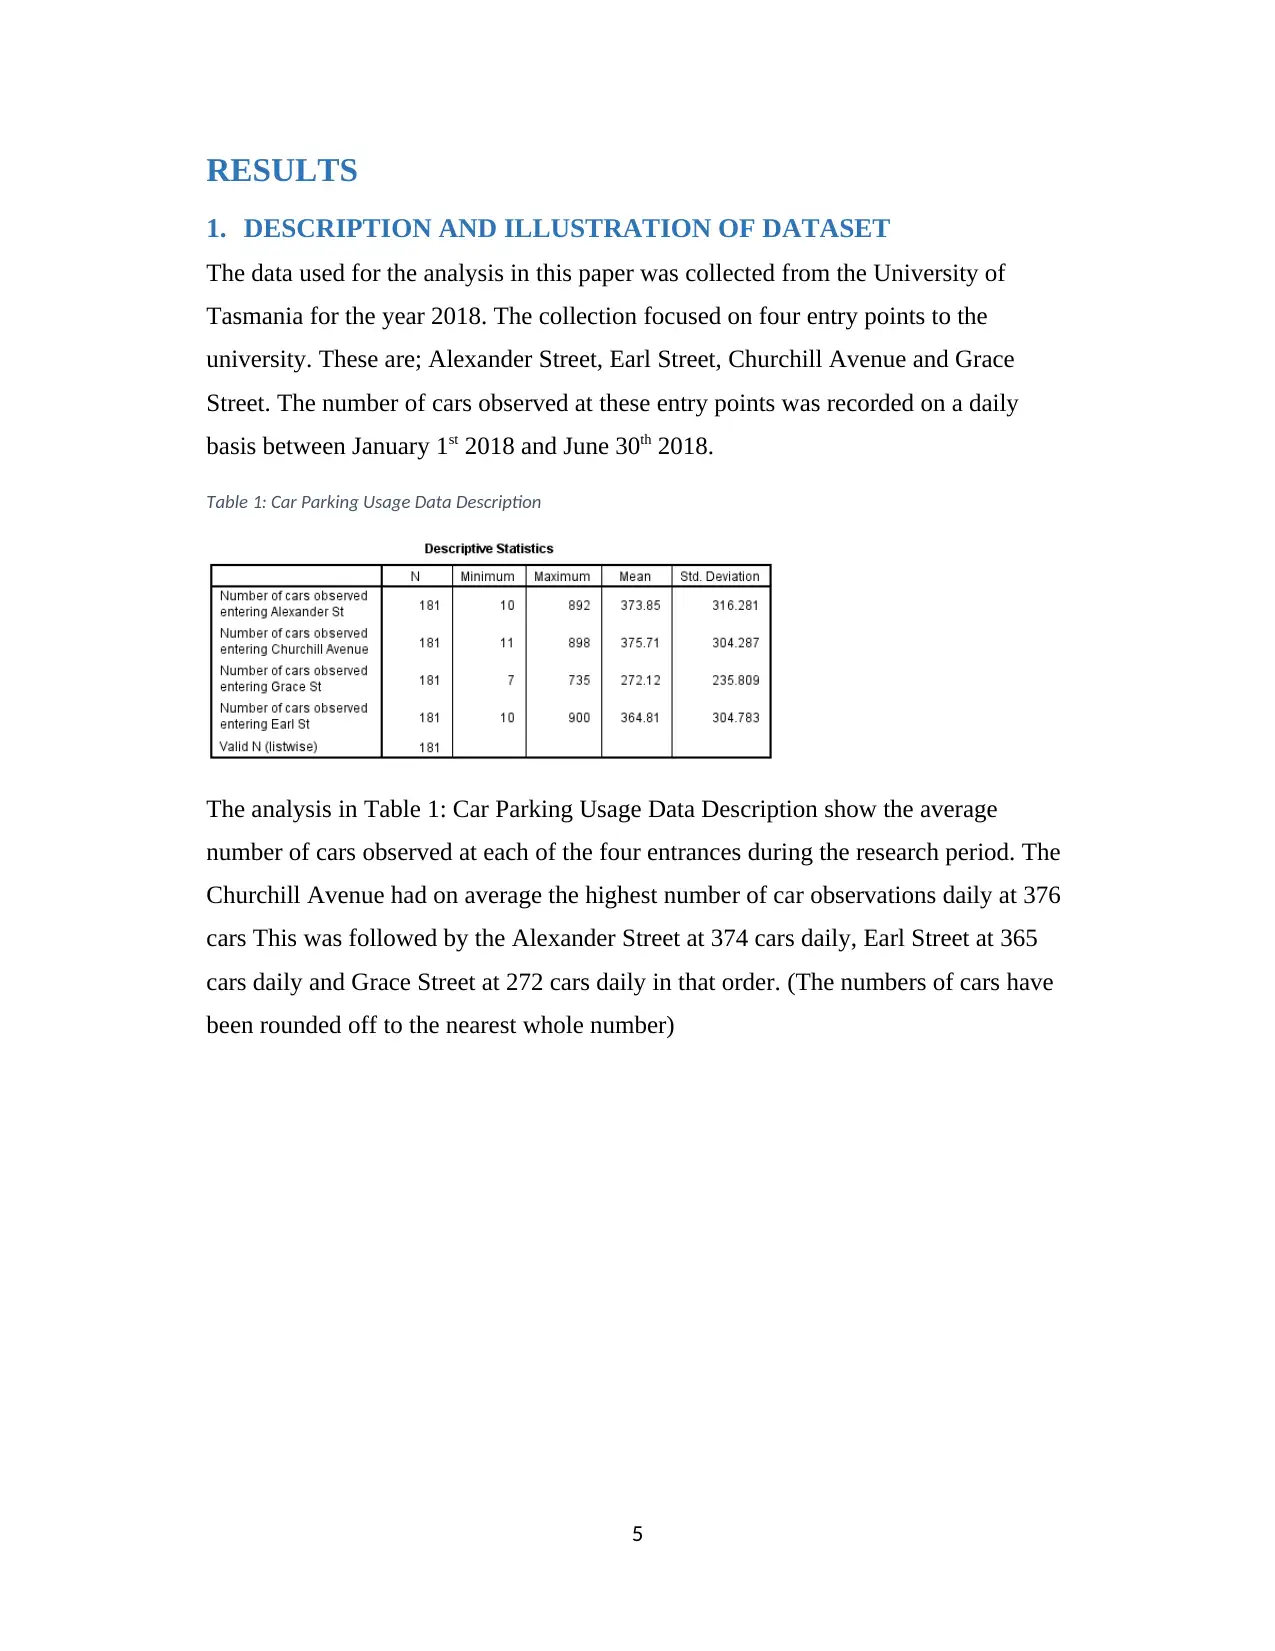
1. DESCRIPTION AND ILLUSTRATION OF DATASET
The data used for the analysis in this paper was collected from the University of
Tasmania for the year 2018. The collection focused on four entry points to the
university. These are; Alexander Street, Earl Street, Churchill Avenue and Grace
Street. The number of cars observed at these entry points was recorded on a daily
basis between January 1st 2018 and June 30th 2018.
Table 1: Car Parking Usage Data Description
The analysis in Table 1: Car Parking Usage Data Description show the average
number of cars observed at each of the four entrances during the research period. The
Churchill Avenue had on average the highest number of car observations daily at 376
cars This was followed by the Alexander Street at 374 cars daily, Earl Street at 365
cars daily and Grace Street at 272 cars daily in that order. (The numbers of cars have
been rounded off to the nearest whole number)
5
2. CAR PARKING DIFFERENCE DURING IN-SEMESTER AND OUTSIDE
SEMESTER TIMES
IN-SEMESTER AND NON-SEMESTER DAYS PLOTS COMPARISON
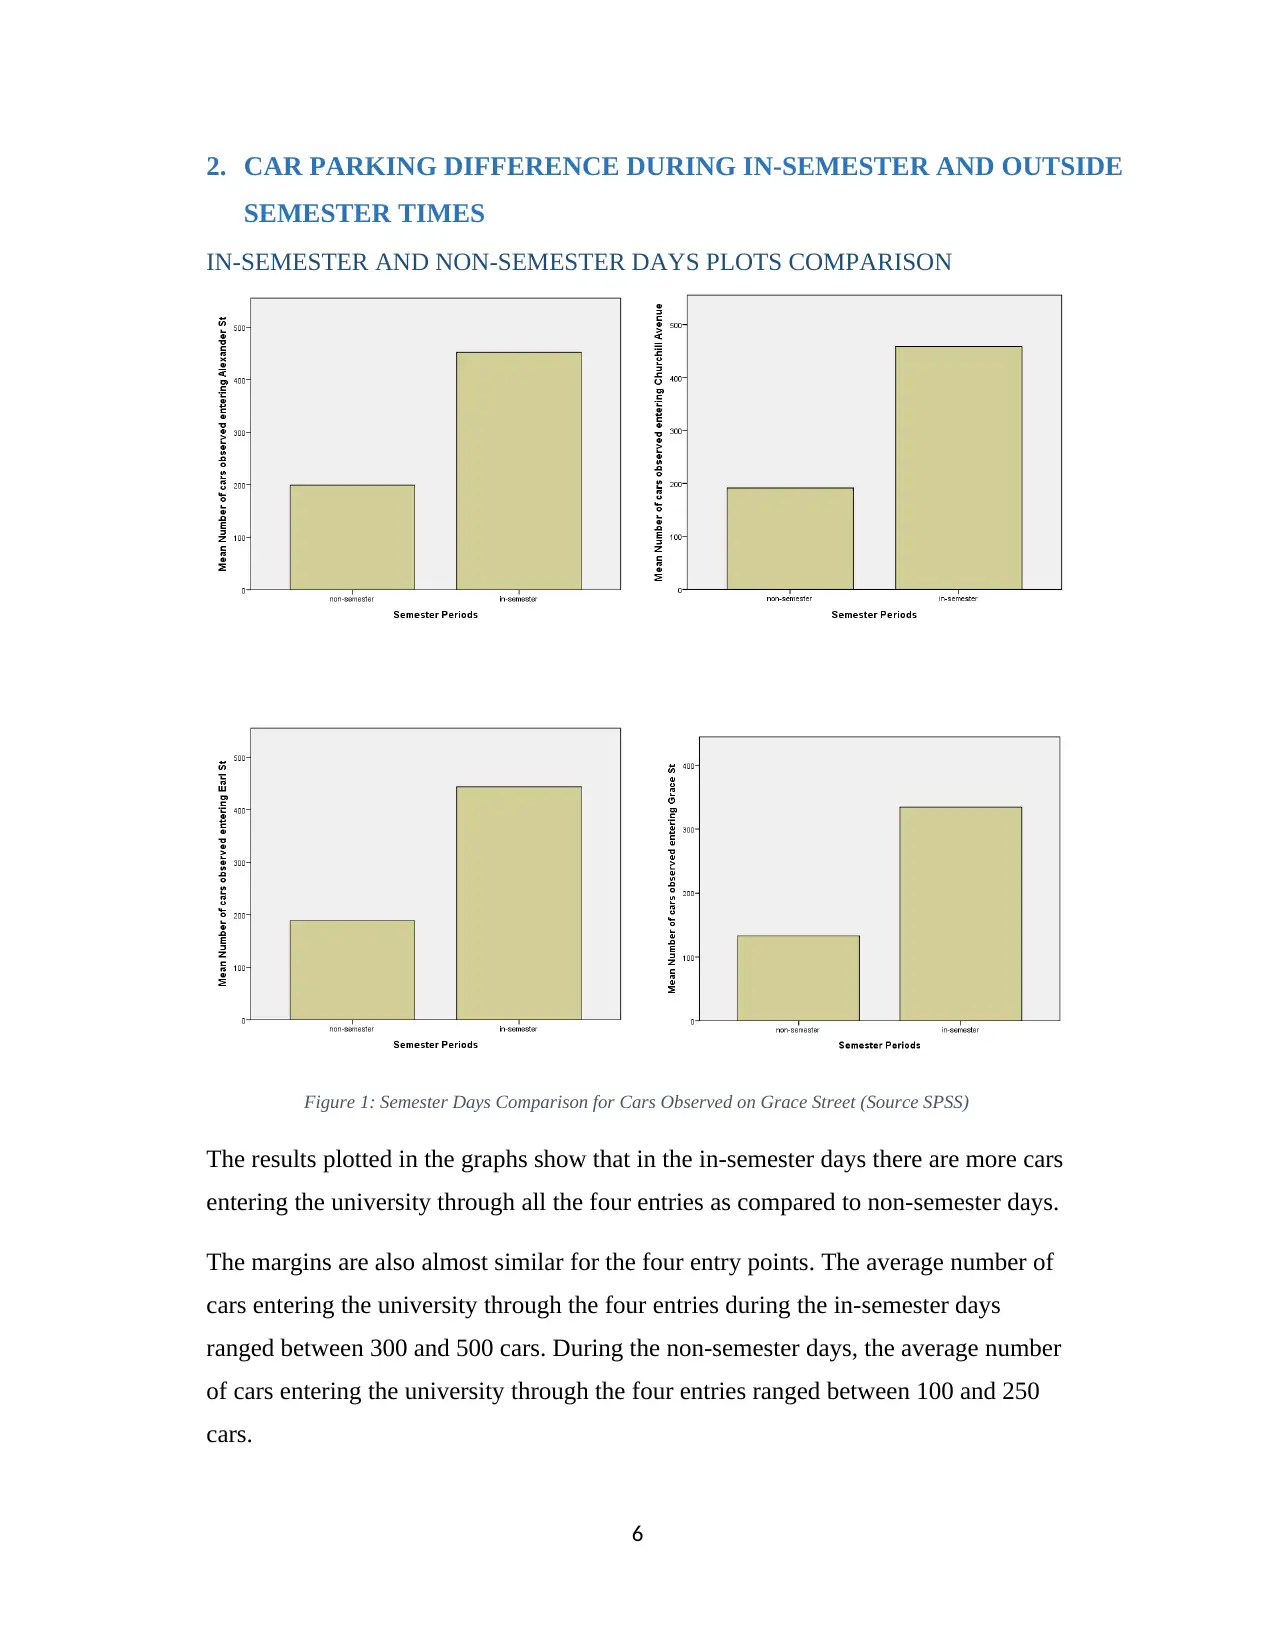
Figure 1: Semester Days Comparison for Cars Observed on Grace Street (Source SPSS)
The results plotted in the graphs show that in the in-semester days there are more cars
entering the university through all the four entries as compared to non-semester days.
The margins are also almost similar for the four entry points. The average number of
cars entering the university through the four entries during the in-semester days
ranged between 300 and 500 cars. During the non-semester days, the average number
of cars entering the university through the four entries ranged between 100 and 250
cars.
6
SEMESTER TIMES
IN-SEMESTER AND NON-SEMESTER DAYS PLOTS COMPARISON
Figure 1: Semester Days Comparison for Cars Observed on Grace Street (Source SPSS)
The results plotted in the graphs show that in the in-semester days there are more cars
entering the university through all the four entries as compared to non-semester days.
The margins are also almost similar for the four entry points. The average number of
cars entering the university through the four entries during the in-semester days
ranged between 300 and 500 cars. During the non-semester days, the average number
of cars entering the university through the four entries ranged between 100 and 250
cars.
6
⊘ This is a preview!⊘
Do you want full access?
Subscribe today to unlock all pages.
Trusted by 1+ million students worldwide
T-TEST FOR THE SEMESTER DAYS
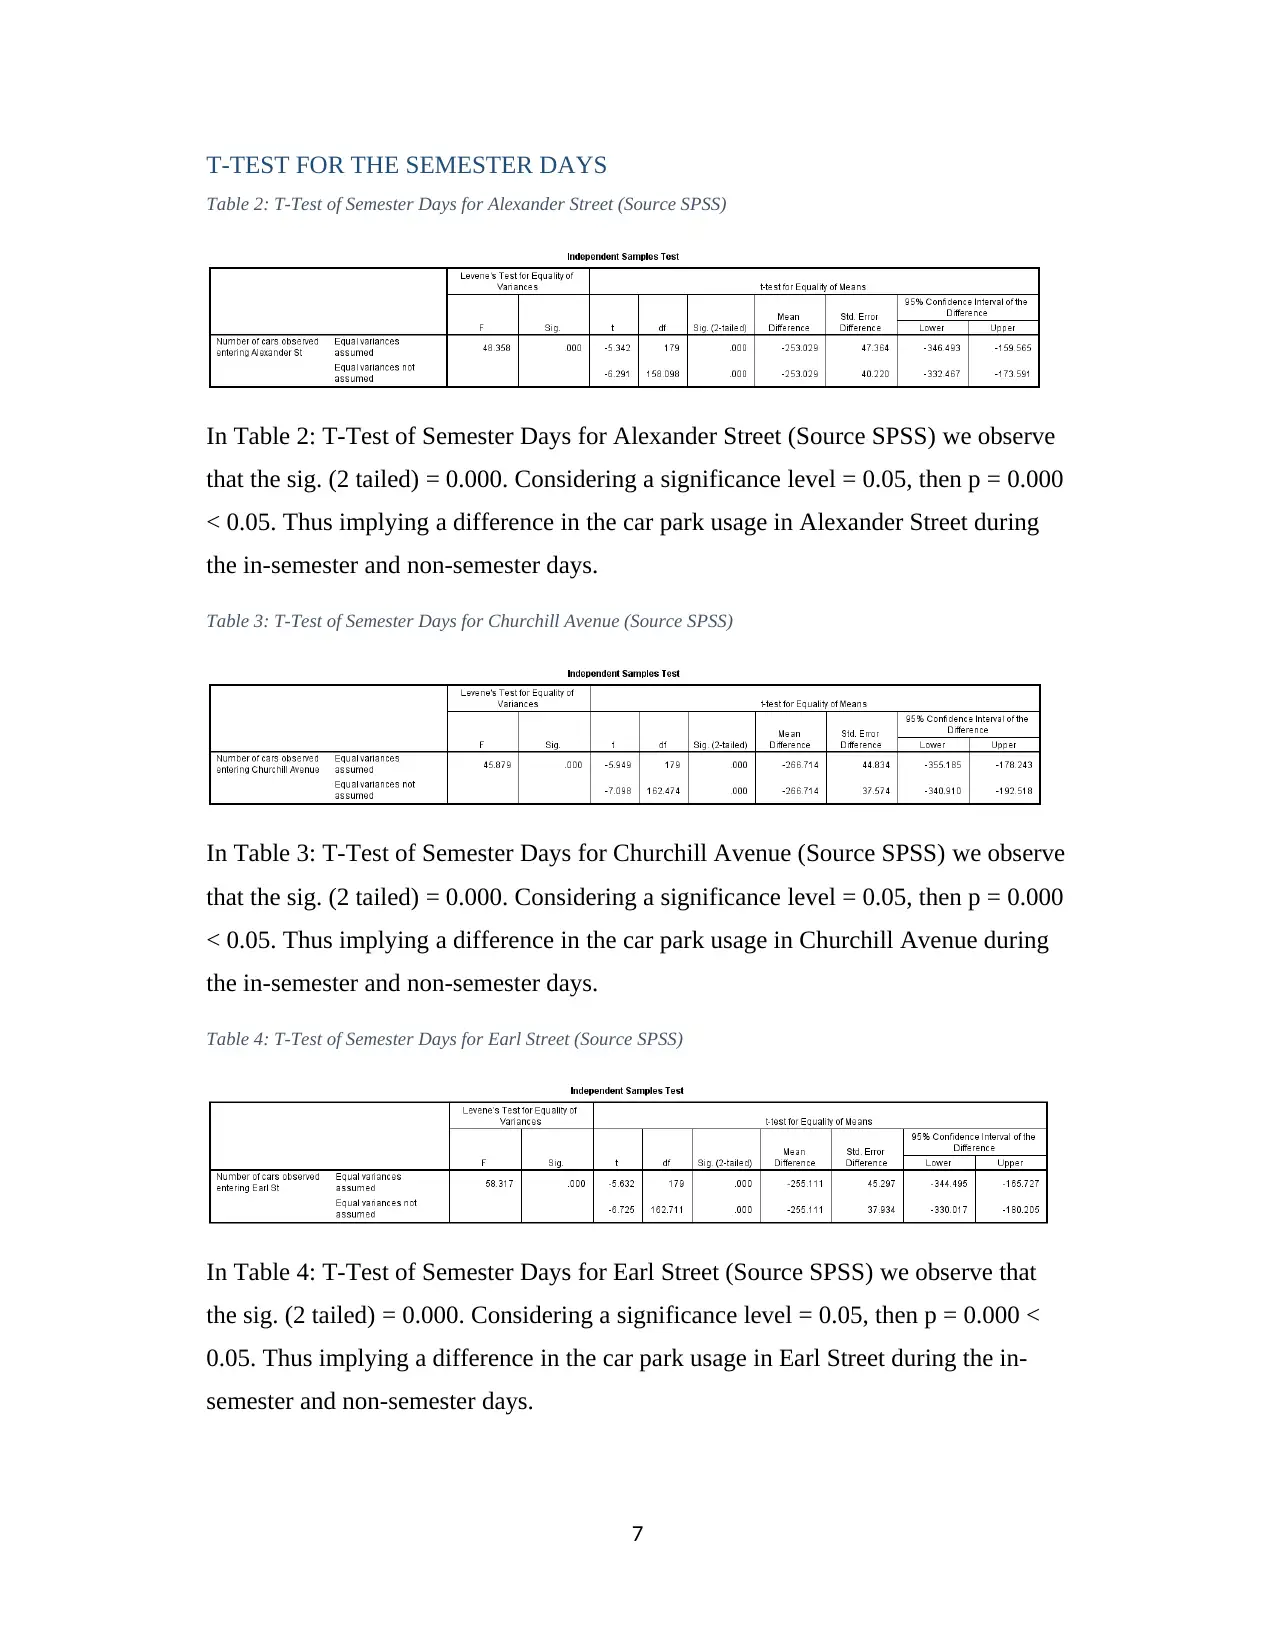
Table 2: T-Test of Semester Days for Alexander Street (Source SPSS)
In Table 2: T-Test of Semester Days for Alexander Street (Source SPSS) we observe
that the sig. (2 tailed) = 0.000. Considering a significance level = 0.05, then p = 0.000
< 0.05. Thus implying a difference in the car park usage in Alexander Street during
the in-semester and non-semester days.
Table 3: T-Test of Semester Days for Churchill Avenue (Source SPSS)
In Table 3: T-Test of Semester Days for Churchill Avenue (Source SPSS) we observe
that the sig. (2 tailed) = 0.000. Considering a significance level = 0.05, then p = 0.000
< 0.05. Thus implying a difference in the car park usage in Churchill Avenue during
the in-semester and non-semester days.
Table 4: T-Test of Semester Days for Earl Street (Source SPSS)
In Table 4: T-Test of Semester Days for Earl Street (Source SPSS) we observe that
the sig. (2 tailed) = 0.000. Considering a significance level = 0.05, then p = 0.000 <
0.05. Thus implying a difference in the car park usage in Earl Street during the in-
semester and non-semester days.
7
Paraphrase This Document
Need a fresh take? Get an instant paraphrase of this document with our AI Paraphraser
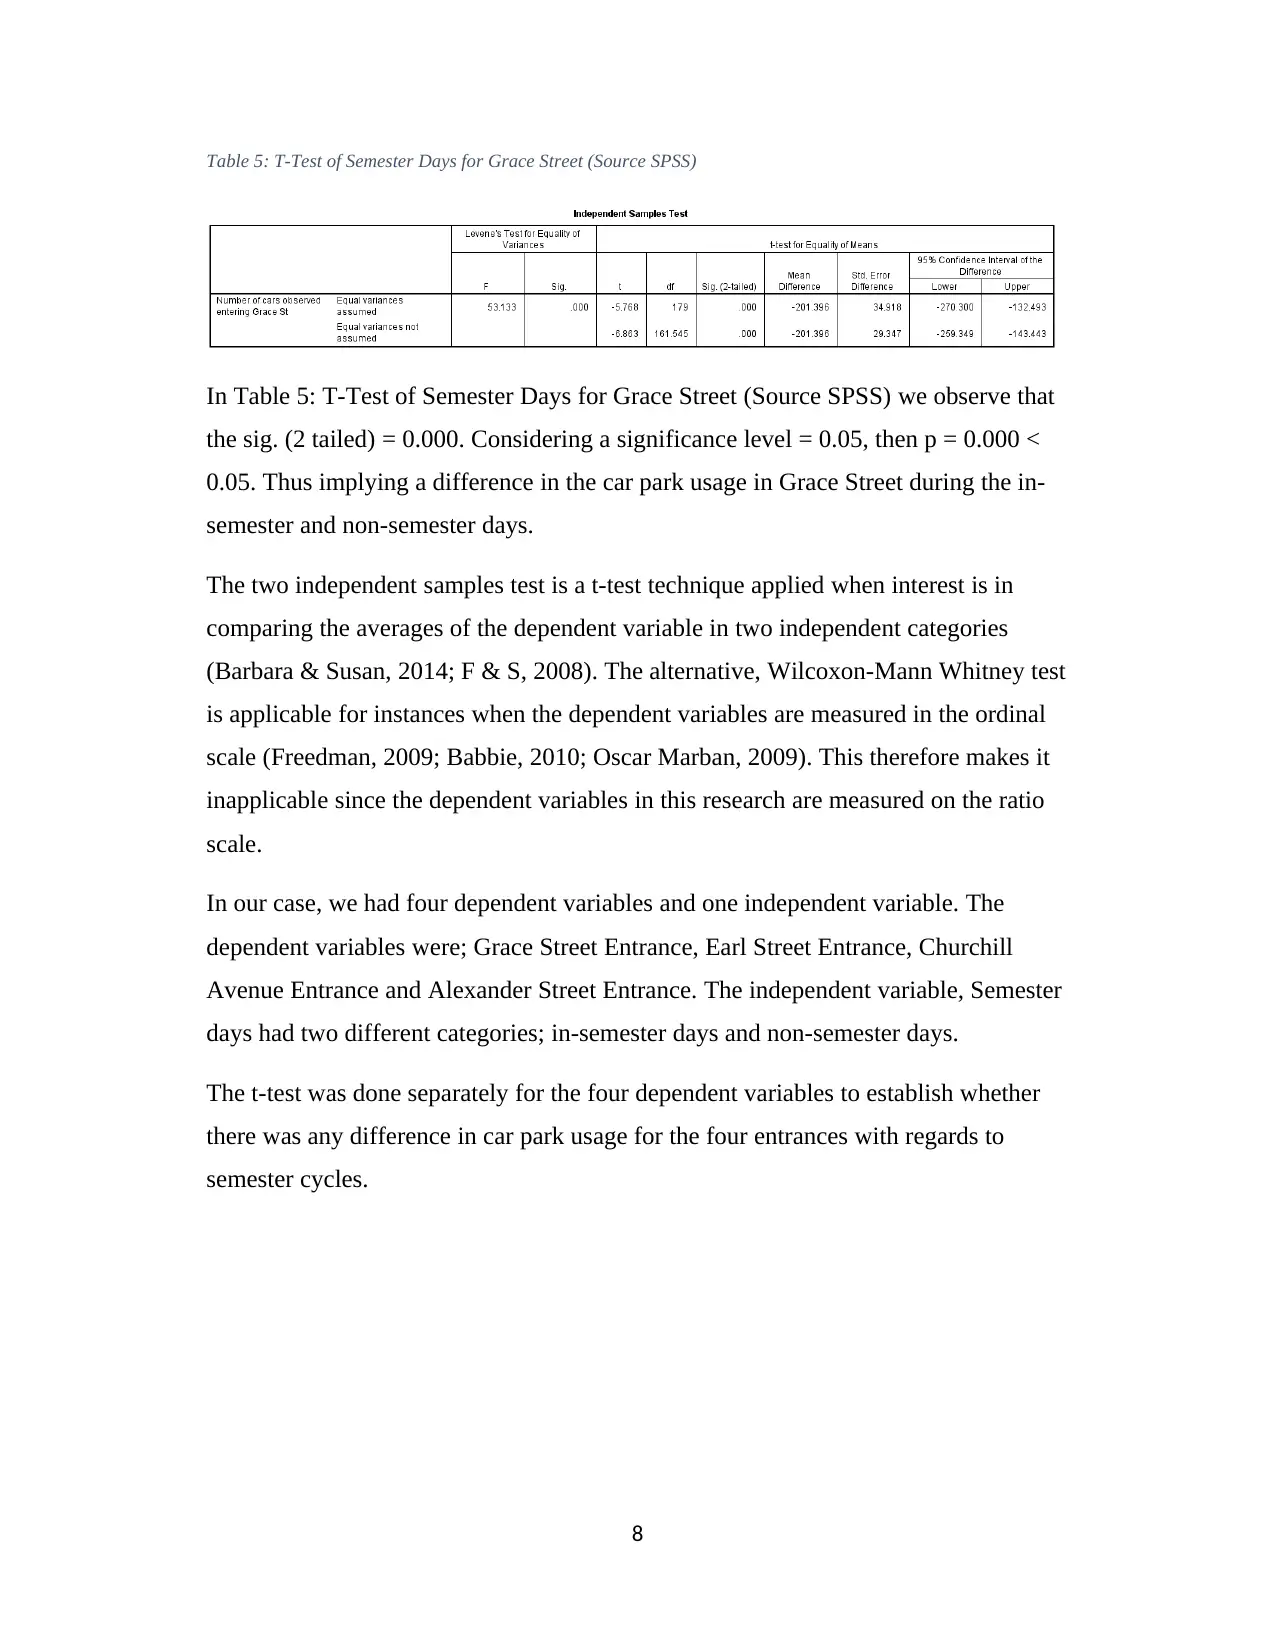
Table 5: T-Test of Semester Days for Grace Street (Source SPSS)
In Table 5: T-Test of Semester Days for Grace Street (Source SPSS) we observe that
the sig. (2 tailed) = 0.000. Considering a significance level = 0.05, then p = 0.000 <
0.05. Thus implying a difference in the car park usage in Grace Street during the in-
semester and non-semester days.
The two independent samples test is a t-test technique applied when interest is in
comparing the averages of the dependent variable in two independent categories
(Barbara & Susan, 2014; F & S, 2008). The alternative, Wilcoxon-Mann Whitney test
is applicable for instances when the dependent variables are measured in the ordinal
scale (Freedman, 2009; Babbie, 2010; Oscar Marban, 2009). This therefore makes it
inapplicable since the dependent variables in this research are measured on the ratio
scale.
In our case, we had four dependent variables and one independent variable. The
dependent variables were; Grace Street Entrance, Earl Street Entrance, Churchill
Avenue Entrance and Alexander Street Entrance. The independent variable, Semester
days had two different categories; in-semester days and non-semester days.
The t-test was done separately for the four dependent variables to establish whether
there was any difference in car park usage for the four entrances with regards to
semester cycles.
8
3. DIFFERENCE IN CAR PARK USAGE BY ENTRANCES
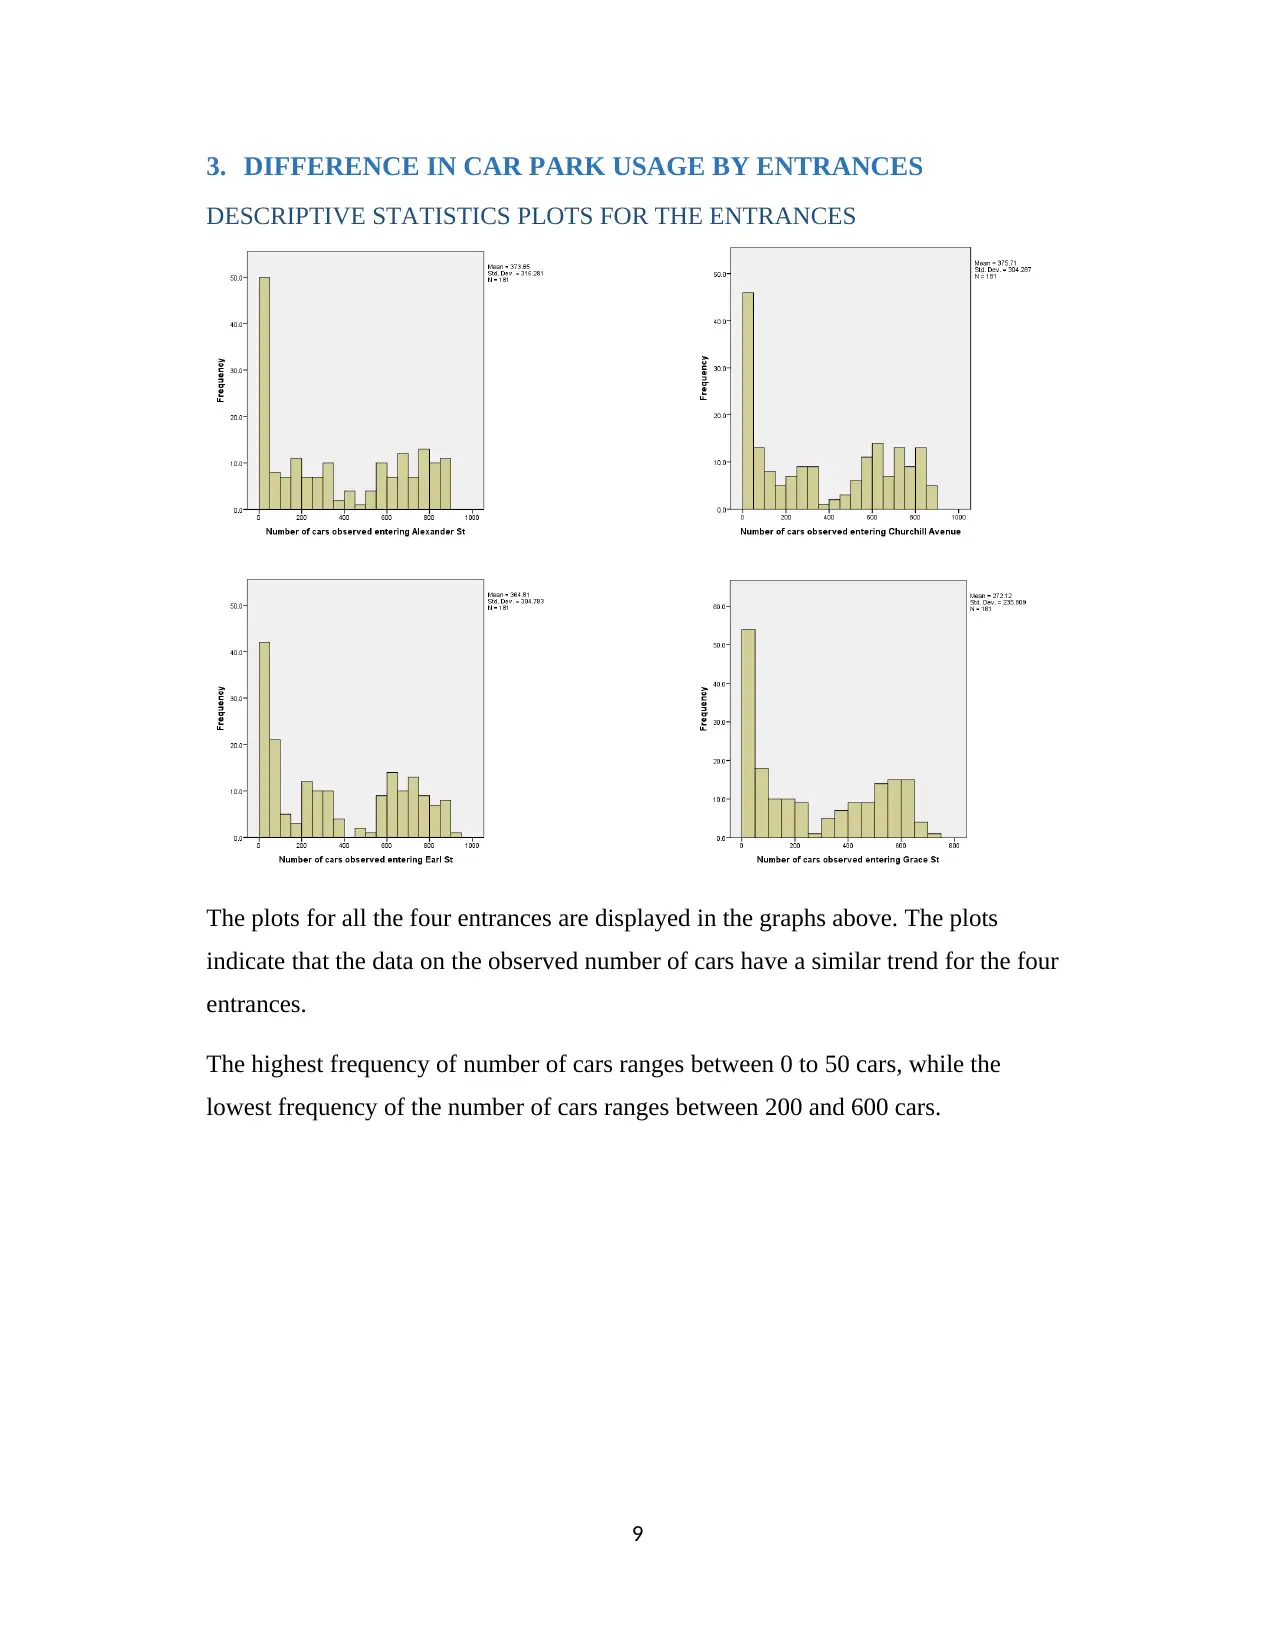
DESCRIPTIVE STATISTICS PLOTS FOR THE ENTRANCES
The plots for all the four entrances are displayed in the graphs above. The plots
indicate that the data on the observed number of cars have a similar trend for the four
entrances.
The highest frequency of number of cars ranges between 0 to 50 cars, while the
lowest frequency of the number of cars ranges between 200 and 600 cars.
9
⊘ This is a preview!⊘
Do you want full access?
Subscribe today to unlock all pages.
Trusted by 1+ million students worldwide
ANOVA TEST FOR CAR PARK ENTRANCES
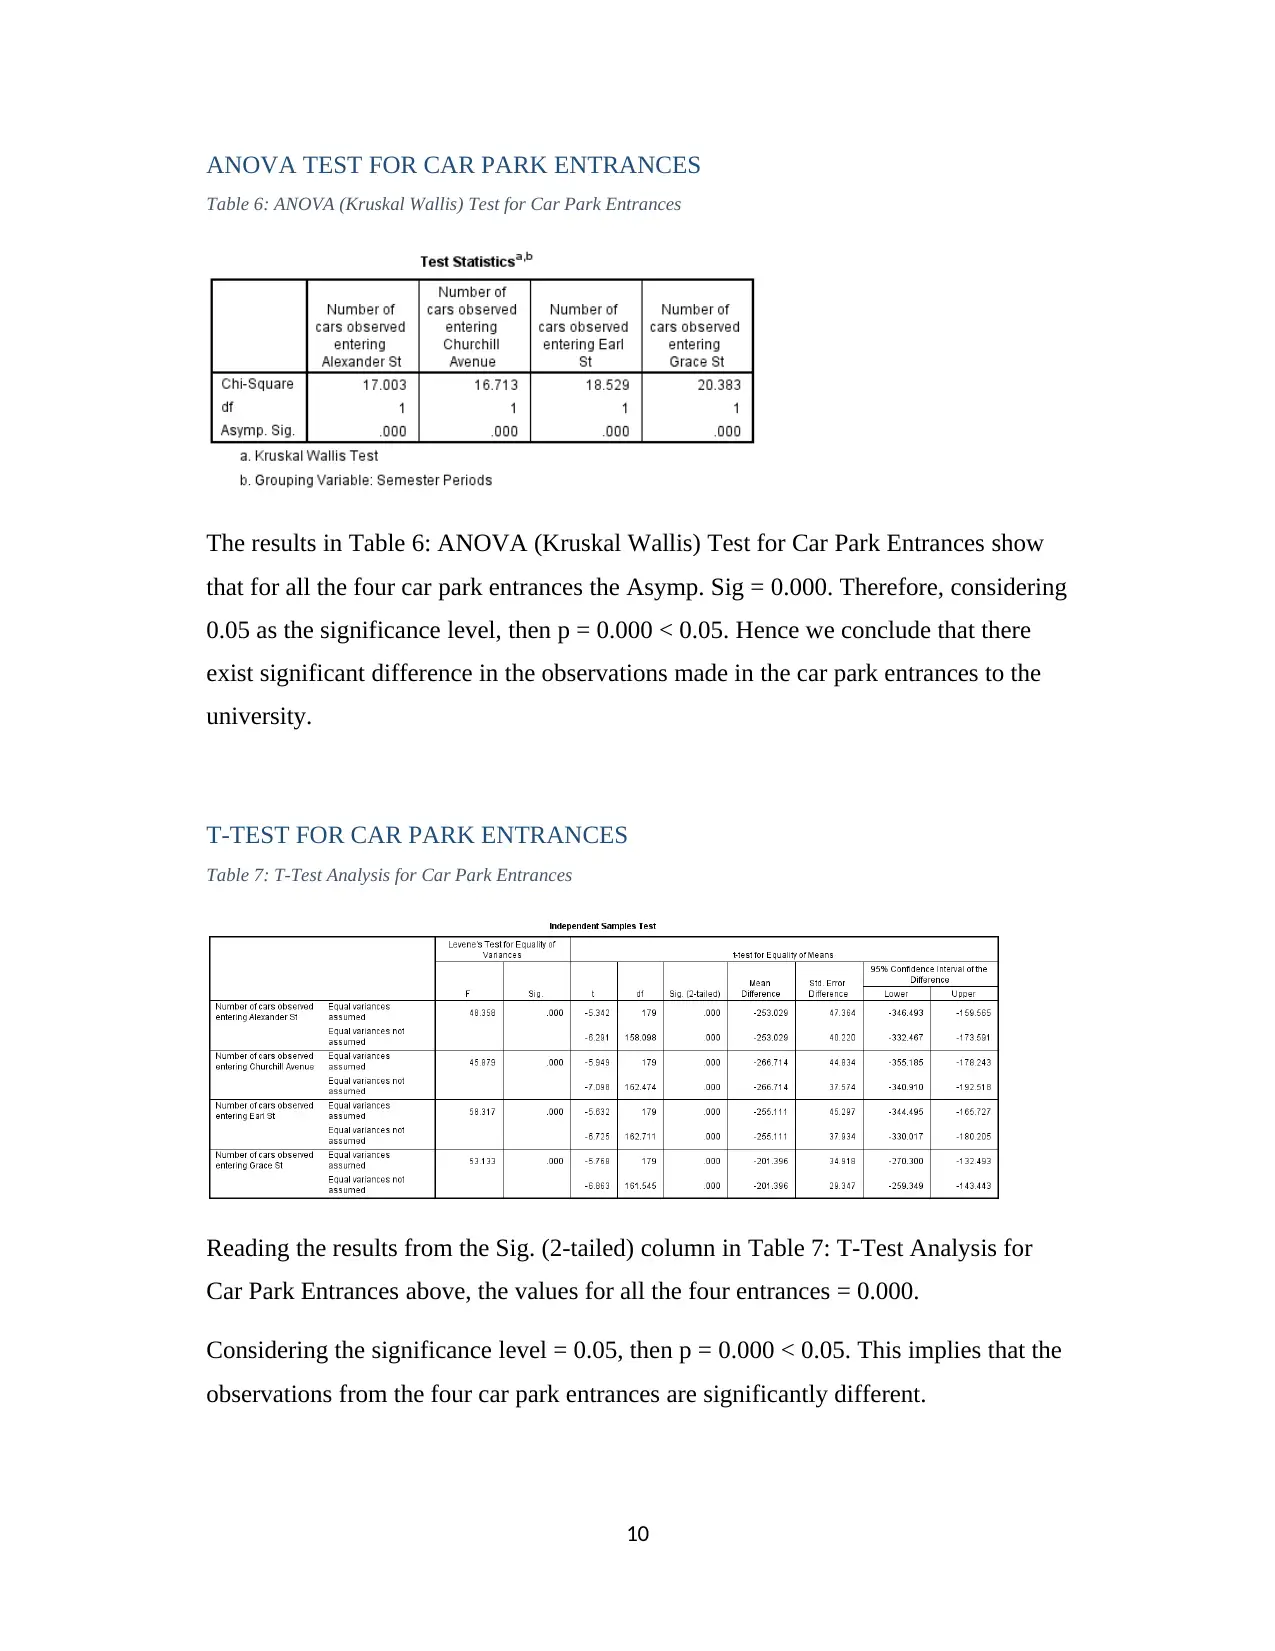
Table 6: ANOVA (Kruskal Wallis) Test for Car Park Entrances
The results in Table 6: ANOVA (Kruskal Wallis) Test for Car Park Entrances show
that for all the four car park entrances the Asymp. Sig = 0.000. Therefore, considering
0.05 as the significance level, then p = 0.000 < 0.05. Hence we conclude that there
exist significant difference in the observations made in the car park entrances to the
university.
T-TEST FOR CAR PARK ENTRANCES
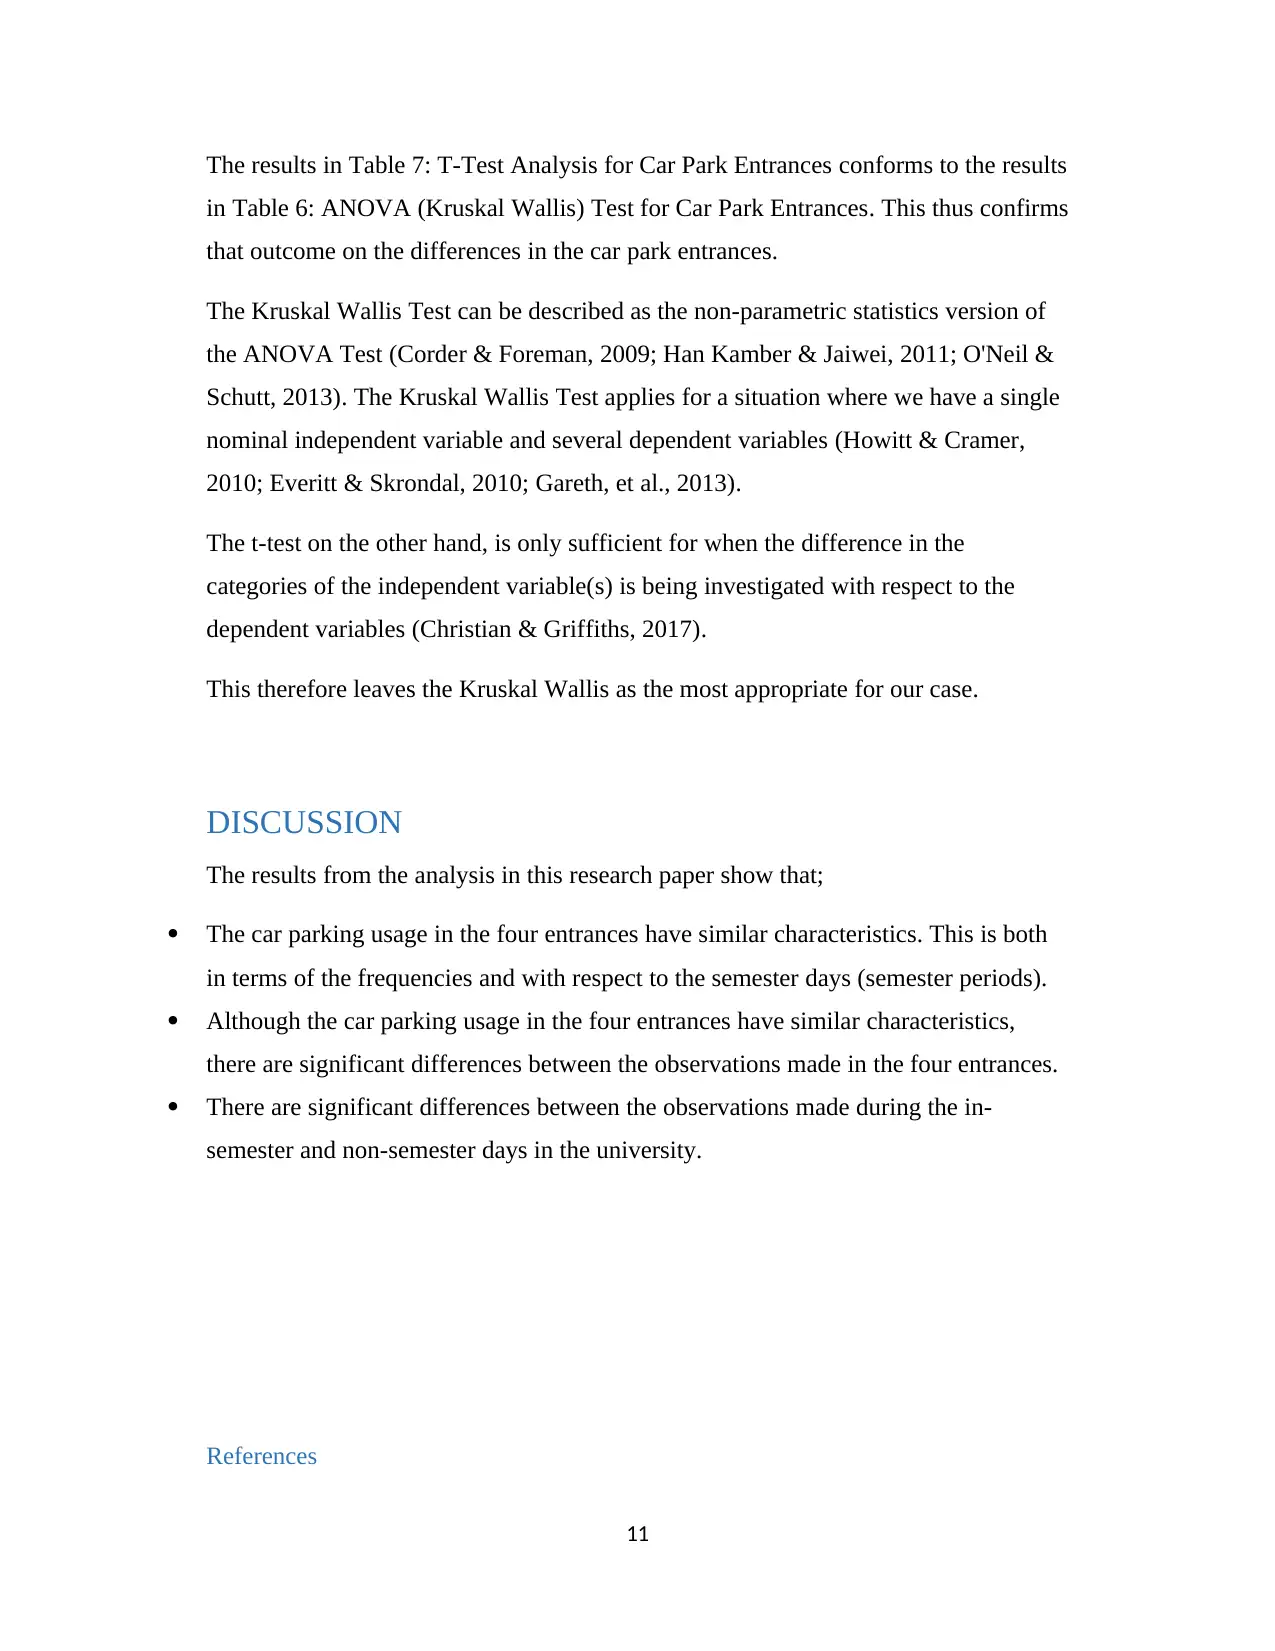
Table 7: T-Test Analysis for Car Park Entrances
Reading the results from the Sig. (2-tailed) column in Table 7: T-Test Analysis for
Car Park Entrances above, the values for all the four entrances = 0.000.
Considering the significance level = 0.05, then p = 0.000 < 0.05. This implies that the
observations from the four car park entrances are significantly different.
10
Table 6: ANOVA (Kruskal Wallis) Test for Car Park Entrances
The results in Table 6: ANOVA (Kruskal Wallis) Test for Car Park Entrances show
that for all the four car park entrances the Asymp. Sig = 0.000. Therefore, considering
0.05 as the significance level, then p = 0.000 < 0.05. Hence we conclude that there
exist significant difference in the observations made in the car park entrances to the
university.
T-TEST FOR CAR PARK ENTRANCES
Table 7: T-Test Analysis for Car Park Entrances
Reading the results from the Sig. (2-tailed) column in Table 7: T-Test Analysis for
Car Park Entrances above, the values for all the four entrances = 0.000.
Considering the significance level = 0.05, then p = 0.000 < 0.05. This implies that the
observations from the four car park entrances are significantly different.
10
Paraphrase This Document
Need a fresh take? Get an instant paraphrase of this document with our AI Paraphraser
The results in Table 7: T-Test Analysis for Car Park Entrances conforms to the results
in Table 6: ANOVA (Kruskal Wallis) Test for Car Park Entrances. This thus confirms
that outcome on the differences in the car park entrances.
The Kruskal Wallis Test can be described as the non-parametric statistics version of
the ANOVA Test (Corder & Foreman, 2009; Han Kamber & Jaiwei, 2011; O'Neil &
Schutt, 2013). The Kruskal Wallis Test applies for a situation where we have a single
nominal independent variable and several dependent variables (Howitt & Cramer,
2010; Everitt & Skrondal, 2010; Gareth, et al., 2013).
The t-test on the other hand, is only sufficient for when the difference in the
categories of the independent variable(s) is being investigated with respect to the
dependent variables (Christian & Griffiths, 2017).
This therefore leaves the Kruskal Wallis as the most appropriate for our case.
DISCUSSION
The results from the analysis in this research paper show that;
The car parking usage in the four entrances have similar characteristics. This is both
in terms of the frequencies and with respect to the semester days (semester periods).
Although the car parking usage in the four entrances have similar characteristics,
there are significant differences between the observations made in the four entrances.
There are significant differences between the observations made during the in-
semester and non-semester days in the university.
References
11
Anthony, S. D. & Johnson, M. W., 2008. Innovator's Guide to Growth. 1st ed. New
York: Havard Business School Press.
Babbie, E. R., 2010. The Practice of Social Research 12th edition. 1st ed. Belmont,
CA: Wadsworth Cengage.
Barbara, I. & Susan, D., 2014. Introductory Statistics. 1st ed. New York: OpenStax
CNX.
Christian, B. & Griffiths, T., 2017. Algorithms To Live By:The Computer Science of
Human Decisions. London: William Collins.
Corder, G. W. & Foreman, D. I., 2009. Non Parametric Statistics for Non
Statisticians. pp. 99-105. 1st ed. Hoboken: John Wiley & Sons.
Everitt, B. S. & Skrondal, A., 2010. Cambridge Dictionary of Statistics. 4th ed.
London: Cambridge University Press.
Farris, P. W. & Neil, B. T., 2010. Marketing Metrics. 2nd ed. New Jersey: Pearson
Education.
Freedman, D. A., 2009. Statistical Models: Theory and Practice. 1st ed. London:
Cambridge University Press.
F, U. & S, P., 2008. From data mining to Knowledge Discovery in Databases. 4th ed.
New York: CRC Press.
Gareth, J., Daniela, W., Trevor, H. & Robert, T., 2013. An Introduction to Statistical
Learning. pp 204. 3rd ed. New York: Springer.
Han Kamber & Jaiwei, P., 2011. Data Mining: Concepts and Techniques. 3rd ed.
London: Morgan Kaufman.
Howitt, D. & Cramer, D., 2010. Introduction to Descriptive Statistics in Psycology,
5th Edition. New York: Prentice Hall.
Kiechel, W., 2010. The Lords of Strategy. 2nd ed. New York: Havard Business Press.
12
⊘ This is a preview!⊘
Do you want full access?
Subscribe today to unlock all pages.
Trusted by 1+ million students worldwide
1 out of 13


Your All-in-One AI-Powered Toolkit for Academic Success.
+13062052269
info@desklib.com
Available 24*7 on WhatsApp / Email
![[object Object]](/_next/static/media/star-bottom.7253800d.svg)
Unlock your academic potential
Copyright © 2020–2026 A2Z Services. All Rights Reserved. Developed and managed by ZUCOL.