UNL1004 Economics: Analyzing UK Christmas 2021 Supply & Demand
VerifiedAdded on 2023/06/13
|15
|3072
|323
Report
AI Summary
This report analyzes the supply and demand dynamics in the UK economy, focusing on the Christmas 2021 period, which was marked by potential shortages of key Christmas products. It explains the concepts of supply, demand, and market equilibrium, highlighting how shifts in supply and demand curves impact prices and quantities. The report also discusses the role of elasticity theory in understanding the economy's dynamics. The analysis considers factors like Brexit and the Covid-19 pandemic, which led to decreased supply due to labor shortages and transport difficulties. Different market conditions, including shifts in supply and demand curves to the left and right, are examined to explain the price hikes and shortages observed during that period. Elastic and inelastic demand scenarios are also explored to illustrate how price changes affect quantity demanded, using examples relevant to the UK market.
Economic
Paraphrase This Document
Need a fresh take? Get an instant paraphrase of this document with our AI Paraphraser
Contents
INTRODUCTION ..........................................................................................................................3
MAIN BODY..................................................................................................................................4
Basic Supply and Demand Equilibrium:.....................................................................................4
Supply Curve shift to the Right...................................................................................................5
Supply curve shift to the Left:.....................................................................................................6
Demand curve shift to the Right:.................................................................................................7
Demand curve shift to the Left:...................................................................................................9
Elastic Demand:.........................................................................................................................10
Inelastic Demand:......................................................................................................................11
Elastic Supply:...........................................................................................................................12
Inelastic Supply: .......................................................................................................................12
CONCLUSION ............................................................................................................................13
REFERENCES..............................................................................................................................14
INTRODUCTION
The coronavirus pandemic has been a dreadful era of time which is yet in action. The year 2020
was the worst for most of the businesses in an around the world. The UK economy was hit
severely and saw the lowest GDP in last many years. During the second half of the year 2021,
the emergence of new covid-19 variant brought the economies working in and around the world
to put regulations on the markets. The UK government restricted the markets in and around the
country. The last minute lockdown brought the supply of different products in the market very
down and affected the availability of products during the celebration time of Christmas. The
supply was affected due to lack of lorry drivers and workers in the industry due to the
aftereffects of Brexit and Covid-19 restrictions. The workers were forced to leave their
workplace and return to their homecountries after the Brexit. The demand in the economy was
not able to meet by the suppliers as there were lack of resources to supply different products.
Demand refers to the term used in economics which refers to the number of goods and services
which the consumers in an economy are willing and able to purchase at a given price at a point
in time. The concept of demand in the theory of economics is based on the ability of the
consumers to pay for a particular good. The price which is paid for particular goods and services
is called the price, and the quantity which is being purchased by the consumer is called the
quantity demanded. For example, as the price of the water bottle rises, the demand for the same
decreases. This inverse relationship between the price and the quantity demanded is the law of
demand.
Supply refers to the number of goods and services which are produced by a manufacturer and
are supplied at a particular price (Acay, Bas, and Abdeljawad, 2020). The price at which the
quantity is supplied by the supplier is known as the price. That means, if there is any rise in the
price of the commodity, the quantity supplied for the commodity tends to rise as the producers
wish to supply more at an increased amount. For example, the market price of the ball pen in the
market rises, the producers supply more quantity to maximize their revenues and profit at this
higher market price. This positive relationship between the price and the quantity supplied is
known as the law of supply.
Market Equilibrium refers to the condition of equilibrium in the market where the demand and
the supply of the goods and services meet. The equilibrium price of the commodity is the price
at which the goods and services of the business are going to be sold and purchased. And the
⊘ This is a preview!⊘
Do you want full access?
Subscribe today to unlock all pages.
Trusted by 1+ million students worldwide
quantity is the quantity at which it is going to be supplied in the market. This interaction is
important for an economy as it helps in deciding the price and the number of goods to be sold.
The following report highlights the concept of market equilibrium and how it is determined
when there is any shift in the demand and the supply of a commodity (Acay, Bas, and
Abdeljawad, 2020). Different aspects are discussed, including the demand and supply are elastic
and inelastic. The interpretation is made using the economic issues which developed in the
market of UK near to the Christmas of 2021.
MAIN BODY
The UK, in the second last and last quarter of the year 2021, has faced many challenges due to
the bad impacts of Brexit and the Covid-19 pandemic. The demand for the different goods and
commodities was at its peak in the holiday season of Christmas. The UK has seen a deteriorating
supply of necessary and luxury goods in the market due to the higher demand in the holiday
season. The supply related to turkeys and pigs was very low due to the decrease in the output
from these industries (Cherunilam, 2020). The main reasons for this decrease have been seen
due to the bad impacts of Brexit and Covid-19, like decreased production involuntary
unemployment due to the fewer workers from other countries. The different market conditions
are discussed below to better understand the conditions that have arisen in the case of the UK.
Paraphrase This Document
Need a fresh take? Get an instant paraphrase of this document with our AI Paraphraser
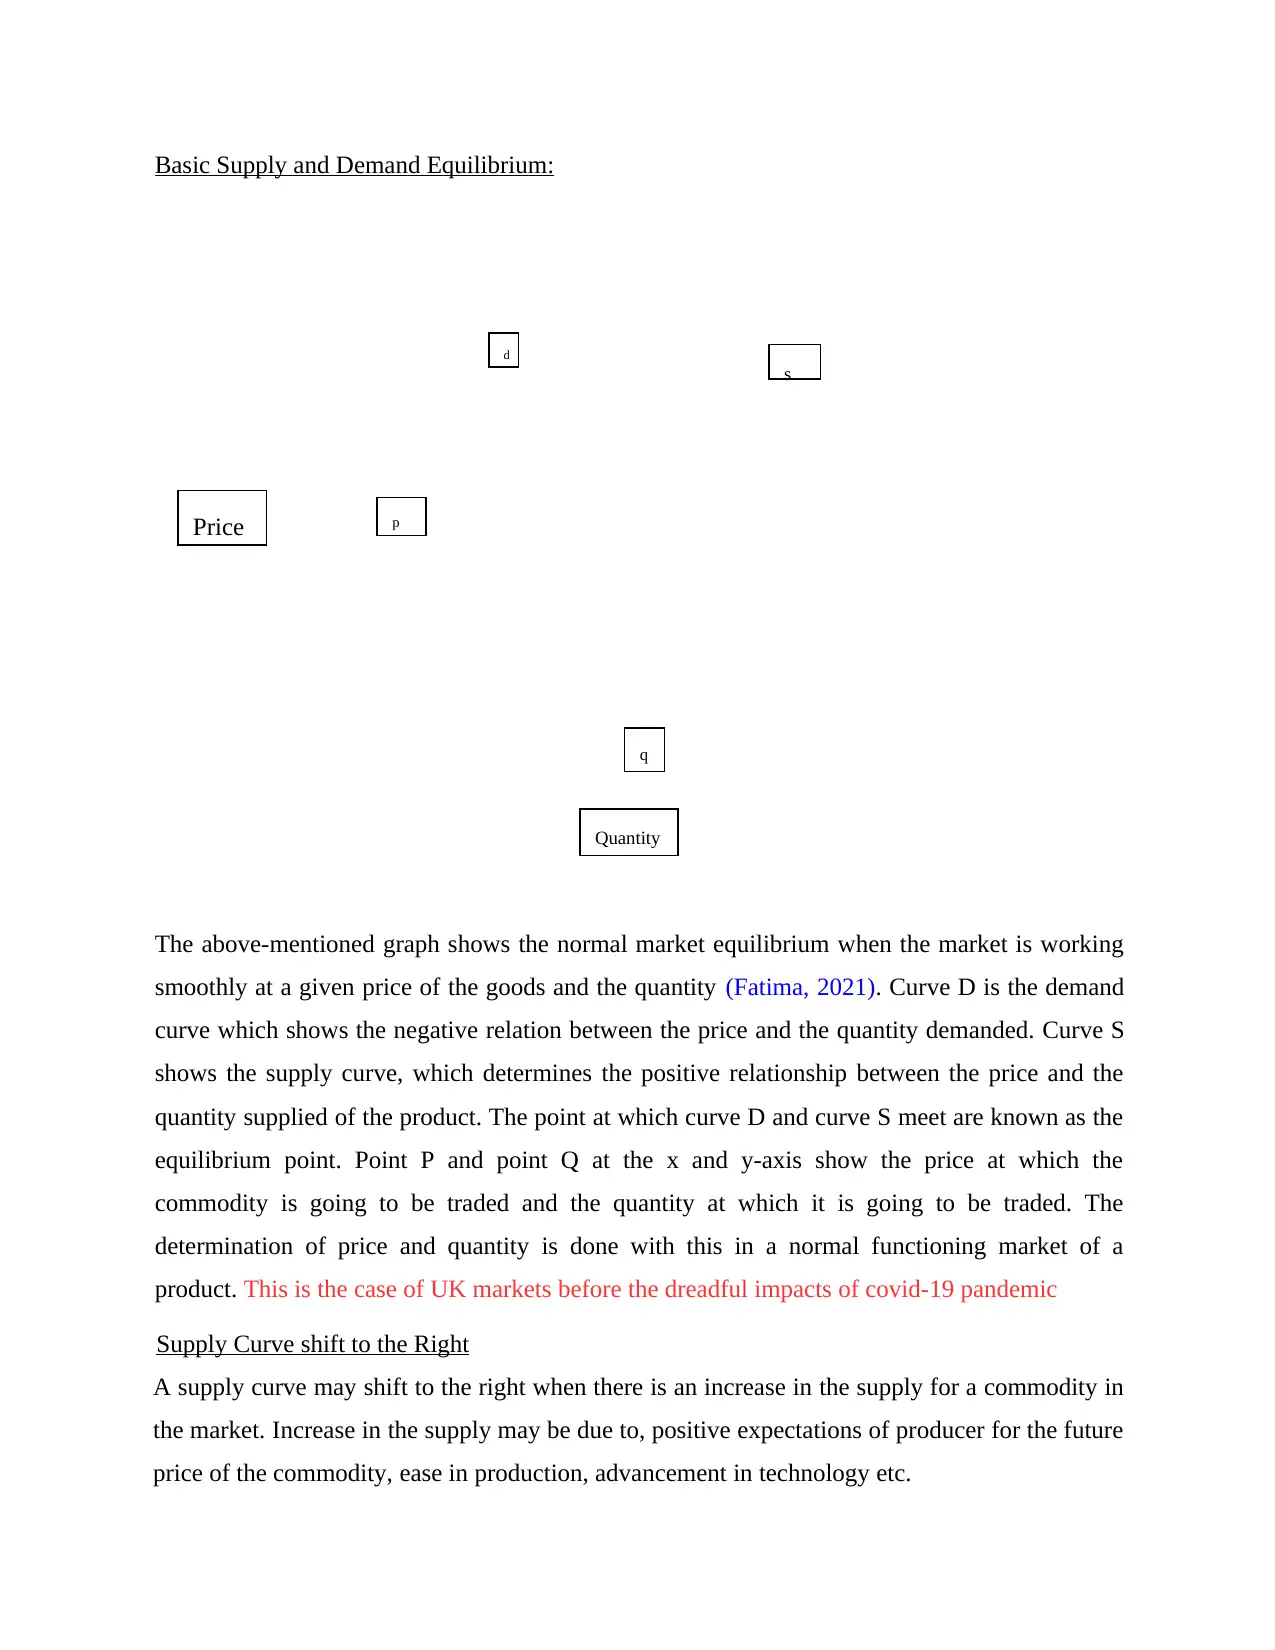
Basic Supply and Demand Equilibrium:
The above-mentioned graph shows the normal market equilibrium when the market is working
smoothly at a given price of the goods and the quantity (Fatima, 2021). Curve D is the demand
curve which shows the negative relation between the price and the quantity demanded. Curve S
shows the supply curve, which determines the positive relationship between the price and the
quantity supplied of the product. The point at which curve D and curve S meet are known as the
equilibrium point. Point P and point Q at the x and y-axis show the price at which the
commodity is going to be traded and the quantity at which it is going to be traded. The
determination of price and quantity is done with this in a normal functioning market of a
product. This is the case of UK markets before the dreadful impacts of covid-19 pandemic
Supply Curve shift to the Right
A supply curve may shift to the right when there is an increase in the supply for a commodity in
the market. Increase in the supply may be due to, positive expectations of producer for the future
price of the commodity, ease in production, advancement in technology etc.
Price
d
s
p
Quantity
q
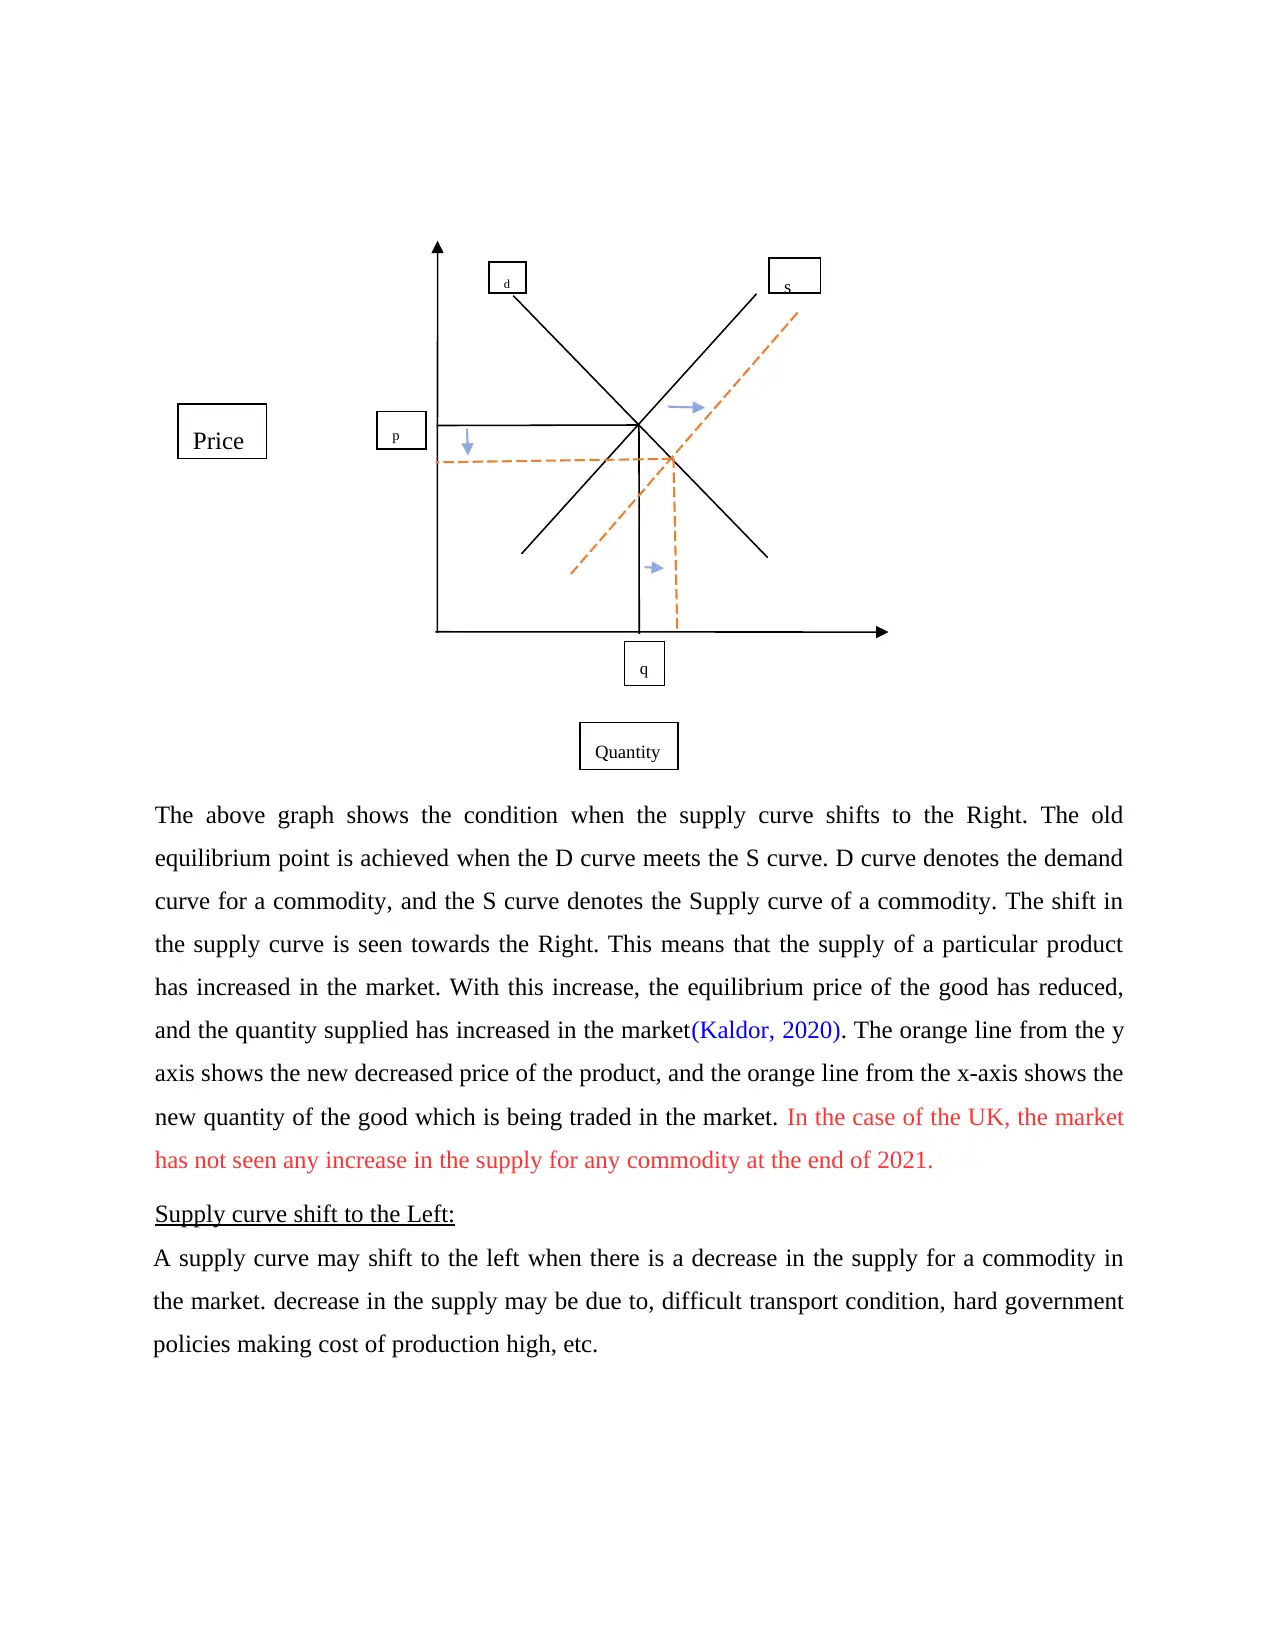
The above graph shows the condition when the supply curve shifts to the Right. The old
equilibrium point is achieved when the D curve meets the S curve. D curve denotes the demand
curve for a commodity, and the S curve denotes the Supply curve of a commodity. The shift in
the supply curve is seen towards the Right. This means that the supply of a particular product
has increased in the market. With this increase, the equilibrium price of the good has reduced,
and the quantity supplied has increased in the market(Kaldor, 2020). The orange line from the y
axis shows the new decreased price of the product, and the orange line from the x-axis shows the
new quantity of the good which is being traded in the market. In the case of the UK, the market
has not seen any increase in the supply for any commodity at the end of 2021.
Supply curve shift to the Left:
A supply curve may shift to the left when there is a decrease in the supply for a commodity in
the market. decrease in the supply may be due to, difficult transport condition, hard government
policies making cost of production high, etc.
Price
d s
p
Quantity
q
⊘ This is a preview!⊘
Do you want full access?
Subscribe today to unlock all pages.
Trusted by 1+ million students worldwide
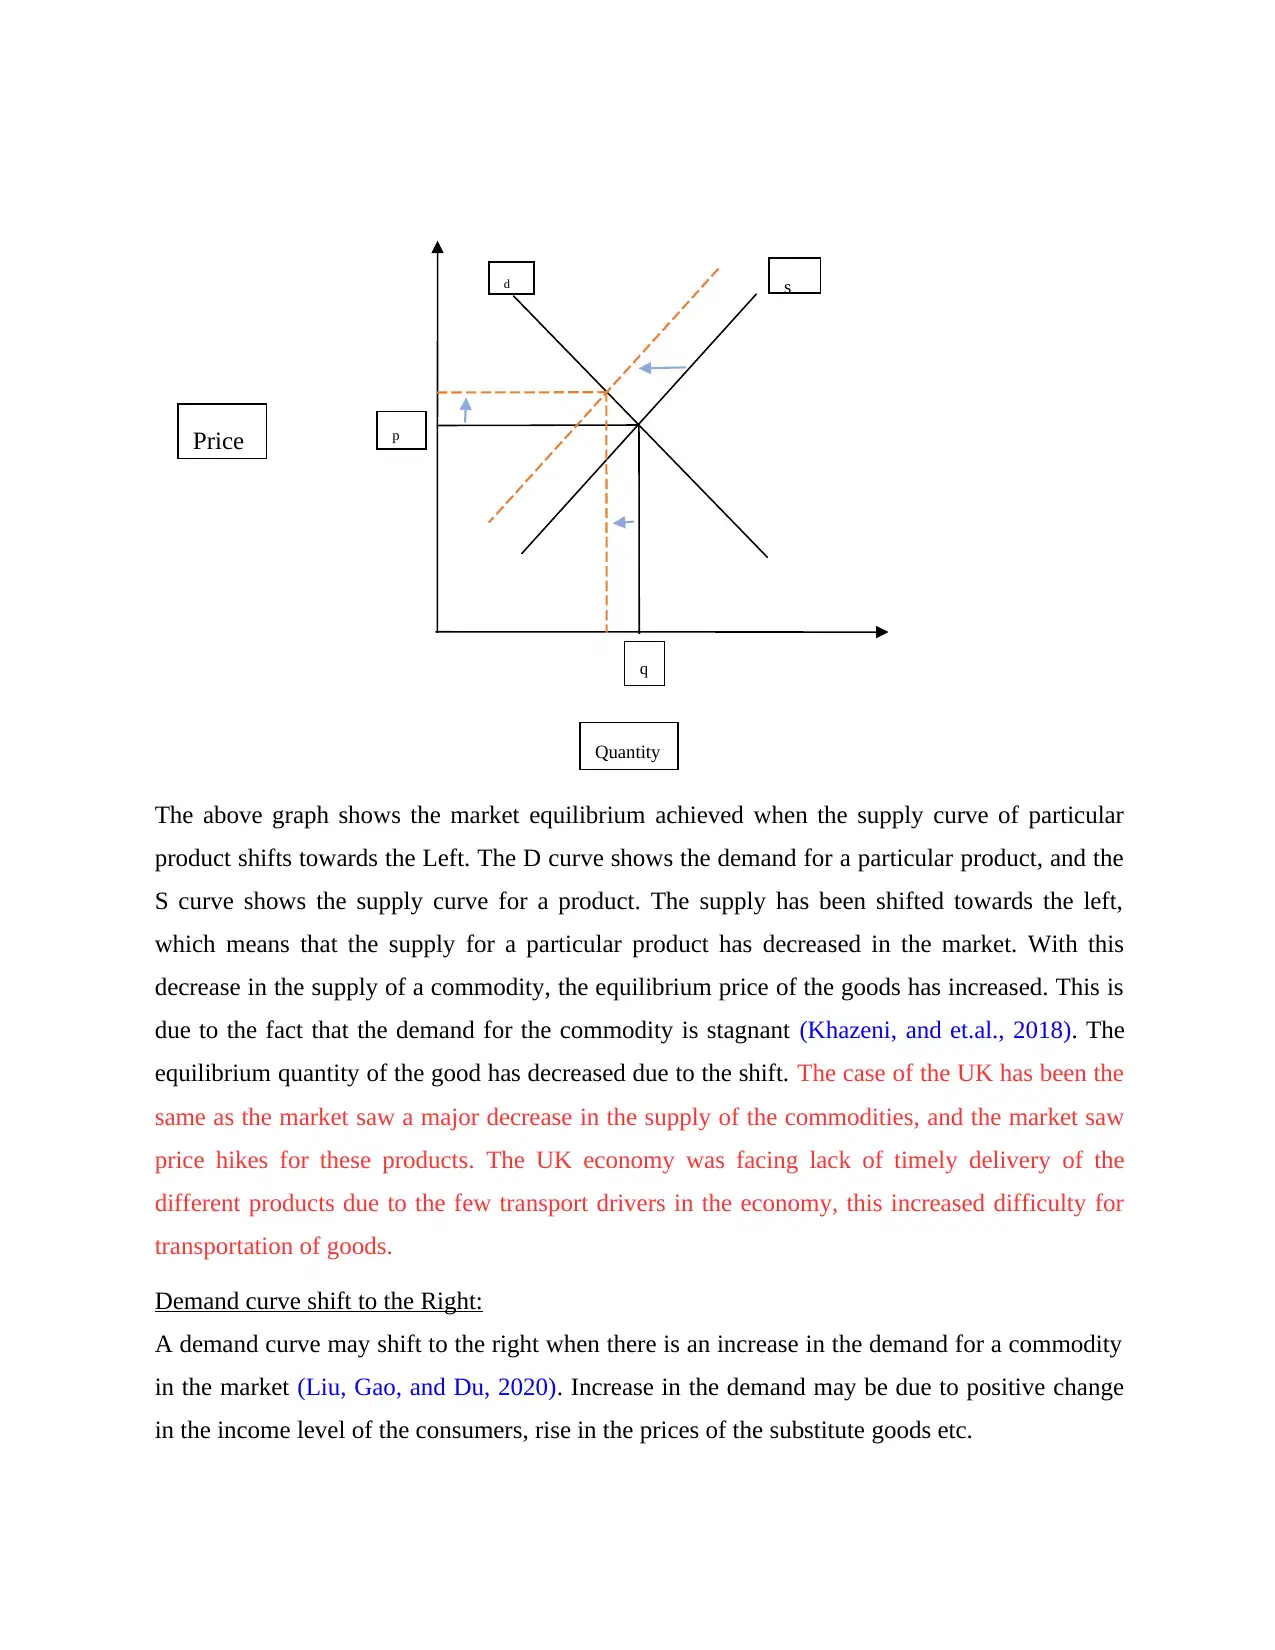
The above graph shows the market equilibrium achieved when the supply curve of particular
product shifts towards the Left. The D curve shows the demand for a particular product, and the
S curve shows the supply curve for a product. The supply has been shifted towards the left,
which means that the supply for a particular product has decreased in the market. With this
decrease in the supply of a commodity, the equilibrium price of the goods has increased. This is
due to the fact that the demand for the commodity is stagnant (Khazeni, and et.al., 2018). The
equilibrium quantity of the good has decreased due to the shift. The case of the UK has been the
same as the market saw a major decrease in the supply of the commodities, and the market saw
price hikes for these products. The UK economy was facing lack of timely delivery of the
different products due to the few transport drivers in the economy, this increased difficulty for
transportation of goods.
Demand curve shift to the Right:
A demand curve may shift to the right when there is an increase in the demand for a commodity
in the market (Liu, Gao, and Du, 2020). Increase in the demand may be due to positive change
in the income level of the consumers, rise in the prices of the substitute goods etc.
Price
d s
p
Quantity
q
Paraphrase This Document
Need a fresh take? Get an instant paraphrase of this document with our AI Paraphraser
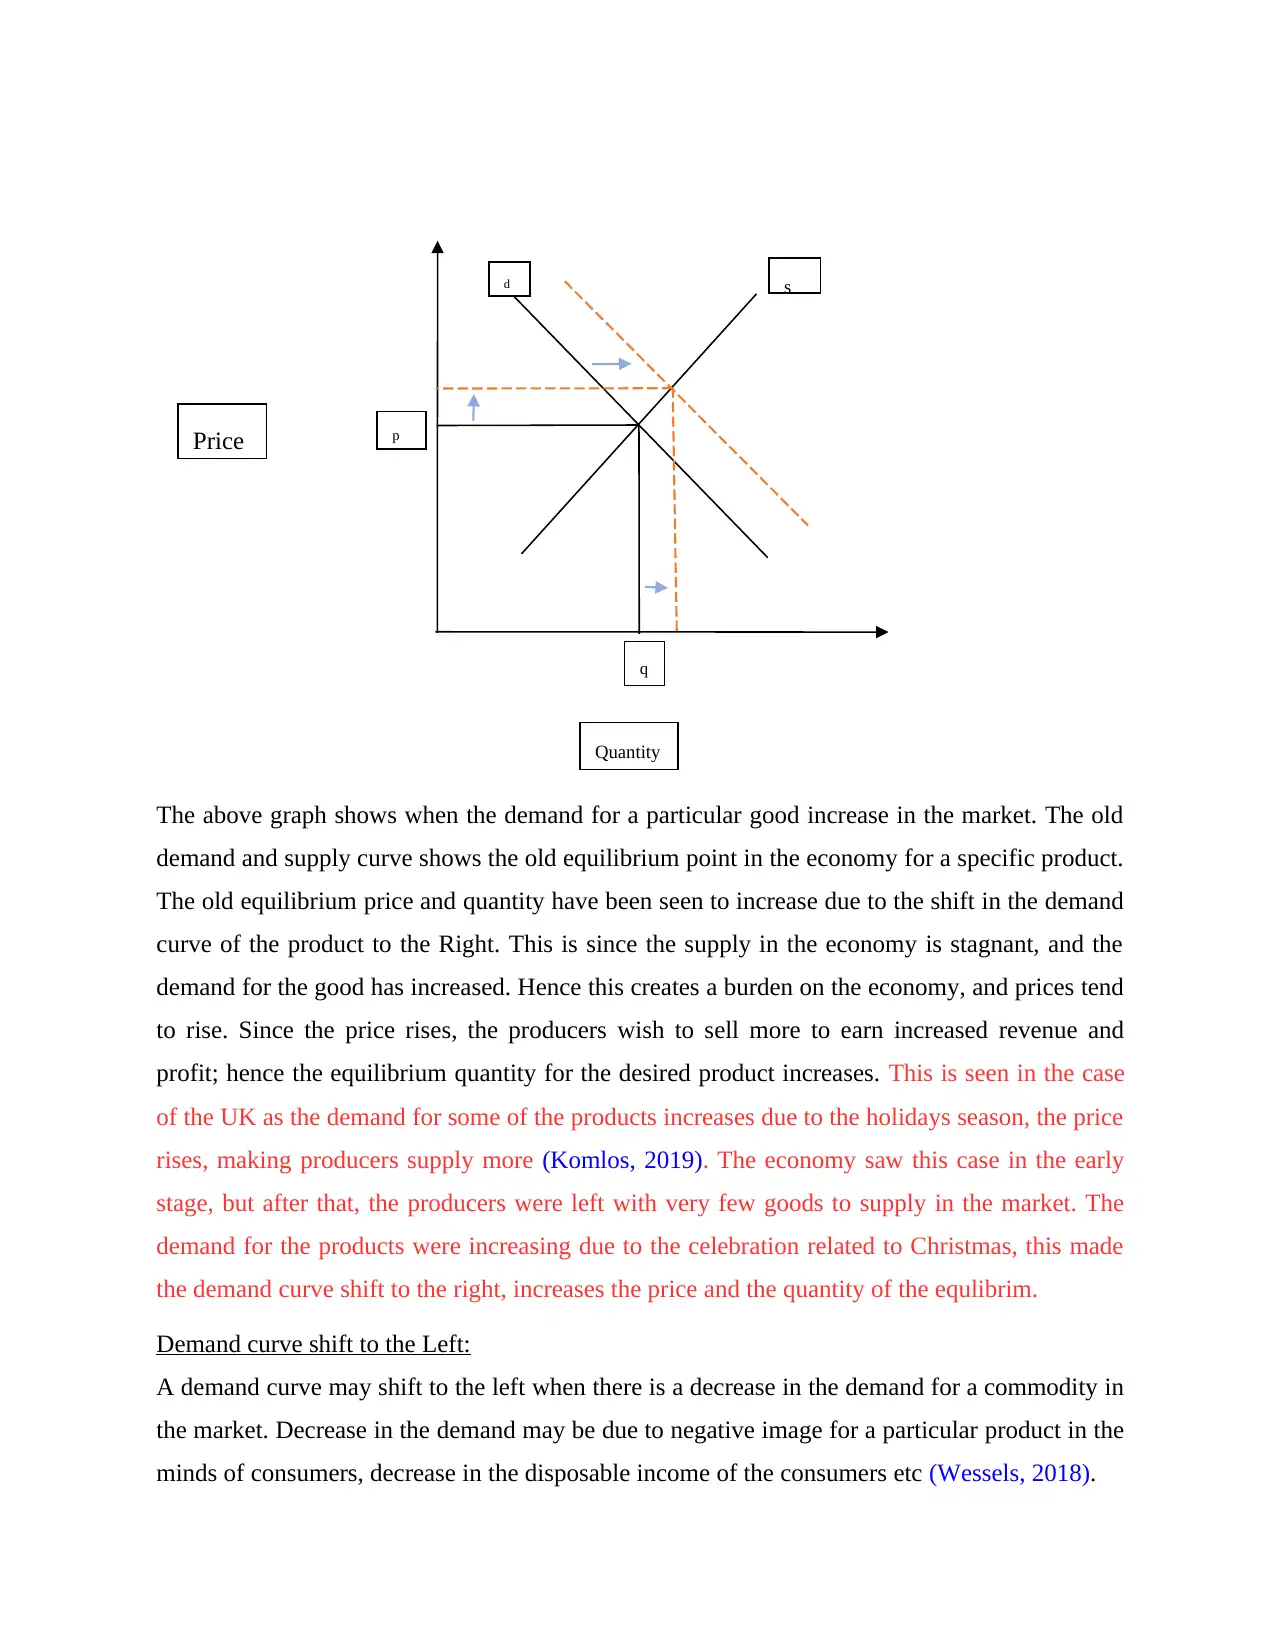
The above graph shows when the demand for a particular good increase in the market. The old
demand and supply curve shows the old equilibrium point in the economy for a specific product.
The old equilibrium price and quantity have been seen to increase due to the shift in the demand
curve of the product to the Right. This is since the supply in the economy is stagnant, and the
demand for the good has increased. Hence this creates a burden on the economy, and prices tend
to rise. Since the price rises, the producers wish to sell more to earn increased revenue and
profit; hence the equilibrium quantity for the desired product increases. This is seen in the case
of the UK as the demand for some of the products increases due to the holidays season, the price
rises, making producers supply more (Komlos, 2019). The economy saw this case in the early
stage, but after that, the producers were left with very few goods to supply in the market. The
demand for the products were increasing due to the celebration related to Christmas, this made
the demand curve shift to the right, increases the price and the quantity of the equlibrim.
Demand curve shift to the Left:
A demand curve may shift to the left when there is a decrease in the demand for a commodity in
the market. Decrease in the demand may be due to negative image for a particular product in the
minds of consumers, decrease in the disposable income of the consumers etc (Wessels, 2018).
Price
d s
p
Quantity
q
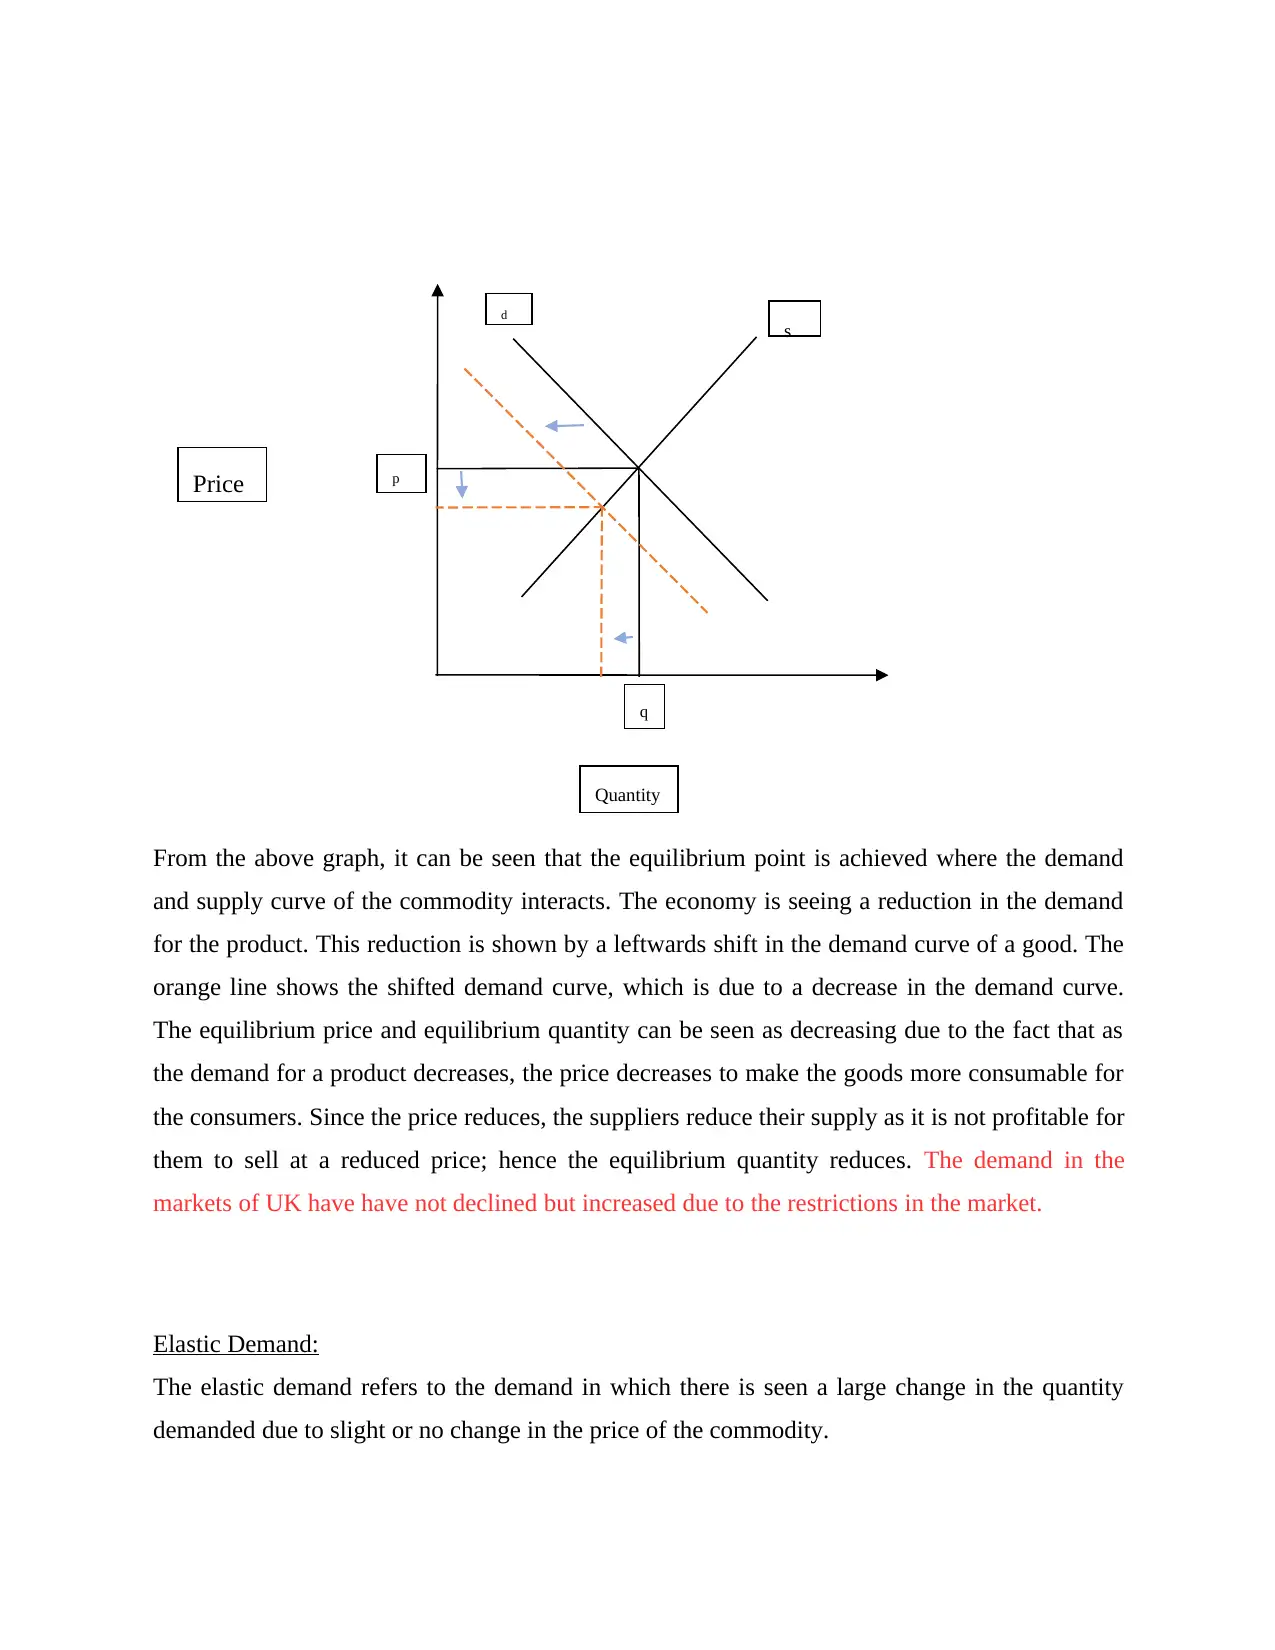
From the above graph, it can be seen that the equilibrium point is achieved where the demand
and supply curve of the commodity interacts. The economy is seeing a reduction in the demand
for the product. This reduction is shown by a leftwards shift in the demand curve of a good. The
orange line shows the shifted demand curve, which is due to a decrease in the demand curve.
The equilibrium price and equilibrium quantity can be seen as decreasing due to the fact that as
the demand for a product decreases, the price decreases to make the goods more consumable for
the consumers. Since the price reduces, the suppliers reduce their supply as it is not profitable for
them to sell at a reduced price; hence the equilibrium quantity reduces. The demand in the
markets of UK have have not declined but increased due to the restrictions in the market.
Elastic Demand:
The elastic demand refers to the demand in which there is seen a large change in the quantity
demanded due to slight or no change in the price of the commodity.
Price
d
s
p
Quantity
q
⊘ This is a preview!⊘
Do you want full access?
Subscribe today to unlock all pages.
Trusted by 1+ million students worldwide
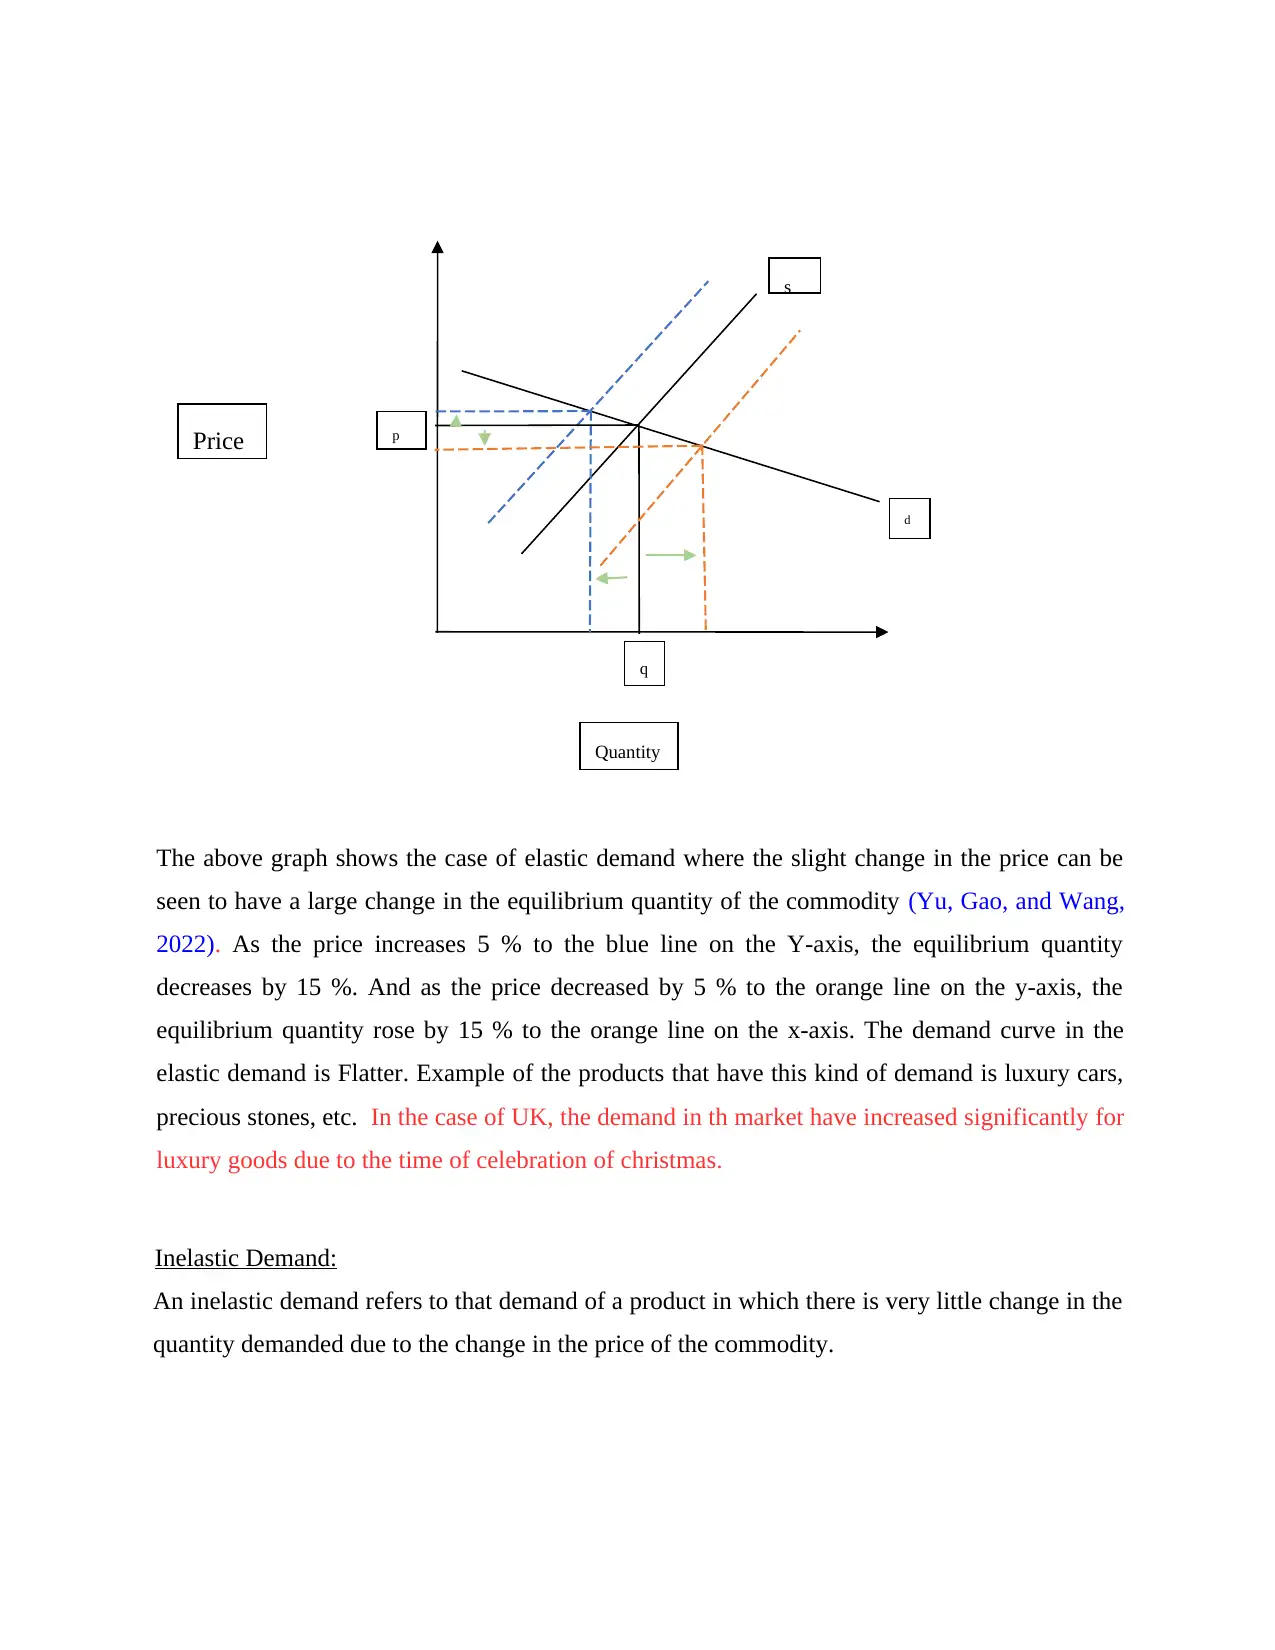
The above graph shows the case of elastic demand where the slight change in the price can be
seen to have a large change in the equilibrium quantity of the commodity (Yu, Gao, and Wang,
2022). As the price increases 5 % to the blue line on the Y-axis, the equilibrium quantity
decreases by 15 %. And as the price decreased by 5 % to the orange line on the y-axis, the
equilibrium quantity rose by 15 % to the orange line on the x-axis. The demand curve in the
elastic demand is Flatter. Example of the products that have this kind of demand is luxury cars,
precious stones, etc. In the case of UK, the demand in th market have increased significantly for
luxury goods due to the time of celebration of christmas.
Inelastic Demand:
An inelastic demand refers to that demand of a product in which there is very little change in the
quantity demanded due to the change in the price of the commodity.
Price
d
s
p
Quantity
q
Paraphrase This Document
Need a fresh take? Get an instant paraphrase of this document with our AI Paraphraser
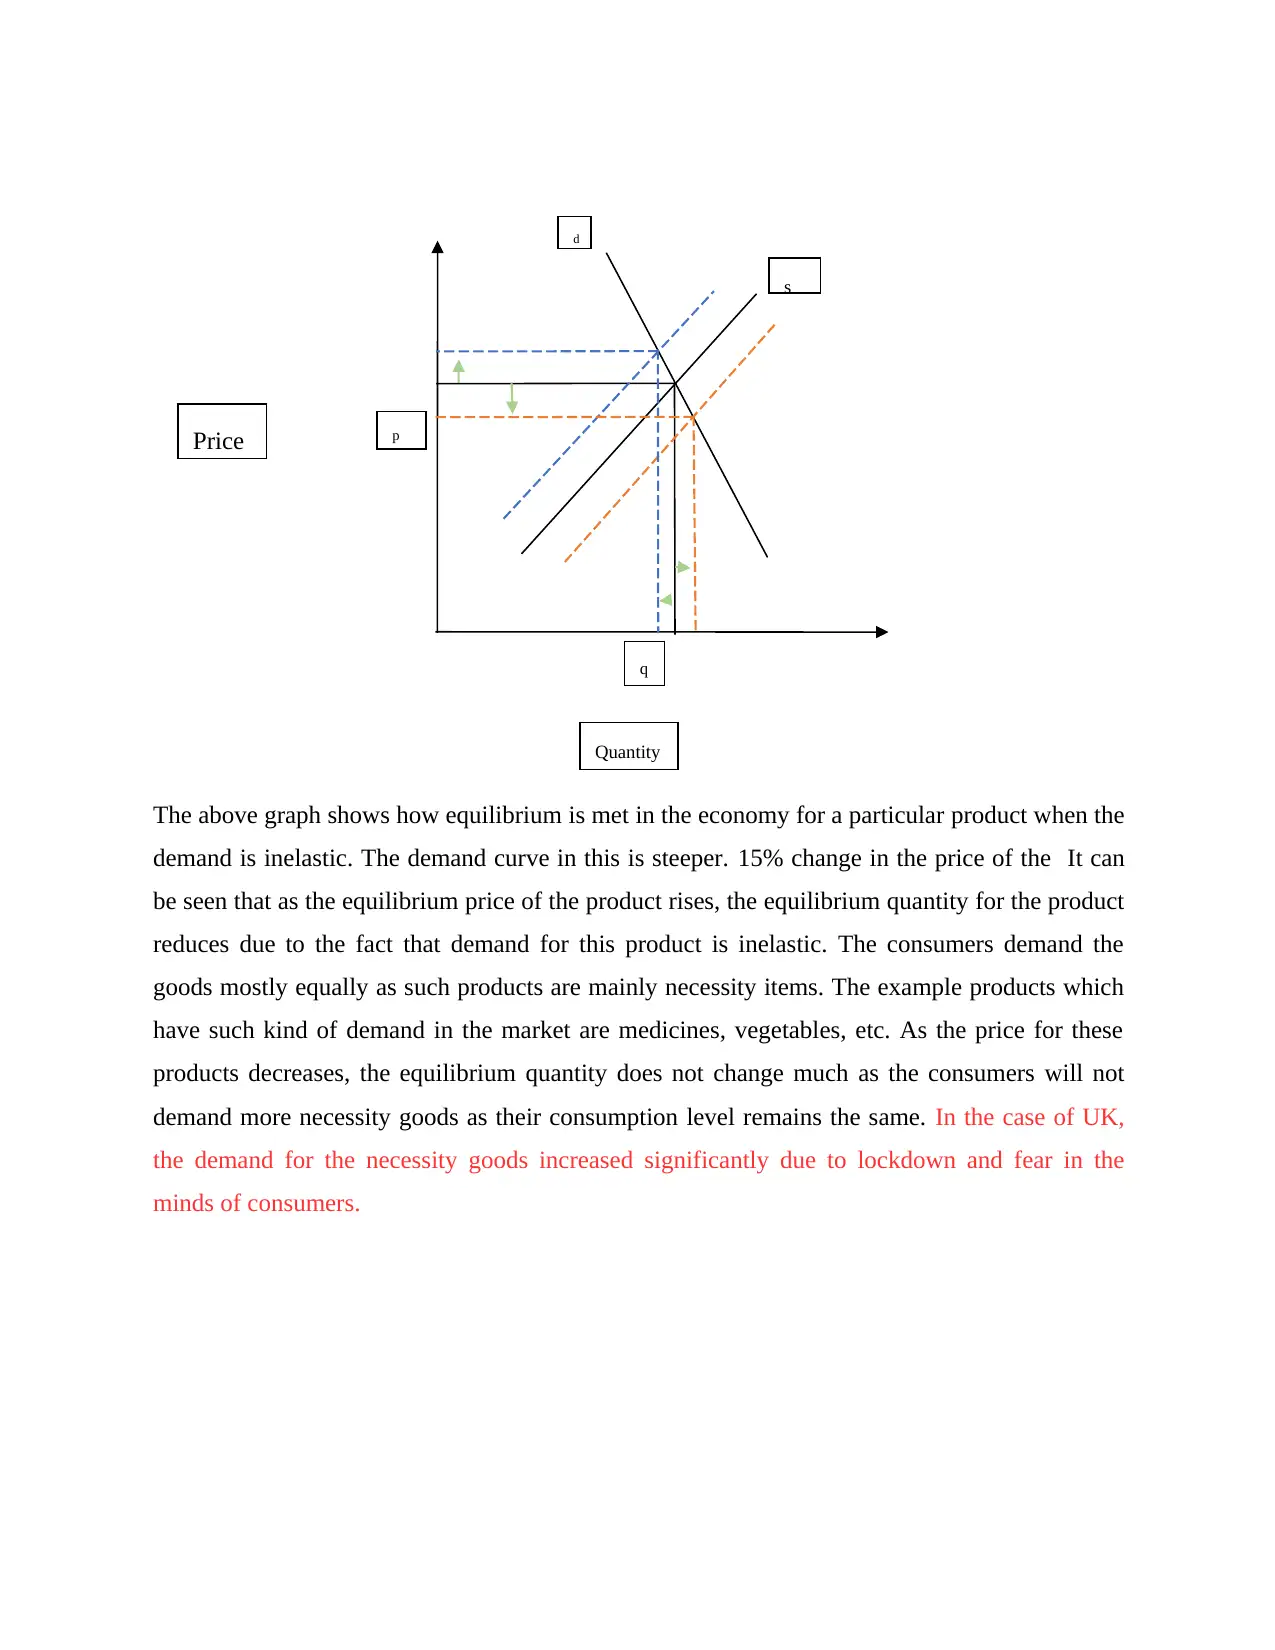
The above graph shows how equilibrium is met in the economy for a particular product when the
demand is inelastic. The demand curve in this is steeper. 15% change in the price of the It can
be seen that as the equilibrium price of the product rises, the equilibrium quantity for the product
reduces due to the fact that demand for this product is inelastic. The consumers demand the
goods mostly equally as such products are mainly necessity items. The example products which
have such kind of demand in the market are medicines, vegetables, etc. As the price for these
products decreases, the equilibrium quantity does not change much as the consumers will not
demand more necessity goods as their consumption level remains the same. In the case of UK,
the demand for the necessity goods increased significantly due to lockdown and fear in the
minds of consumers.
Price
d
s
p
Quantity
q
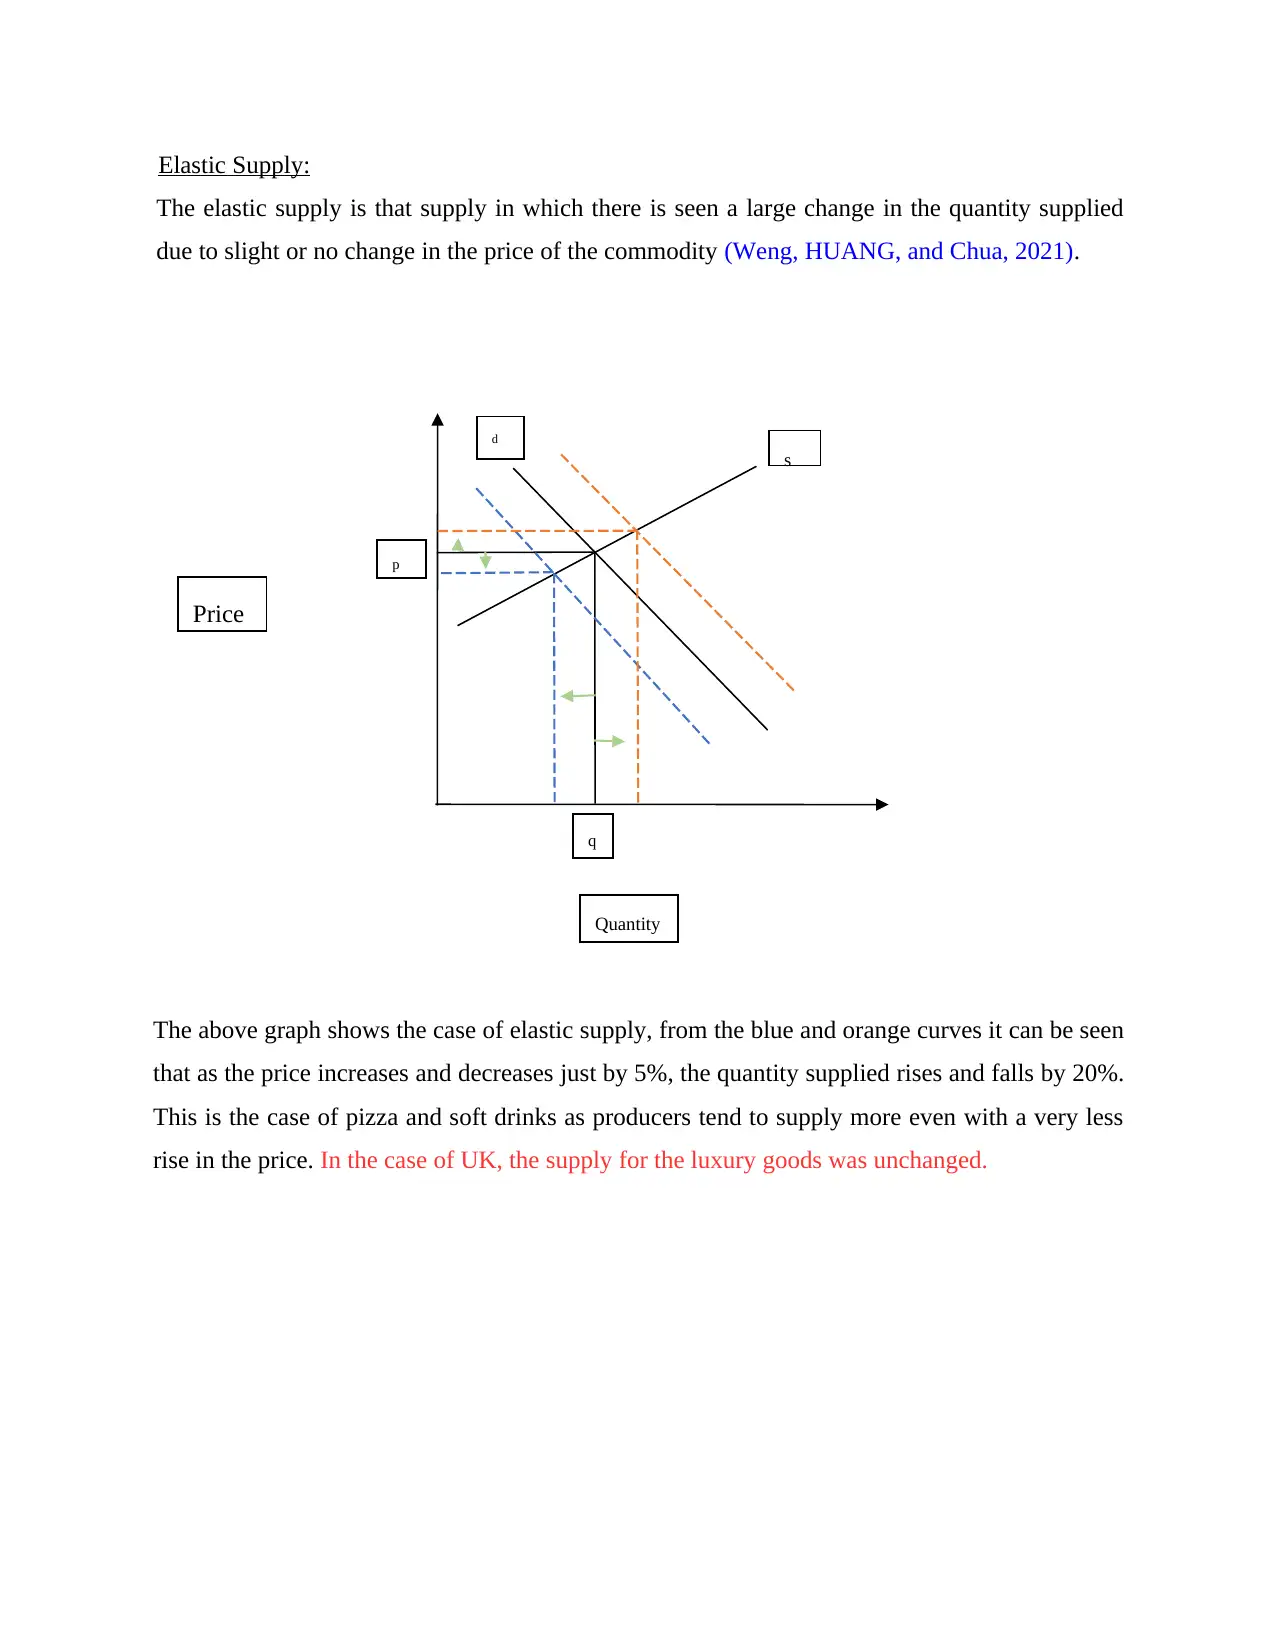
Elastic Supply:
The elastic supply is that supply in which there is seen a large change in the quantity supplied
due to slight or no change in the price of the commodity (Weng, HUANG, and Chua, 2021).
The above graph shows the case of elastic supply, from the blue and orange curves it can be seen
that as the price increases and decreases just by 5%, the quantity supplied rises and falls by 20%.
This is the case of pizza and soft drinks as producers tend to supply more even with a very less
rise in the price. In the case of UK, the supply for the luxury goods was unchanged.
Price
d
s
p
Quantity
q
⊘ This is a preview!⊘
Do you want full access?
Subscribe today to unlock all pages.
Trusted by 1+ million students worldwide
1 out of 15
Related Documents


Your All-in-One AI-Powered Toolkit for Academic Success.
+13062052269
info@desklib.com
Available 24*7 on WhatsApp / Email
![[object Object]](/_next/static/media/star-bottom.7253800d.svg)
Unlock your academic potential
Copyright © 2020–2026 A2Z Services. All Rights Reserved. Developed and managed by ZUCOL.