MAT10251 Statistical Analysis Project: Victoria Unleaded 91 Prices

Verified

Added on  2023/05/29

|3
|536
|187
Project
AI Summary
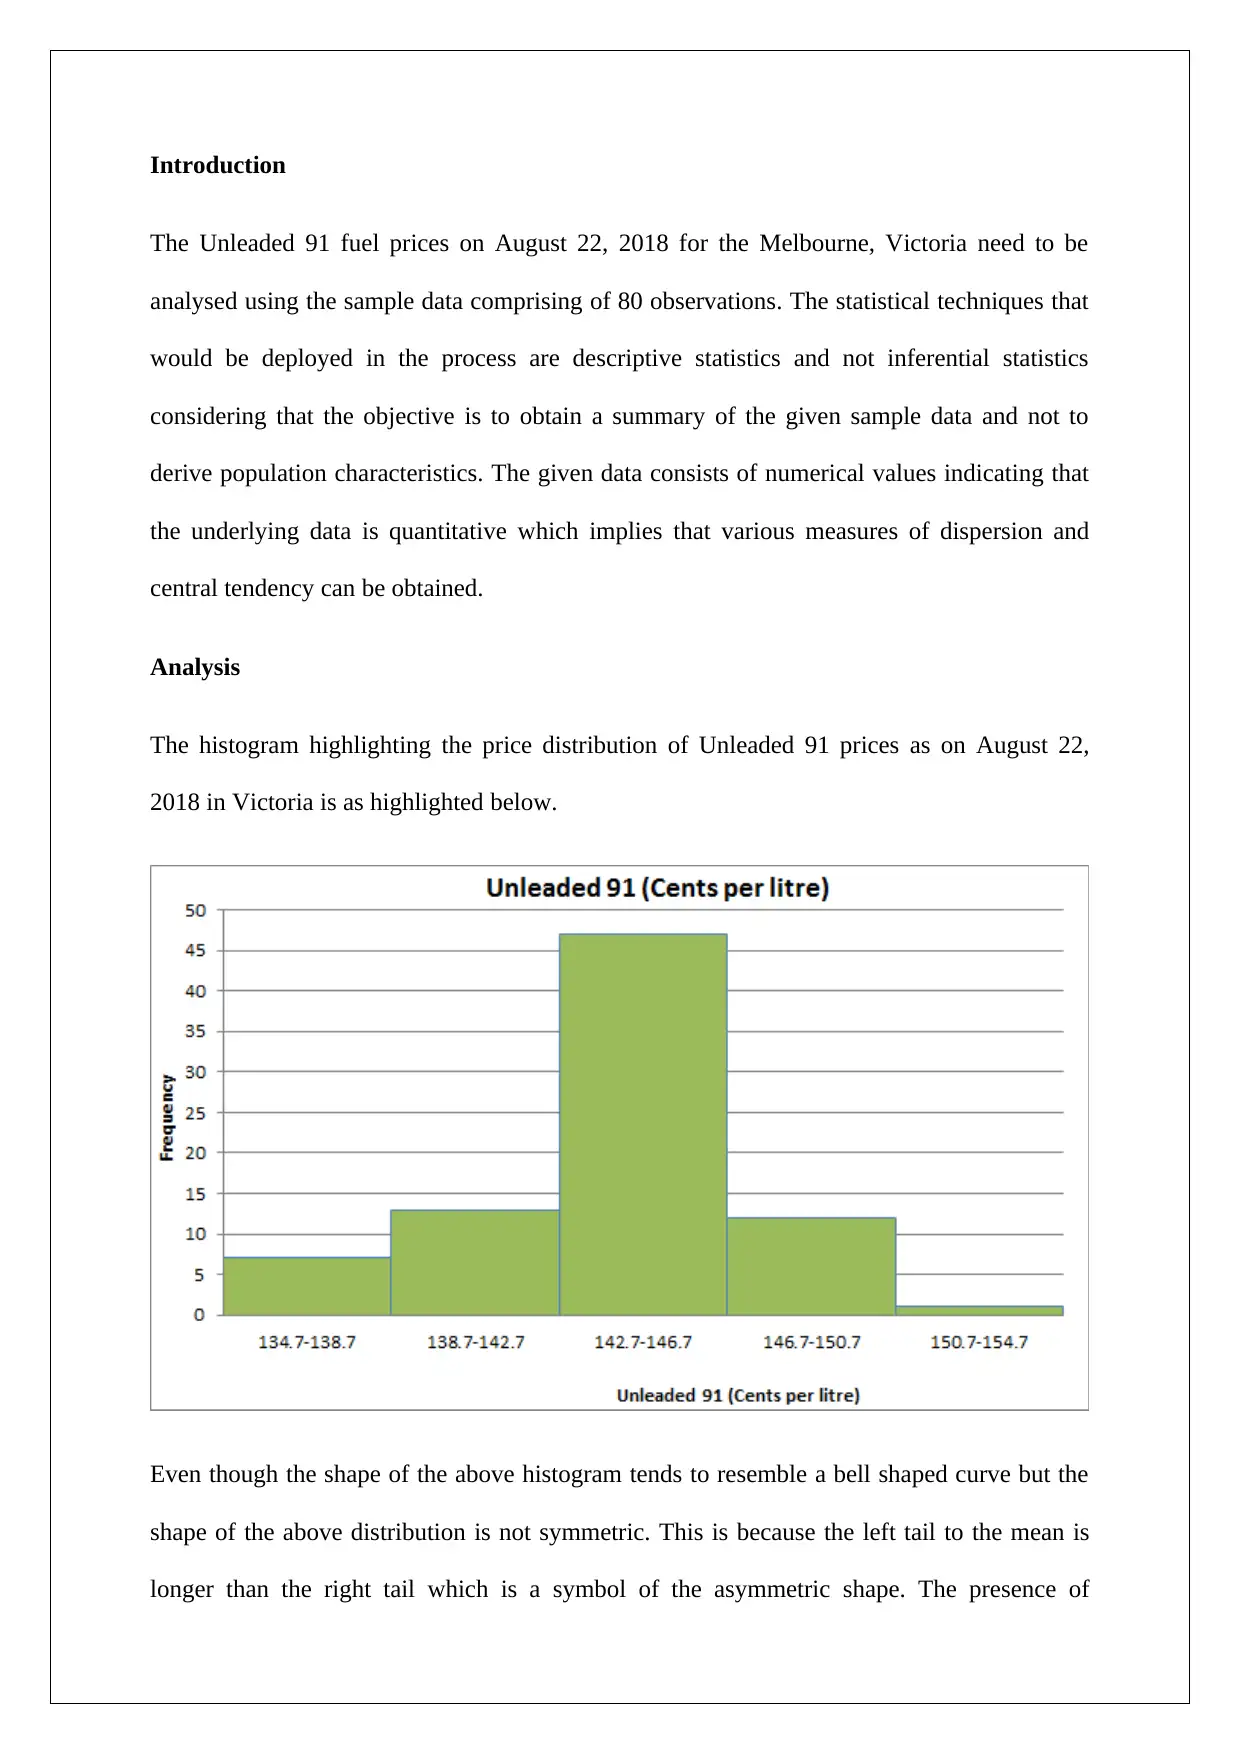
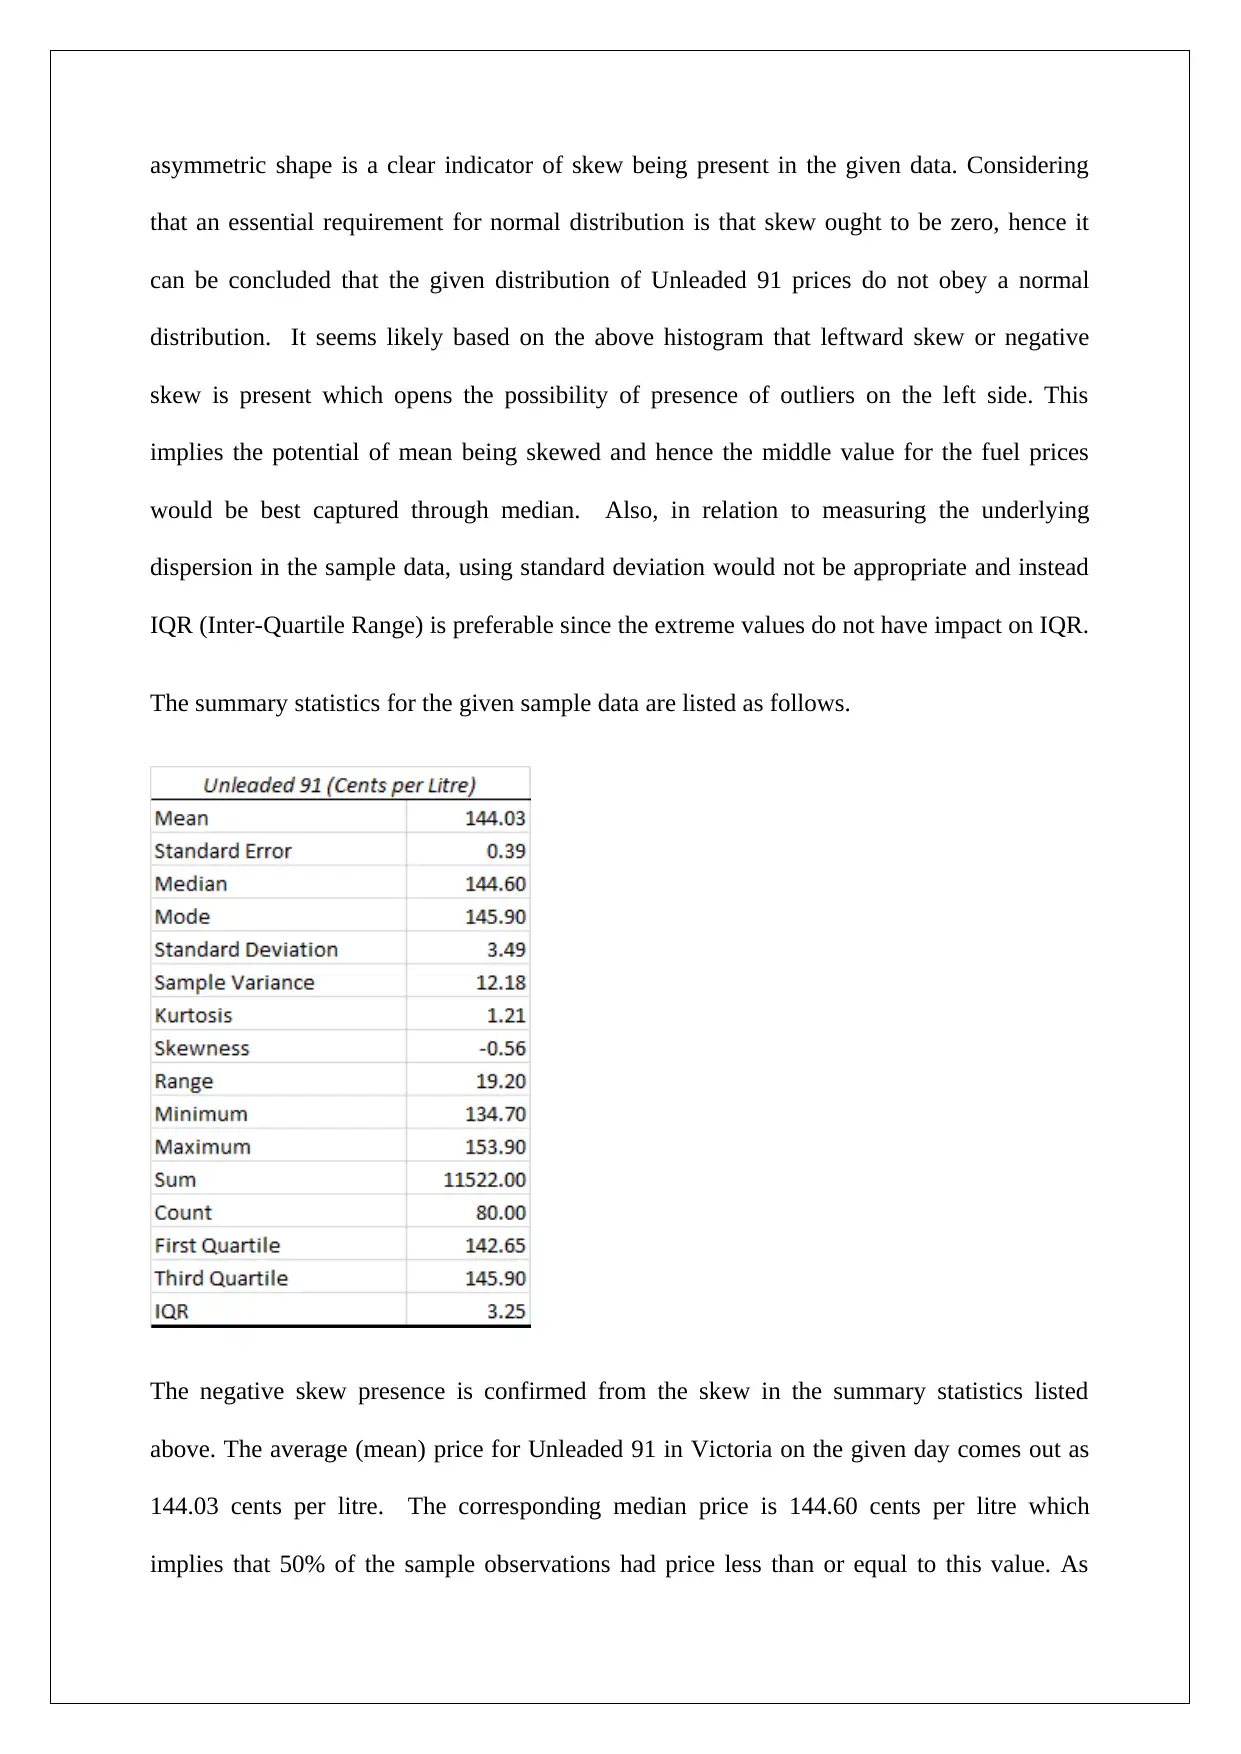
This project provides a statistical analysis of Unleaded 91 fuel prices in Melbourne, Victoria, as of August 22, 2018, using a sample of 80 observations. The analysis employs descriptive statistics to summarize the sample data, focusing on price distribution, central tendency, and dispersion. The histogram reveals a non-normal distribution with a negative skew, indicating that the median is a more representative measure of central tendency than the mean. The average price is found to be 144.03 cents per litre, while the median price is 144.60 cents per litre. The Inter-Quartile Range (IQR) is used to measure dispersion, revealing a low variation in prices, with the middle 50% varying within a 3.25 cent range. The project concludes that the Unleaded 91 prices do not follow a normal distribution due to the presence of negative skew, and the median provides a better representation of the typical fuel price on the specified date.
Document Page
Introduction
The Unleaded 91 fuel prices on August 22, 2018 for the Melbourne, Victoria need to be
analysed using the sample data comprising of 80 observations. The statistical techniques that
would be deployed in the process are descriptive statistics and not inferential statistics
considering that the objective is to obtain a summary of the given sample data and not to
derive population characteristics. The given data consists of numerical values indicating that
the underlying data is quantitative which implies that various measures of dispersion and
central tendency can be obtained.
Analysis
The histogram highlighting the price distribution of Unleaded 91 prices as on August 22,
2018 in Victoria is as highlighted below.
Even though the shape of the above histogram tends to resemble a bell shaped curve but the
shape of the above distribution is not symmetric. This is because the left tail to the mean is
longer than the right tail which is a symbol of the asymmetric shape. The presence of
tabler-icon-diamond-filled.svg

Paraphrase This Document

Need a fresh take? Get an instant paraphrase of this document with our AI Paraphraser
Document Page
asymmetric shape is a clear indicator of skew being present in the given data. Considering
that an essential requirement for normal distribution is that skew ought to be zero, hence it
can be concluded that the given distribution of Unleaded 91 prices do not obey a normal
distribution. It seems likely based on the above histogram that leftward skew or negative
skew is present which opens the possibility of presence of outliers on the left side. This
implies the potential of mean being skewed and hence the middle value for the fuel prices
would be best captured through median. Also, in relation to measuring the underlying
dispersion in the sample data, using standard deviation would not be appropriate and instead
IQR (Inter-Quartile Range) is preferable since the extreme values do not have impact on IQR.
The summary statistics for the given sample data are listed as follows.
The negative skew presence is confirmed from the skew in the summary statistics listed
above. The average (mean) price for Unleaded 91 in Victoria on the given day comes out as
144.03 cents per litre. The corresponding median price is 144.60 cents per litre which
implies that 50% of the sample observations had price less than or equal to this value. As
Document Page
stated above, owing to negative skew, median would be more representative of the central
tendency in comparison to mean of the sample data. Various indicators of dispersion reflect
that data has very small variation. The best measure is IQR which is only 3.25 cents and
implies that the middle 50% of the Unleaded 51 prices tend to vary within 3.25 cent range
only.
Conclusion
The analysis above indicates the non-normal distribution of Unleaded 91 prices in Victoria on
August 22, 2018 with the presence of negative skew. The suitable measure therefore for
highlighting the central tendency of the sample data is median (144.6 cents per litre). The
sample data dispersion is quite low and best represented using IQR which has a value of 3.25
cents only.
chevron_up_icon
1 out of 3
circle_padding
hide_on_mobile
zoom_out_icon
[object Object]