UOB and OCBC Bank Financial Performance: A Management Services Study
VerifiedAdded on 2023/06/11
|11
|2584
|75
Report
AI Summary
This report offers a comparative analysis of United Overseas Bank (UOB) and Oversea-Chinese Banking Corporation (OCBC), evaluating their market performance based on profitability, credit position, liquidity, efficiency, and leverage. It examines ownership governance, net interest income, and non-interest income to assess overall performance. Key metrics like return on equity, return on assets, net interest margin, non-performing loan rates, and loan-to-deposit ratios are analyzed. The report finds that OCBC generally outperforms UOB in profitability and efficiency, while UOB demonstrates better liquidity management. Credit risk management appears stronger at UOB, though OCBC shows higher specific allowances. Ultimately, the report concludes that both banks exhibit strong financial policies, with OCBC showing superior profitability and UOB demonstrating better risk and liquidity management. Desklib provides access to this and other solved assignments for students.
Running Head: Bank management and financial services
1
UOB and OCBC
18
Bank management and
financial services
Comparative study
Student’s Name
1
UOB and OCBC
18
Bank management and
financial services
Comparative study
Student’s Name
Paraphrase This Document
Need a fresh take? Get an instant paraphrase of this document with our AI Paraphraser

Bank management and financial services 2
Executive summary
In the report, UNITED OVERSEAS BANK LTD and OVERSEA-CHINESE
BANKING CORP LTD has been evaluated to identify the performance of both the banks in
the market on the basis of their profitability, credit position, liquidity level and efficiency and
leverage level of the company. The ownership governance structure and net revenue of both
the banks have also been evaluated to measure the entire performance of banks. The report
explains that the performance of OCBC bank is better than UOB bank.
Bank management and financial services 3
Contents
Background:......................................................................................................................4
Major shareholders:..........................................................................................................4
Bank’s net interest income and non-interest income:.......................................................6
Profitability ratio:..............................................................................................................6
Return on equity:..........................................................................................................6
Return on assets:...........................................................................................................7
Net interest margin:......................................................................................................7
Credit risk ratio:................................................................................................................7
Nonperforming loan rate:.............................................................................................8
Specific allowance / average loans:..............................................................................8
Liquidity risk ratio:...........................................................................................................8
Loan to deposit ratio:....................................................................................................8
Total customer’s deposit to total liabilities:..................................................................9
Other ratio:........................................................................................................................9
Efficiency ratio:............................................................................................................9
Leverage ratio:............................................................................................................10
Comparing UOB and OCBC:.........................................................................................10
References:.....................................................................................................................11
⊘ This is a preview!⊘
Do you want full access?
Subscribe today to unlock all pages.
Trusted by 1+ million students worldwide
Bank management and financial services 4
Background:
Managing the financial performance of an organization is quote crucial as it helped the
stakeholders and the other parties of the company to make better decision about the
performance of the company and compare among 2 or more companies to identify the
performance of the company. Financial performance of an organization could be evaluated on
the basis of the various financial items and the annual report of the company (Weston and
Brigham, 2015).
United overseas bank limited is a Singapore bank which is listed in SGX. The
company offers the financial services and investment banking services. The bank has been
founded as United Chinese bank is 1935. The bank is among the third largest bank in the area
of the south east (Home, 2018). The main services of the bank include corporate banking
services, private banking services, personal financial services, management services,
corporate finance etc.
Further, OCBC bank is also a public listen bank in Singapore stock exchange. The main
products of the company includes corporate banking services, private banking services,
personal financial services, management services, corporate finance etc. the main area of
business of the bank is East Asia and south east Asia (Home, 2018). The main mission of the
company is to grab more market to enhance the market base and revenues of the bank.
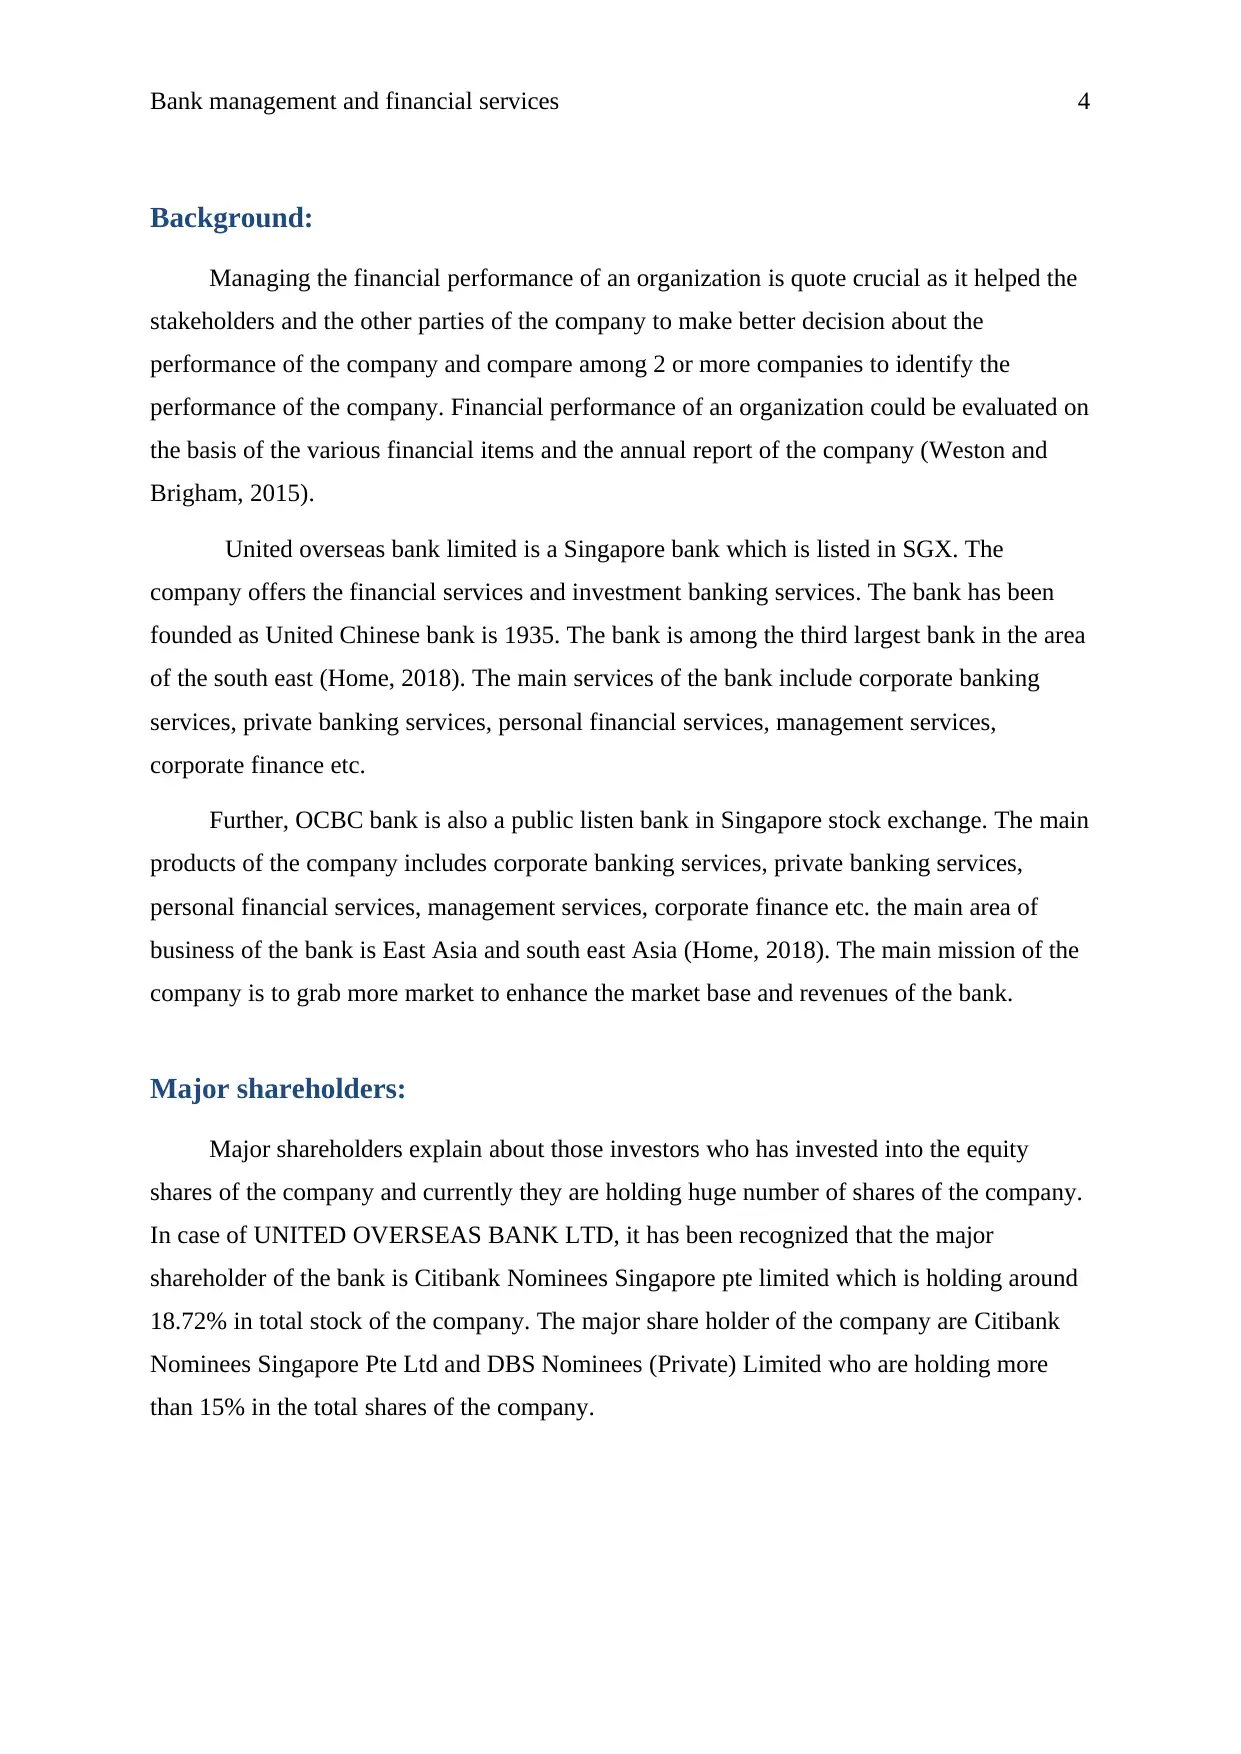
Major shareholders:
Major shareholders explain about those investors who has invested into the equity
shares of the company and currently they are holding huge number of shares of the company.
In case of UNITED OVERSEAS BANK LTD, it has been recognized that the major
shareholder of the bank is Citibank Nominees Singapore pte limited which is holding around
18.72% in total stock of the company. The major share holder of the company are Citibank
Nominees Singapore Pte Ltd and DBS Nominees (Private) Limited who are holding more
than 15% in the total shares of the company.
Background:
Managing the financial performance of an organization is quote crucial as it helped the
stakeholders and the other parties of the company to make better decision about the
performance of the company and compare among 2 or more companies to identify the
performance of the company. Financial performance of an organization could be evaluated on
the basis of the various financial items and the annual report of the company (Weston and
Brigham, 2015).
United overseas bank limited is a Singapore bank which is listed in SGX. The
company offers the financial services and investment banking services. The bank has been
founded as United Chinese bank is 1935. The bank is among the third largest bank in the area
of the south east (Home, 2018). The main services of the bank include corporate banking
services, private banking services, personal financial services, management services,
corporate finance etc.
Further, OCBC bank is also a public listen bank in Singapore stock exchange. The main
products of the company includes corporate banking services, private banking services,
personal financial services, management services, corporate finance etc. the main area of
business of the bank is East Asia and south east Asia (Home, 2018). The main mission of the
company is to grab more market to enhance the market base and revenues of the bank.
Major shareholders:
Major shareholders explain about those investors who has invested into the equity
shares of the company and currently they are holding huge number of shares of the company.
In case of UNITED OVERSEAS BANK LTD, it has been recognized that the major
shareholder of the bank is Citibank Nominees Singapore pte limited which is holding around
18.72% in total stock of the company. The major share holder of the company are Citibank
Nominees Singapore Pte Ltd and DBS Nominees (Private) Limited who are holding more
than 15% in the total shares of the company.
Paraphrase This Document
Need a fresh take? Get an instant paraphrase of this document with our AI Paraphraser
Bank management and financial services 5
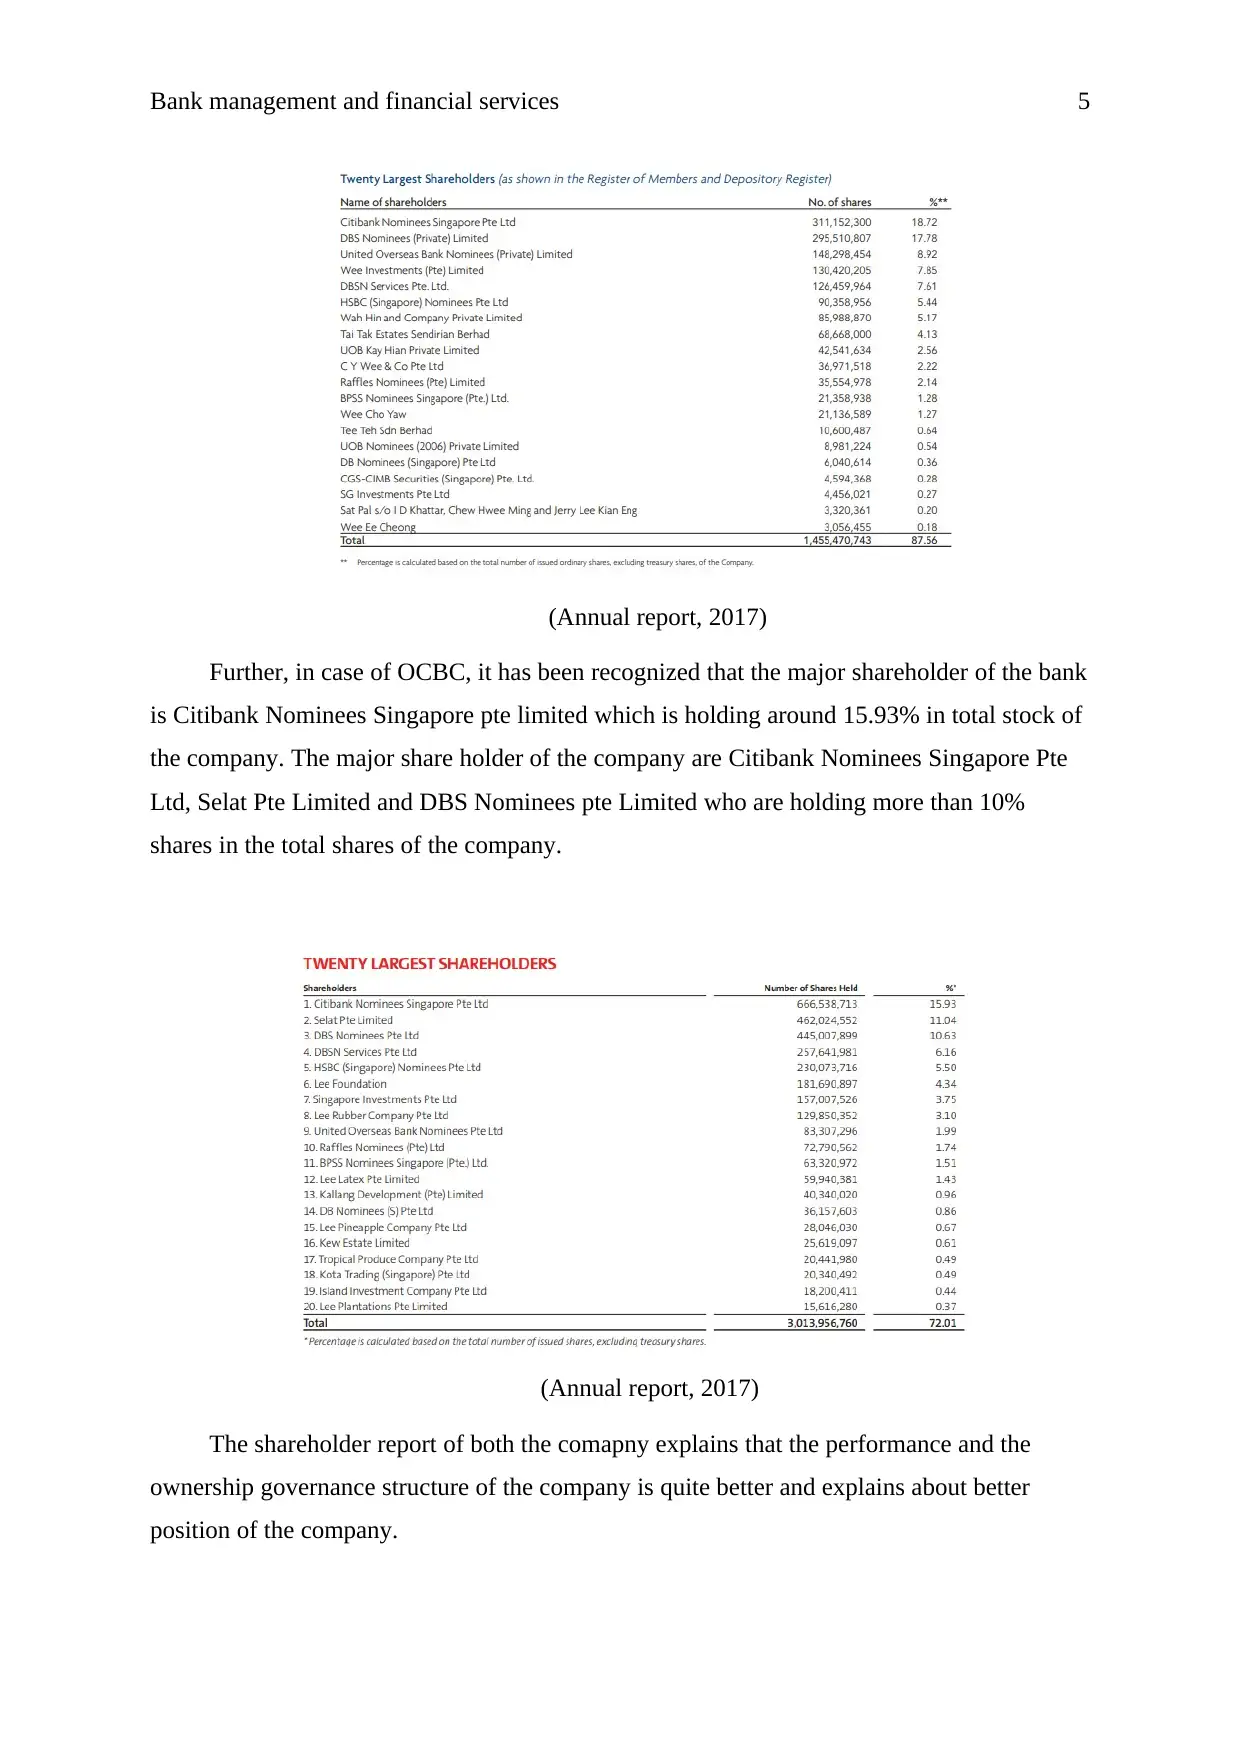
(Annual report, 2017)
Further, in case of OCBC, it has been recognized that the major shareholder of the bank
is Citibank Nominees Singapore pte limited which is holding around 15.93% in total stock of
the company. The major share holder of the company are Citibank Nominees Singapore Pte
Ltd, Selat Pte Limited and DBS Nominees pte Limited who are holding more than 10%
shares in the total shares of the company.
(Annual report, 2017)
The shareholder report of both the comapny explains that the performance and the
ownership governance structure of the company is quite better and explains about better
position of the company.
(Annual report, 2017)
Further, in case of OCBC, it has been recognized that the major shareholder of the bank
is Citibank Nominees Singapore pte limited which is holding around 15.93% in total stock of
the company. The major share holder of the company are Citibank Nominees Singapore Pte
Ltd, Selat Pte Limited and DBS Nominees pte Limited who are holding more than 10%
shares in the total shares of the company.
(Annual report, 2017)
The shareholder report of both the comapny explains that the performance and the
ownership governance structure of the company is quite better and explains about better
position of the company.
Bank management and financial services 6
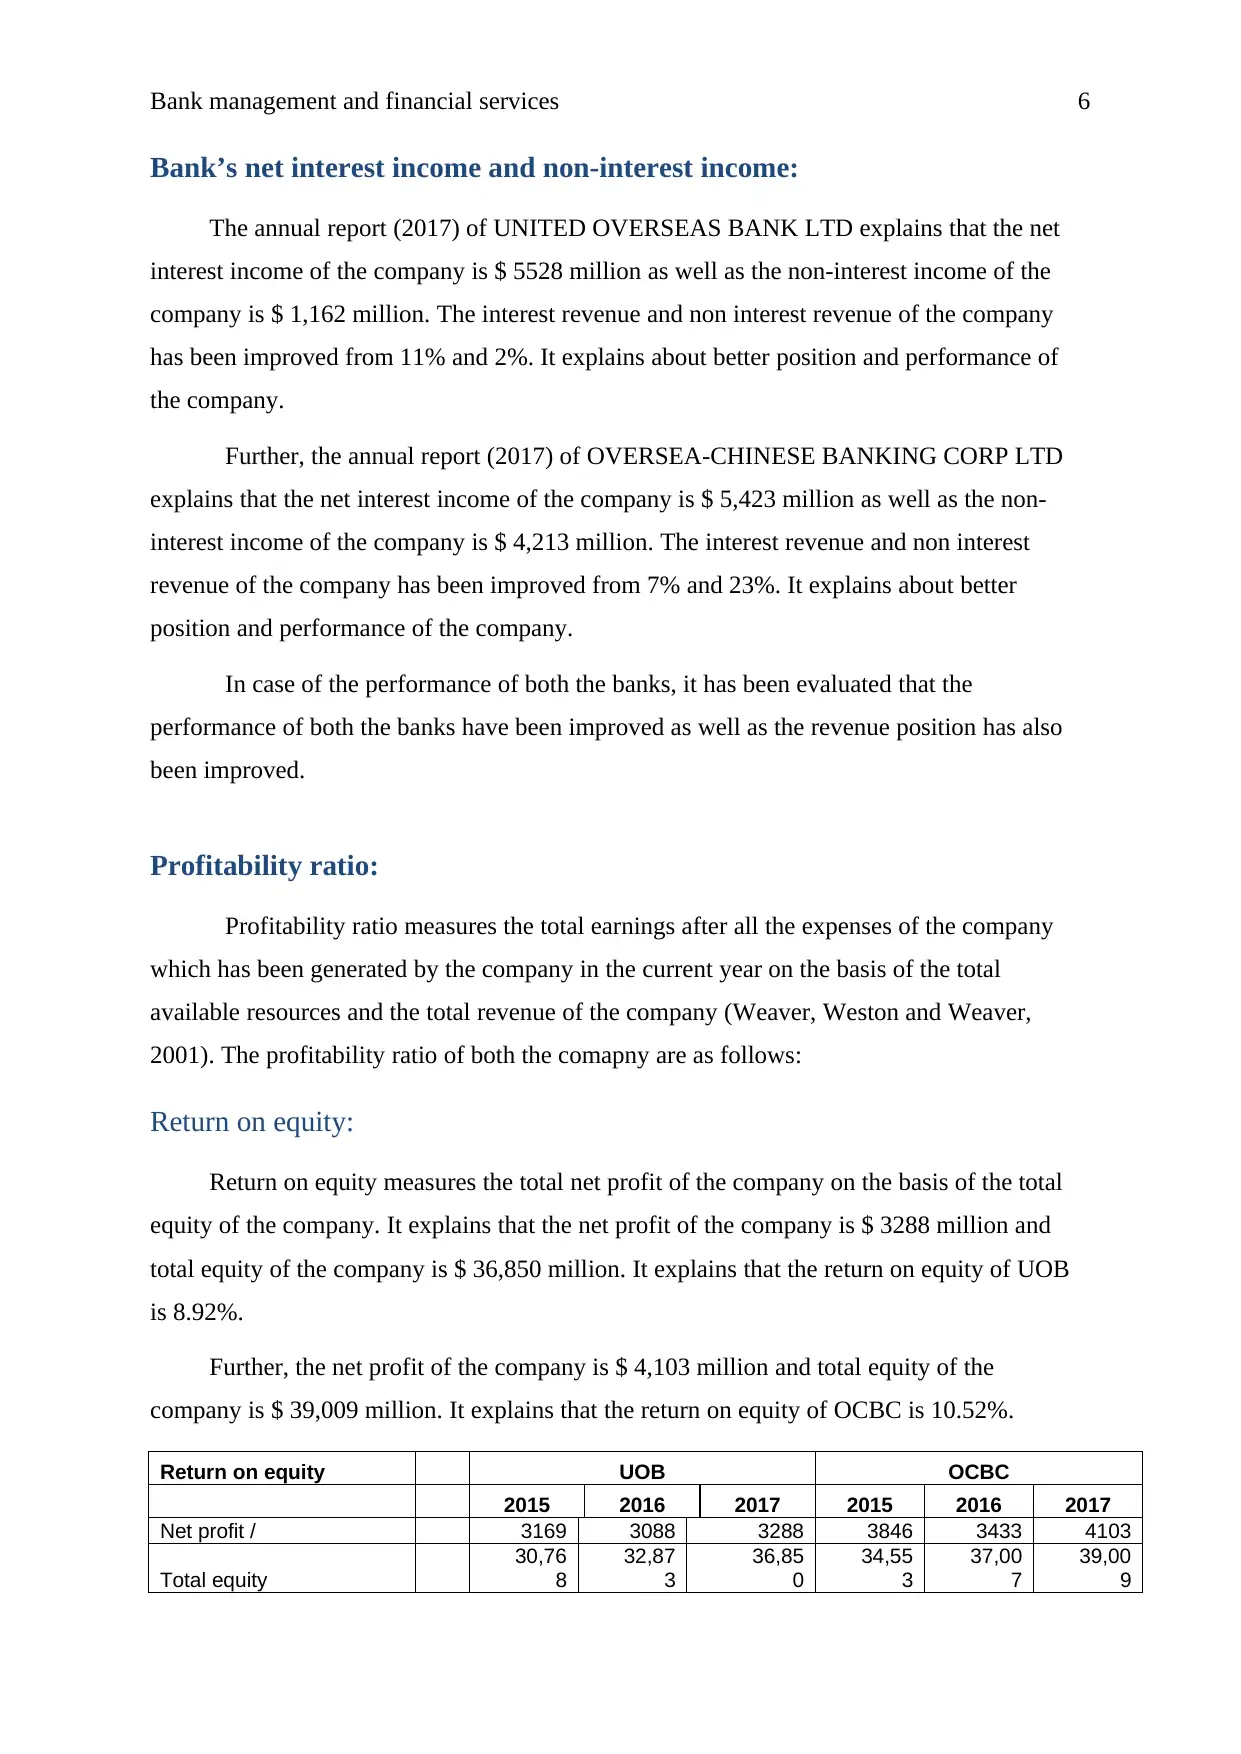
Bank’s net interest income and non-interest income:
The annual report (2017) of UNITED OVERSEAS BANK LTD explains that the net
interest income of the company is $ 5528 million as well as the non-interest income of the
company is $ 1,162 million. The interest revenue and non interest revenue of the company
has been improved from 11% and 2%. It explains about better position and performance of
the company.
Further, the annual report (2017) of OVERSEA-CHINESE BANKING CORP LTD
explains that the net interest income of the company is $ 5,423 million as well as the non-
interest income of the company is $ 4,213 million. The interest revenue and non interest
revenue of the company has been improved from 7% and 23%. It explains about better
position and performance of the company.
In case of the performance of both the banks, it has been evaluated that the
performance of both the banks have been improved as well as the revenue position has also
been improved.
Profitability ratio:
Profitability ratio measures the total earnings after all the expenses of the company
which has been generated by the company in the current year on the basis of the total
available resources and the total revenue of the company (Weaver, Weston and Weaver,
2001). The profitability ratio of both the comapny are as follows:
Return on equity:
Return on equity measures the total net profit of the company on the basis of the total
equity of the company. It explains that the net profit of the company is $ 3288 million and
total equity of the company is $ 36,850 million. It explains that the return on equity of UOB
is 8.92%.
Further, the net profit of the company is $ 4,103 million and total equity of the
company is $ 39,009 million. It explains that the return on equity of OCBC is 10.52%.
Return on equity UOB OCBC
2015 2016 2017 2015 2016 2017
Net profit / 3169 3088 3288 3846 3433 4103
Total equity
30,76
8
32,87
3
36,85
0
34,55
3
37,00
7
39,00
9
⊘ This is a preview!⊘
Do you want full access?
Subscribe today to unlock all pages.
Trusted by 1+ million students worldwide
Bank management and financial services 7
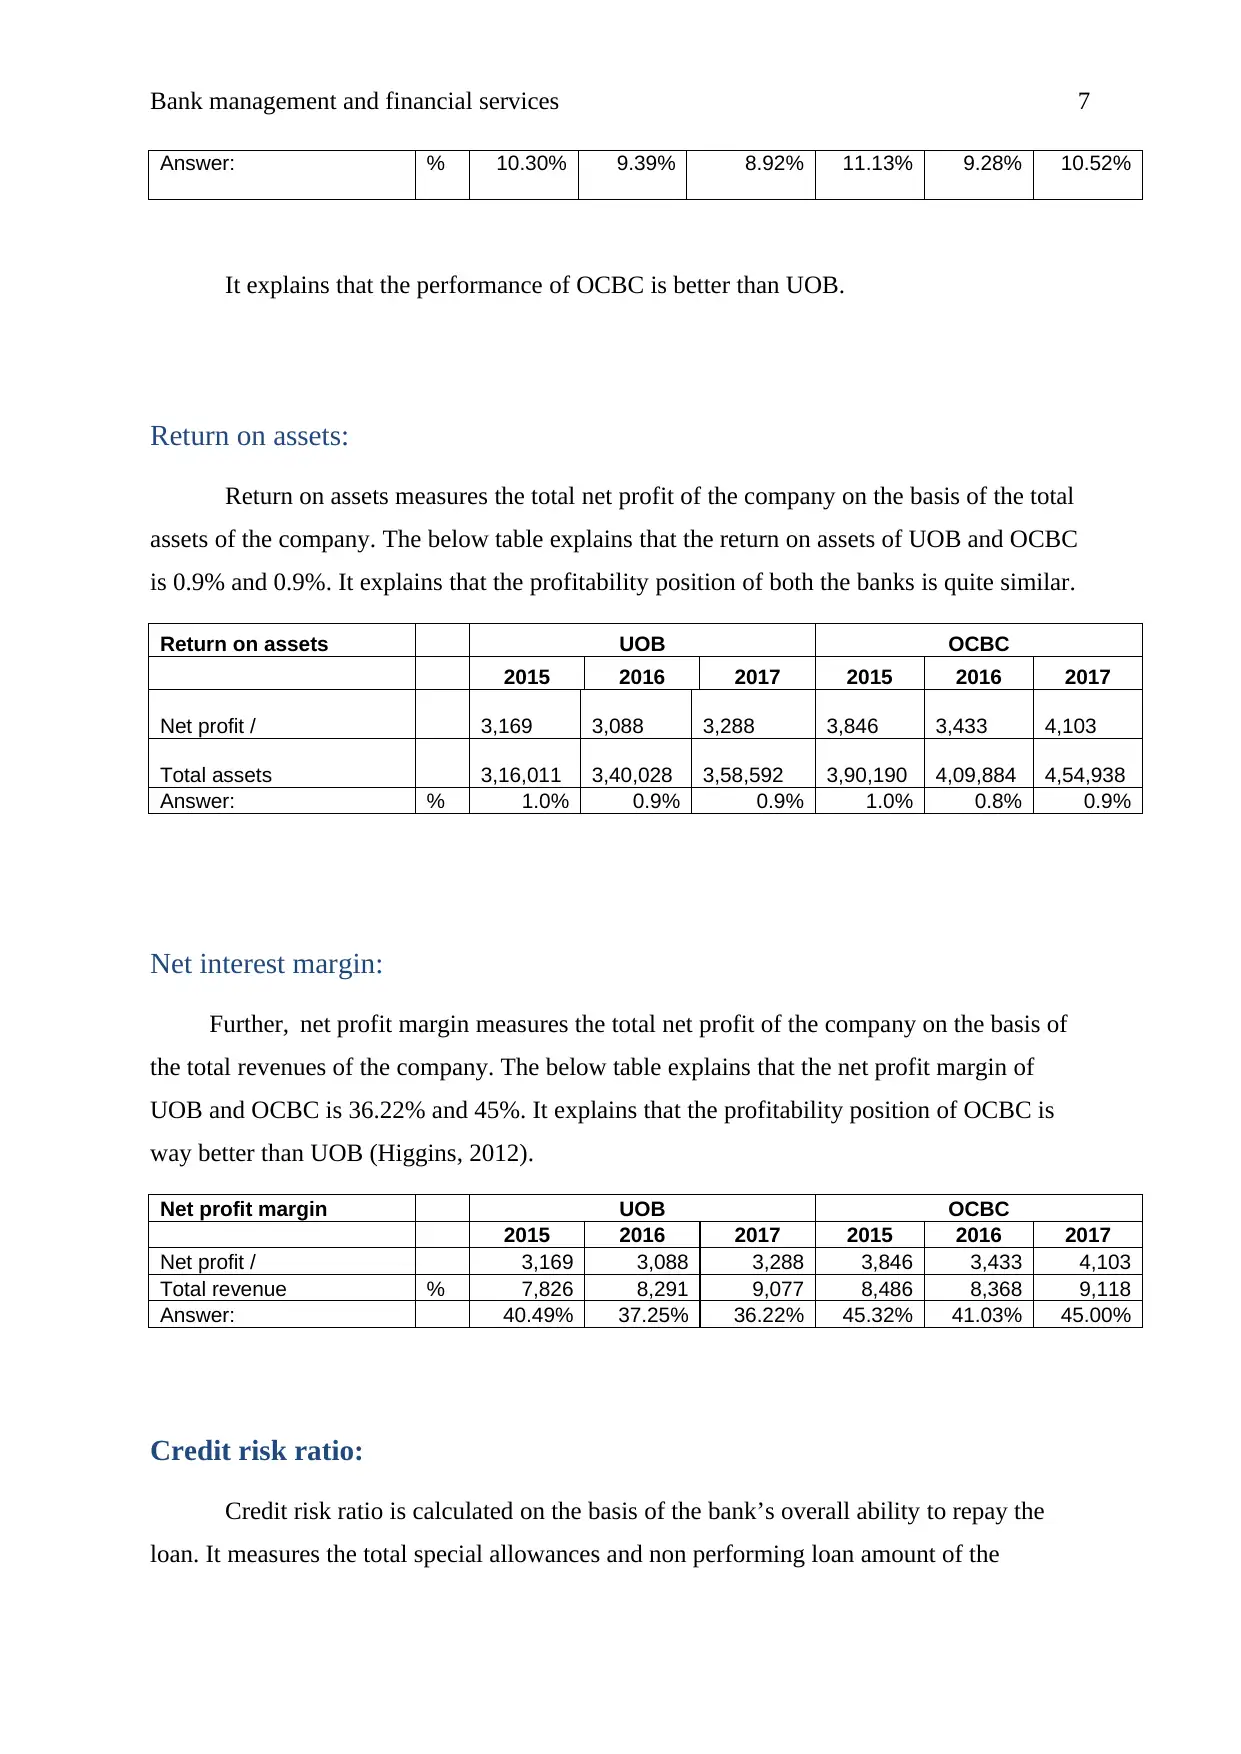
Answer: % 10.30% 9.39% 8.92% 11.13% 9.28% 10.52%
It explains that the performance of OCBC is better than UOB.
Return on assets:
Return on assets measures the total net profit of the company on the basis of the total
assets of the company. The below table explains that the return on assets of UOB and OCBC
is 0.9% and 0.9%. It explains that the profitability position of both the banks is quite similar.
Return on assets UOB OCBC
2015 2016 2017 2015 2016 2017
Net profit / 3,169 3,088 3,288 3,846 3,433 4,103
Total assets 3,16,011 3,40,028 3,58,592 3,90,190 4,09,884 4,54,938
Answer: % 1.0% 0.9% 0.9% 1.0% 0.8% 0.9%
Net interest margin:
Further, net profit margin measures the total net profit of the company on the basis of
the total revenues of the company. The below table explains that the net profit margin of
UOB and OCBC is 36.22% and 45%. It explains that the profitability position of OCBC is
way better than UOB (Higgins, 2012).
Net profit margin UOB OCBC
2015 2016 2017 2015 2016 2017
Net profit / 3,169 3,088 3,288 3,846 3,433 4,103
Total revenue % 7,826 8,291 9,077 8,486 8,368 9,118
Answer: 40.49% 37.25% 36.22% 45.32% 41.03% 45.00%
Credit risk ratio:
Credit risk ratio is calculated on the basis of the bank’s overall ability to repay the
loan. It measures the total special allowances and non performing loan amount of the
Paraphrase This Document
Need a fresh take? Get an instant paraphrase of this document with our AI Paraphraser
Bank management and financial services 8
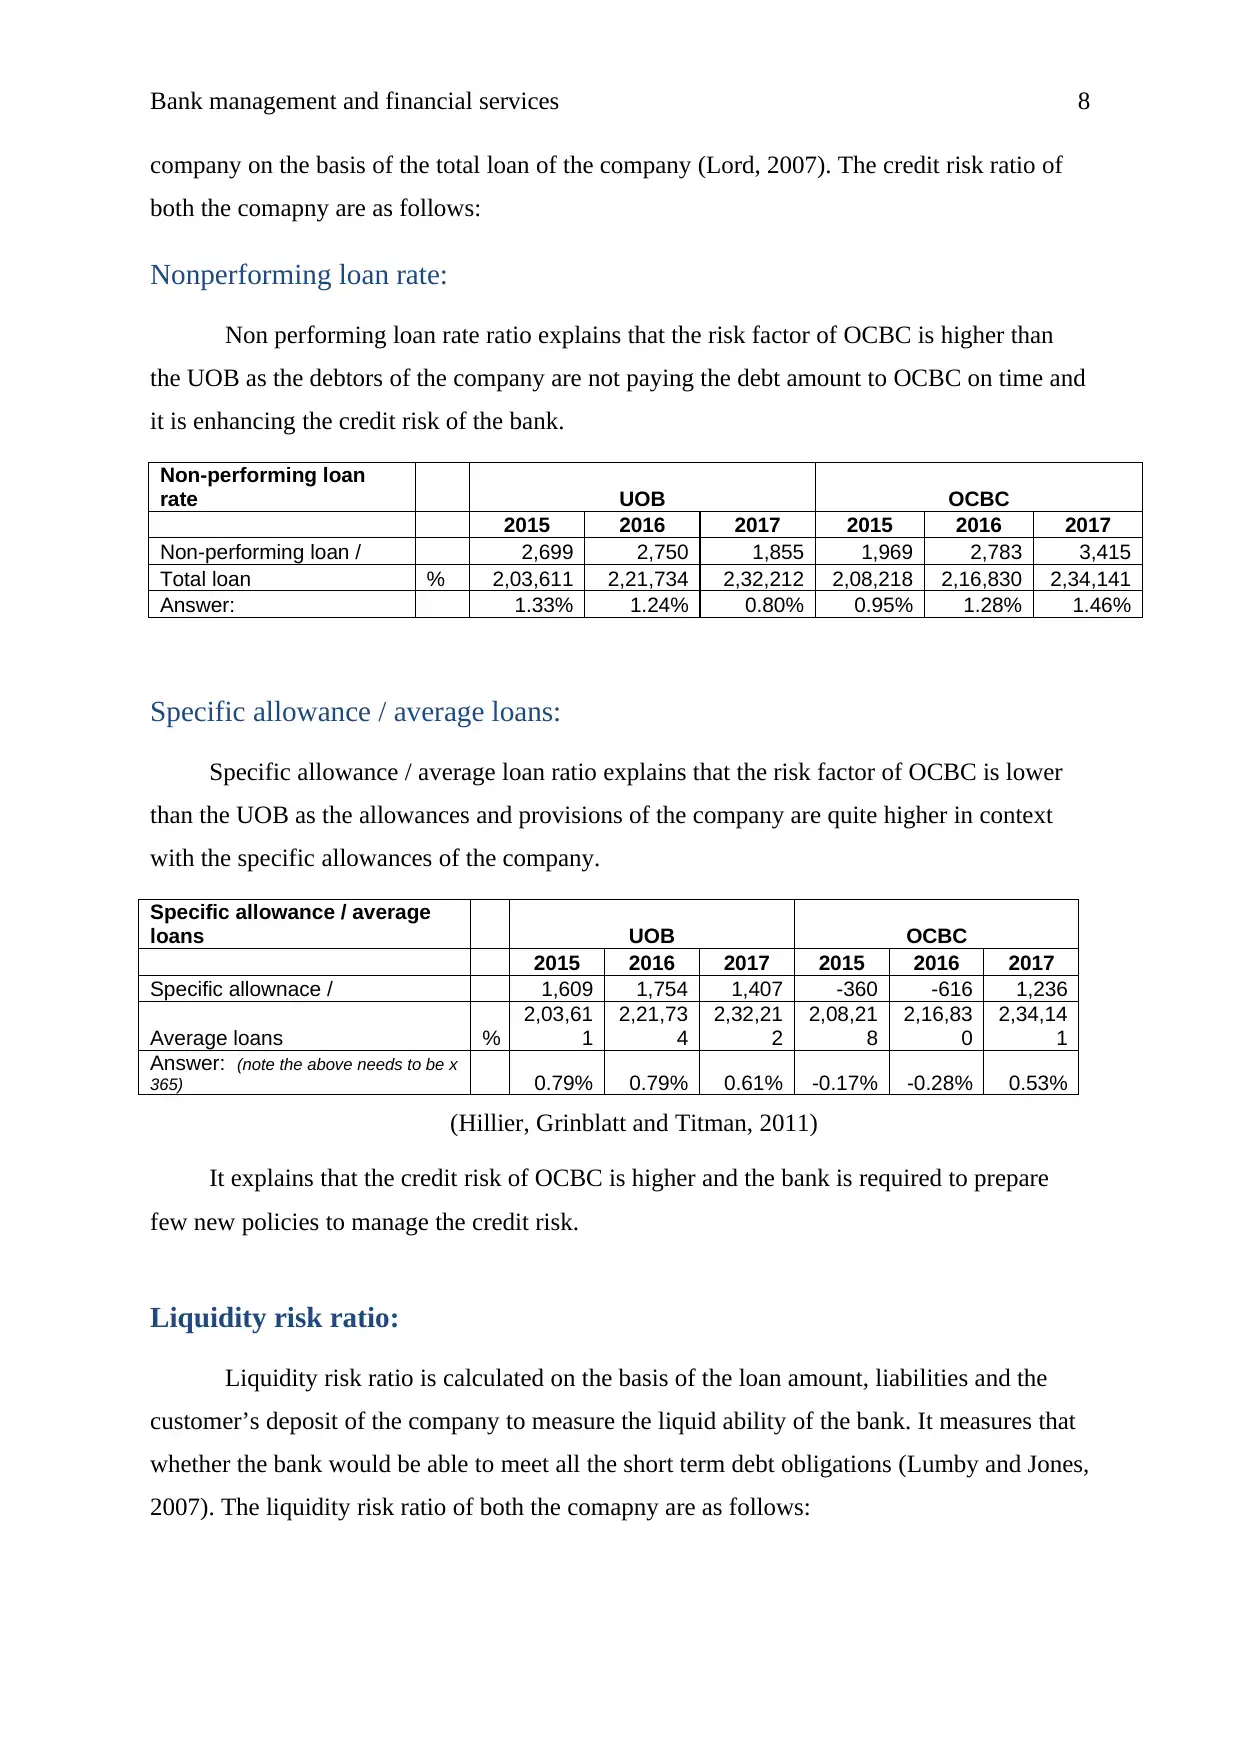
company on the basis of the total loan of the company (Lord, 2007). The credit risk ratio of
both the comapny are as follows:
Nonperforming loan rate:
Non performing loan rate ratio explains that the risk factor of OCBC is higher than
the UOB as the debtors of the company are not paying the debt amount to OCBC on time and
it is enhancing the credit risk of the bank.
Non-performing loan
rate UOB OCBC
2015 2016 2017 2015 2016 2017
Non-performing loan / 2,699 2,750 1,855 1,969 2,783 3,415
Total loan % 2,03,611 2,21,734 2,32,212 2,08,218 2,16,830 2,34,141
Answer: 1.33% 1.24% 0.80% 0.95% 1.28% 1.46%
Specific allowance / average loans:
Specific allowance / average loan ratio explains that the risk factor of OCBC is lower
than the UOB as the allowances and provisions of the company are quite higher in context
with the specific allowances of the company.
Specific allowance / average
loans UOB OCBC
2015 2016 2017 2015 2016 2017
Specific allownace / 1,609 1,754 1,407 -360 -616 1,236
Average loans %
2,03,61
1
2,21,73
4
2,32,21
2
2,08,21
8
2,16,83
0
2,34,14
1
Answer: (note the above needs to be x
365) 0.79% 0.79% 0.61% -0.17% -0.28% 0.53%
(Hillier, Grinblatt and Titman, 2011)
It explains that the credit risk of OCBC is higher and the bank is required to prepare
few new policies to manage the credit risk.
Liquidity risk ratio:
Liquidity risk ratio is calculated on the basis of the loan amount, liabilities and the
customer’s deposit of the company to measure the liquid ability of the bank. It measures that
whether the bank would be able to meet all the short term debt obligations (Lumby and Jones,
2007). The liquidity risk ratio of both the comapny are as follows:
Bank management and financial services 9
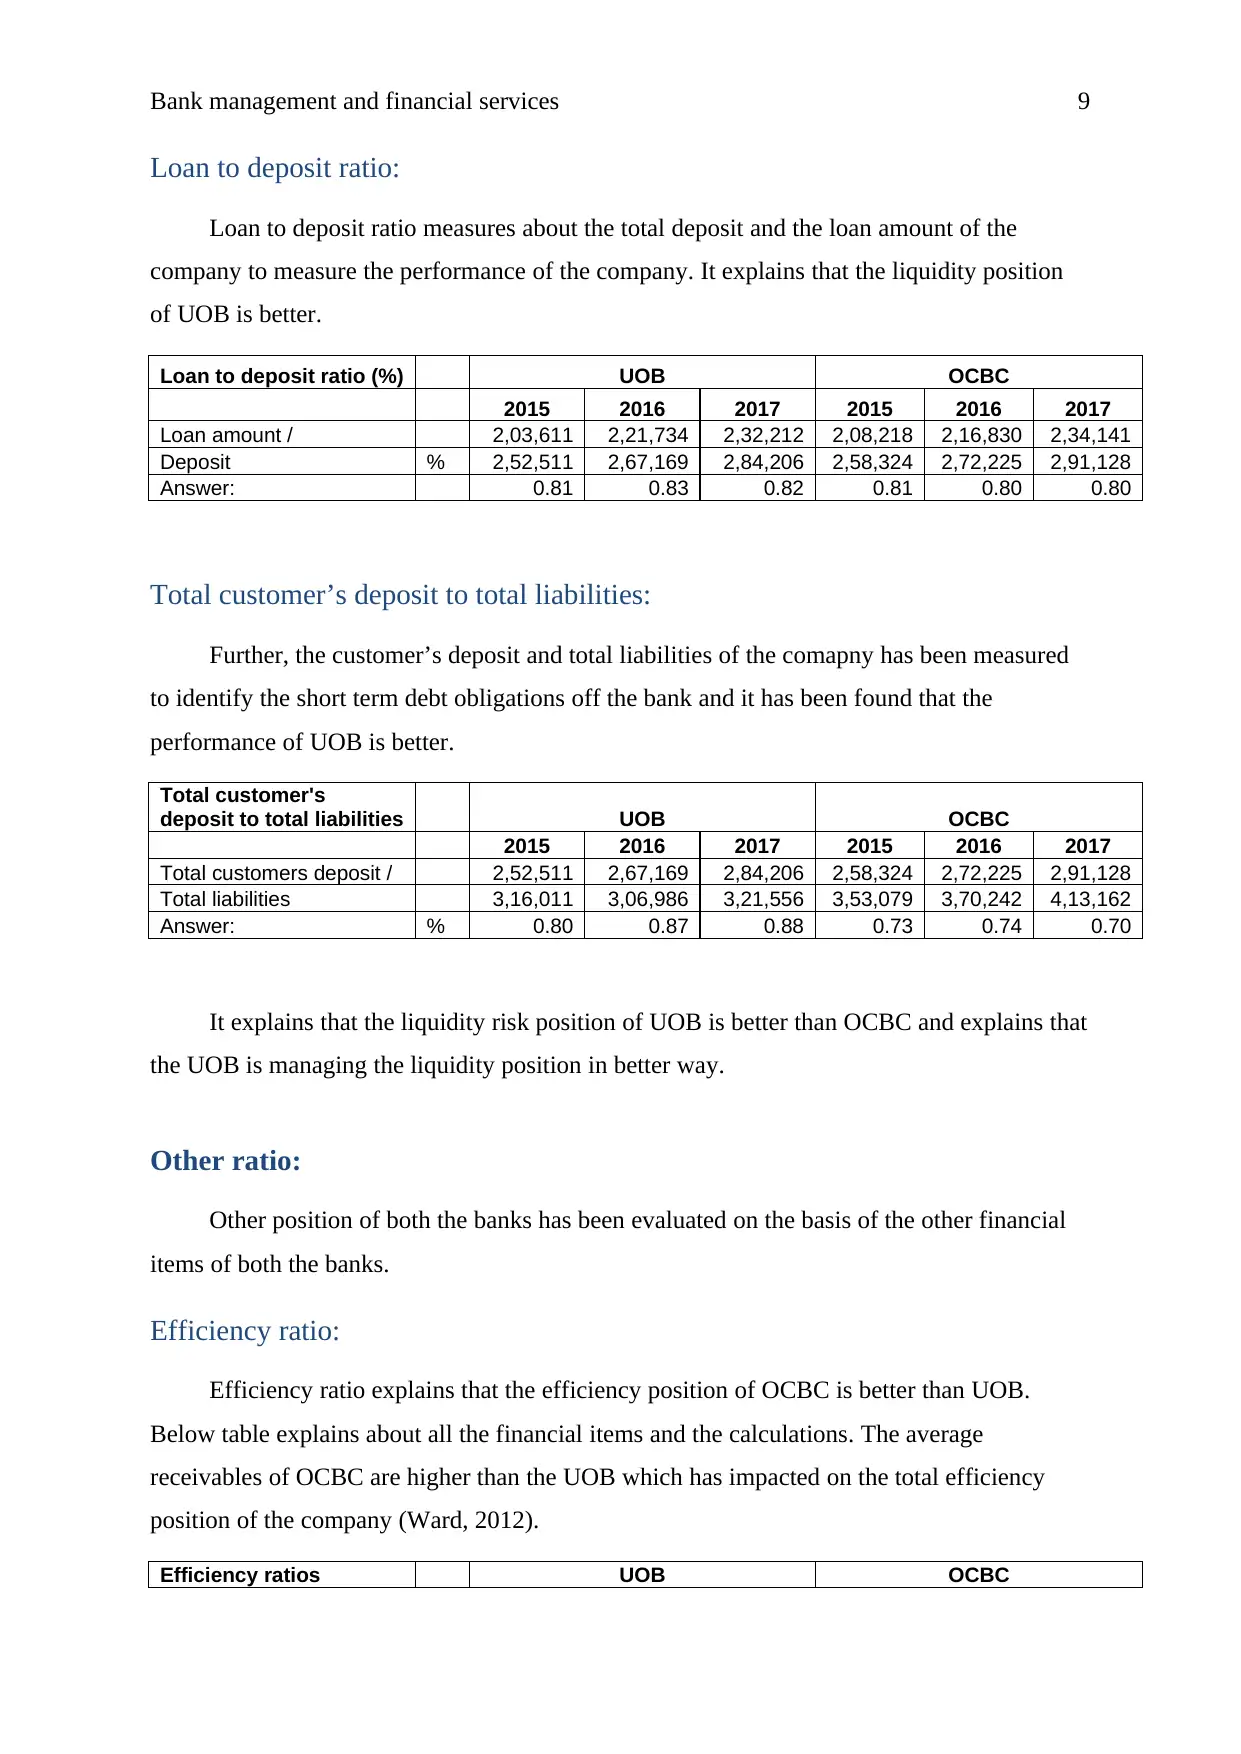
Loan to deposit ratio:
Loan to deposit ratio measures about the total deposit and the loan amount of the
company to measure the performance of the company. It explains that the liquidity position
of UOB is better.
Loan to deposit ratio (%) UOB OCBC
2015 2016 2017 2015 2016 2017
Loan amount / 2,03,611 2,21,734 2,32,212 2,08,218 2,16,830 2,34,141
Deposit % 2,52,511 2,67,169 2,84,206 2,58,324 2,72,225 2,91,128
Answer: 0.81 0.83 0.82 0.81 0.80 0.80
Total customer’s deposit to total liabilities:
Further, the customer’s deposit and total liabilities of the comapny has been measured
to identify the short term debt obligations off the bank and it has been found that the
performance of UOB is better.
Total customer's
deposit to total liabilities UOB OCBC
2015 2016 2017 2015 2016 2017
Total customers deposit / 2,52,511 2,67,169 2,84,206 2,58,324 2,72,225 2,91,128
Total liabilities 3,16,011 3,06,986 3,21,556 3,53,079 3,70,242 4,13,162
Answer: % 0.80 0.87 0.88 0.73 0.74 0.70
It explains that the liquidity risk position of UOB is better than OCBC and explains that
the UOB is managing the liquidity position in better way.
Other ratio:
Other position of both the banks has been evaluated on the basis of the other financial
items of both the banks.
Efficiency ratio:
Efficiency ratio explains that the efficiency position of OCBC is better than UOB.
Below table explains about all the financial items and the calculations. The average
receivables of OCBC are higher than the UOB which has impacted on the total efficiency
position of the company (Ward, 2012).
Efficiency ratios UOB OCBC
⊘ This is a preview!⊘
Do you want full access?
Subscribe today to unlock all pages.
Trusted by 1+ million students worldwide
Bank management and financial services 10
2015 2016 2017 2015 2016 2017
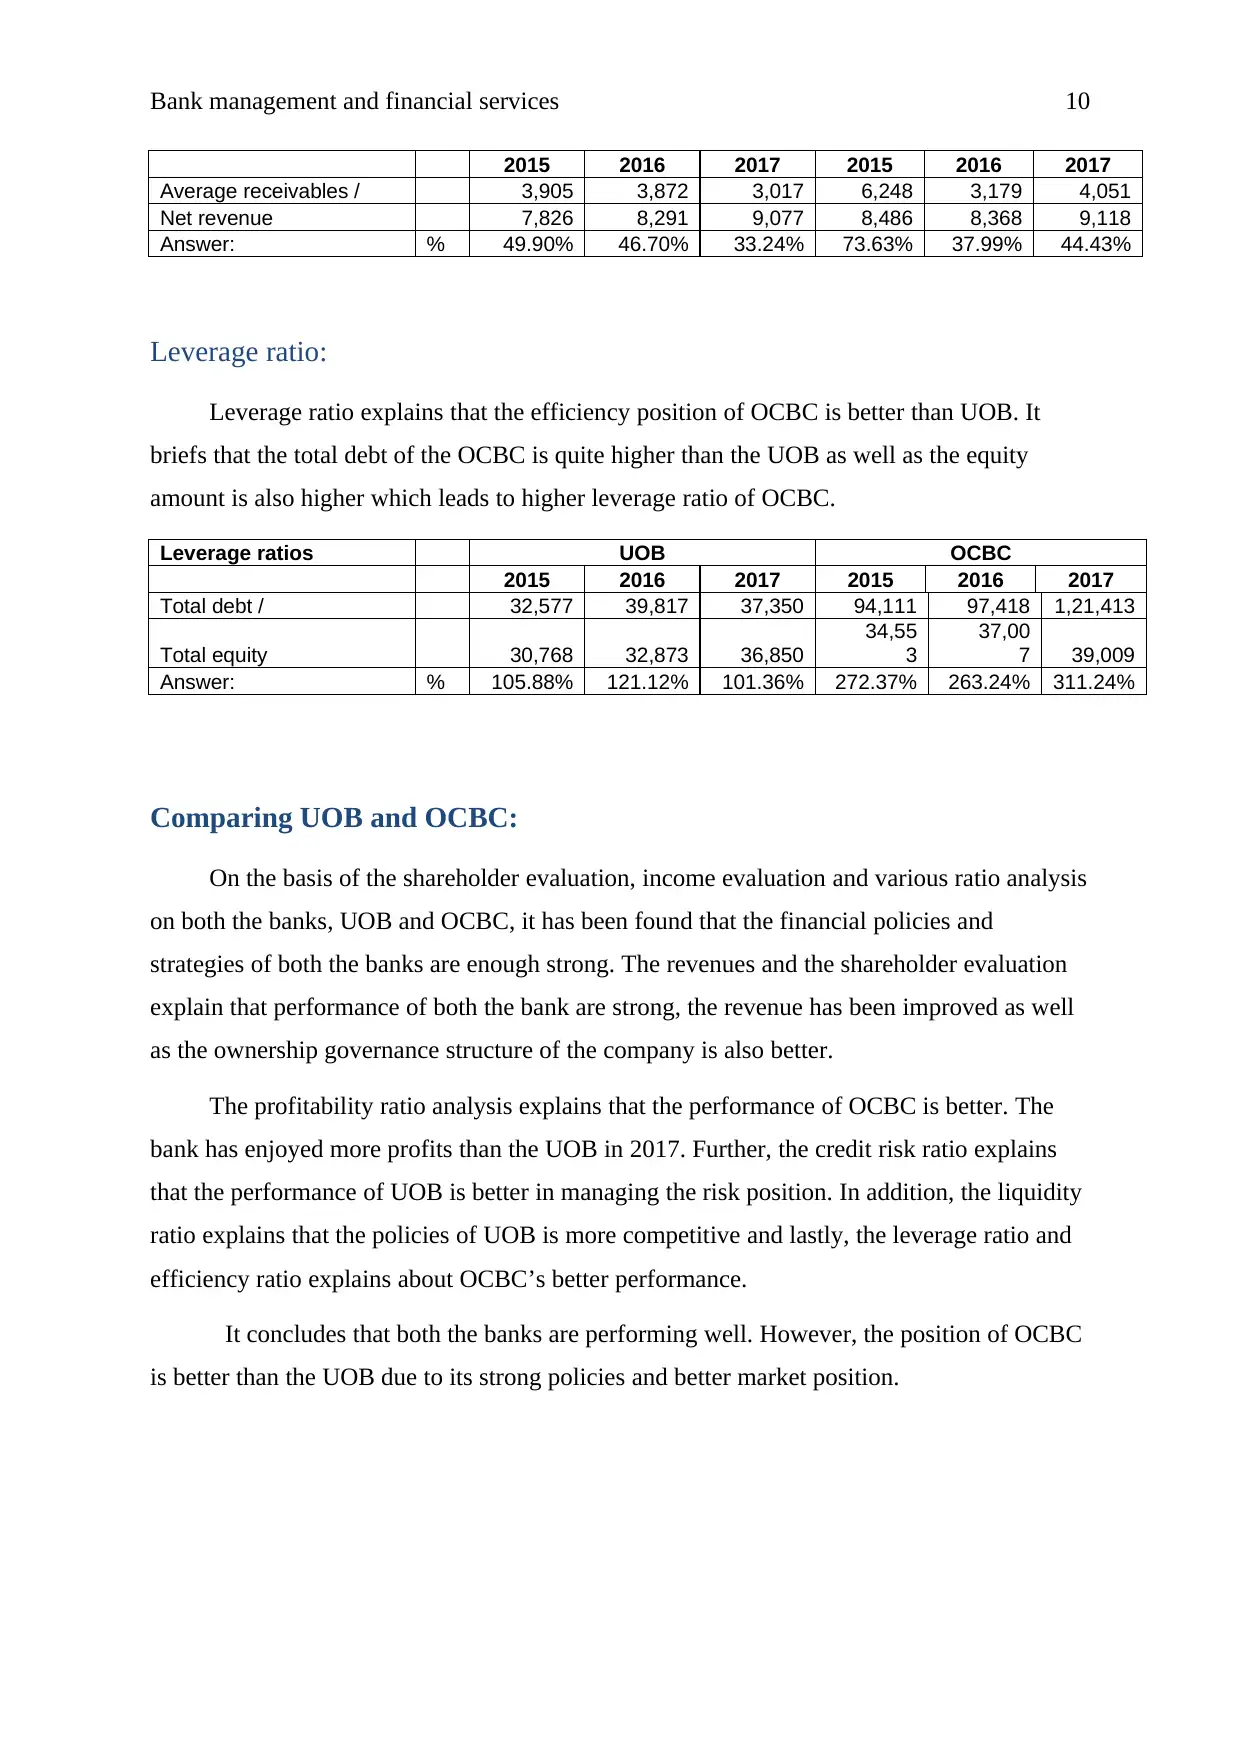
Average receivables / 3,905 3,872 3,017 6,248 3,179 4,051
Net revenue 7,826 8,291 9,077 8,486 8,368 9,118
Answer: % 49.90% 46.70% 33.24% 73.63% 37.99% 44.43%
Leverage ratio:
Leverage ratio explains that the efficiency position of OCBC is better than UOB. It
briefs that the total debt of the OCBC is quite higher than the UOB as well as the equity
amount is also higher which leads to higher leverage ratio of OCBC.
Leverage ratios UOB OCBC
2015 2016 2017 2015 2016 2017
Total debt / 32,577 39,817 37,350 94,111 97,418 1,21,413
Total equity 30,768 32,873 36,850
34,55
3
37,00
7 39,009
Answer: % 105.88% 121.12% 101.36% 272.37% 263.24% 311.24%
Comparing UOB and OCBC:
On the basis of the shareholder evaluation, income evaluation and various ratio analysis
on both the banks, UOB and OCBC, it has been found that the financial policies and
strategies of both the banks are enough strong. The revenues and the shareholder evaluation
explain that performance of both the bank are strong, the revenue has been improved as well
as the ownership governance structure of the company is also better.
The profitability ratio analysis explains that the performance of OCBC is better. The
bank has enjoyed more profits than the UOB in 2017. Further, the credit risk ratio explains
that the performance of UOB is better in managing the risk position. In addition, the liquidity
ratio explains that the policies of UOB is more competitive and lastly, the leverage ratio and
efficiency ratio explains about OCBC’s better performance.
It concludes that both the banks are performing well. However, the position of OCBC
is better than the UOB due to its strong policies and better market position.
2015 2016 2017 2015 2016 2017
Average receivables / 3,905 3,872 3,017 6,248 3,179 4,051
Net revenue 7,826 8,291 9,077 8,486 8,368 9,118
Answer: % 49.90% 46.70% 33.24% 73.63% 37.99% 44.43%
Leverage ratio:
Leverage ratio explains that the efficiency position of OCBC is better than UOB. It
briefs that the total debt of the OCBC is quite higher than the UOB as well as the equity
amount is also higher which leads to higher leverage ratio of OCBC.
Leverage ratios UOB OCBC
2015 2016 2017 2015 2016 2017
Total debt / 32,577 39,817 37,350 94,111 97,418 1,21,413
Total equity 30,768 32,873 36,850
34,55
3
37,00
7 39,009
Answer: % 105.88% 121.12% 101.36% 272.37% 263.24% 311.24%
Comparing UOB and OCBC:
On the basis of the shareholder evaluation, income evaluation and various ratio analysis
on both the banks, UOB and OCBC, it has been found that the financial policies and
strategies of both the banks are enough strong. The revenues and the shareholder evaluation
explain that performance of both the bank are strong, the revenue has been improved as well
as the ownership governance structure of the company is also better.
The profitability ratio analysis explains that the performance of OCBC is better. The
bank has enjoyed more profits than the UOB in 2017. Further, the credit risk ratio explains
that the performance of UOB is better in managing the risk position. In addition, the liquidity
ratio explains that the policies of UOB is more competitive and lastly, the leverage ratio and
efficiency ratio explains about OCBC’s better performance.
It concludes that both the banks are performing well. However, the position of OCBC
is better than the UOB due to its strong policies and better market position.
Paraphrase This Document
Need a fresh take? Get an instant paraphrase of this document with our AI Paraphraser
Bank management and financial services 11
References:
Annual report. 2018. OCBC bank. [online]. Accessed on:
https://www.ocbc.com/assets/pdf/annual%20reports/2017/ocbc_ar17_fullreport_english.pdf
(available 30/5/2018).
Annual report. 2018. UOB group. [online]. Accessed on:
https://www.uob.com.sg/AR2017/documents/Full-Annual-Report-2017.pdf (available
30/5/2018).
Higgins, R. C., 2012. Analysis for financial management. McGraw-Hill/Irwin.
Hillier, D., Grinblatt, M. and Titman, S., 2011. Financial markets and corporate strategy.
McGraw Hill.
Home. 2018. OCBC bank. [online]. Accessed on: https://www.ocbc.com/group/group-
home.html (available 30/5/2018).
Home. 2018. UOB group. [online]. Accessed on: https://www.uobgroup.com/ (available
30/5/2018).
Lord, B.R., 2007. Strategic management accounting. Issues in Management Accounting, 3.
Lumby,S and Jones,C,.2007. Corporate finance theory & practice, 7th edition, Thomson,
London
Ward, K., 2012. Strategic management accounting. Australia: Routledge.
Weaver, S.C., Weston, J.F. and Weaver, S., 2001. Finance and accounting for nonfinancial
managers. New York: McGraw-Hill.
Weston, J.F. and Brigham, E.F., 2015. Managerial finance. Hinsdale, IL: Dryden Press.
1 out of 11
Related Documents


Your All-in-One AI-Powered Toolkit for Academic Success.
+13062052269
info@desklib.com
Available 24*7 on WhatsApp / Email
![[object Object]](/_next/static/media/star-bottom.7253800d.svg)
Unlock your academic potential
Copyright © 2020–2026 A2Z Services. All Rights Reserved. Developed and managed by ZUCOL.