CEM233 Urban Energy Systems: District Energy Options Report Analysis
VerifiedAdded on 2022/08/16
|15
|4055
|268
Report
AI Summary
This report analyzes three alternative strategies for providing sustainable energy services to a university campus, serving as a proxy for an urban area. The strategies include traditional grid electricity and gas, biomass-fired CHP with grid and gas supplementation, and wind turbines with hydrogen storage and heat export. The report details system diagrams, input information, and calculations for each alternative, considering energy supplies, utilities, and storage. Calculations determine energy demands, efficiencies, and fuel requirements. The results are discussed, comparing the viability of each strategy based on factors like efficiency and sustainability. The report concludes by evaluating the effectiveness of each approach in meeting the university's energy needs, highlighting the role of system thinking in assessing urban energy options and the challenges of achieving sustainable development in urban centers. The assignment aligns with the CEM233 module, focusing on district energy options within the context of urban energy systems.
1URBAN ENERGY SYSTEM DESIGN
Urban Energy System Design
[Name]
[Course]
[Tutor/Prof/Lecturer]
[Date}
Urban Energy System Design
[Name]
[Course]
[Tutor/Prof/Lecturer]
[Date}
Paraphrase This Document
Need a fresh take? Get an instant paraphrase of this document with our AI Paraphraser
2URBAN ENERGY SYSTEM DESIGN
Table of Contents
Introduction...................................................................................................................3
Background...................................................................................................................4
Systems Approach........................................................................................................4
Systems Diagrams.........................................................................................................5
Strategy Alternative 1: Traditional supplied electricity from the grid and gas...........6
Strategy Alternative 2: Biomass fired CHP supplemented with traditional supplied
electricity from the grid and gas................................................................................6
Strategy Alternative 3: wind turbine(s) providing electricity, the surplus electricity
being stored as gas.....................................................................................................7
Input Information and Calculations...............................................................................7
Supplies.....................................................................................................................7
Conventional Grid Power.......................................................................................7
Wind and Biomass Fuel Energy.............................................................................8
Energy Utilities..........................................................................................................8
Energy Storages.........................................................................................................8
Calculations..................................................................................................................8
Strategy Alternative 1................................................................................................8
Strategy Alternative 2:.............................................................................................10
Strategy Alternative 3..............................................................................................11
Results and Discussion................................................................................................12
The first alternative..................................................................................................12
The second Alternative............................................................................................13
Third alternative......................................................................................................13
Discussion...................................................................................................................14
Conclusions................................................................................................................. 15
References................................................................................................................... 15
3URBAN ENERGY SYSTEM DESIGN
Introduction
Each country globally today is having an increase in the growth of urbanization,
where towns are quickly transitioning into cities. This forms a platform for a thrive in social
lives, economic activities, technological advancements, and these have brought with them
more demand for energy system and environmental sustainability. The last decade marked a
vital watershed in the history of humanity, where more than half of the world population
lived in urban centres. From the same report by UN estimates that by the year 2050 the world
population living in the urban areas will be more than two – thirds of the population of the
world. With this, it is estimated that around three-quarters of global energy, final, is used by
the persons who live in the urban centres. At the same time, the primary energy and the
carbon emission becoming comparable (United Nations, 2018).
Given the population increase in the urban centres in the developed world, like the UK, the
energy and sustainability challenges of equitable clean-energy services access, there’s no
discourse that can develop around that without addressing explicitly the urban energy systems
considerations. In addressing this, the paper will use a University setting to model the urban
centre, (since it has lecture halls, Office, catering, and residential buildings), assuming it
represents the day-to-day human activities that takes place in an urban centre. While
focussing on the university, the paper shall consider three alternatives strategies to provide a
sustainable energy services required by the University.
Background
Half of the population in the world have dwellings in urban centres, and energy
consumptions percentage in the cities range from about 60 – 80% of the energy resources of
the world and in return produce about 70% of carbon emission. That means the weight of
achieving sustainable development and consumption lies in the shoulders of those in
authorities in the cities. A city with a planning and good management mechanisms can
minimise the energy consumed and allow its citizens to efficiently consume the resources.
Energy access remains a major challenge in achieving sustainable development, others are:
energy sufficiency, the demand management of energy, and renewable energy systems
deployment, and relevant technologies (UN-HABITAT, 2019).
System thinking approach is a way of understanding how things, which are
known as systems, affect one another within a whole (Kishau, 2020). In this context, the
asses to energy has to be viewed in the realms of sustainability, where the system thinking
will help in determination how the energy options are sustainable or support sustainable
development. Sustainable development, when it comes to energy systems could mean that the
energy demands are met, presently or in the current framework, but not hindering the ability
of posterity to meet their own, or depleting mechanisms that could allow them generate their
own energy. Energy system and the interaction of its different components is a very
complicated phenomenon and simple solutions will not be able to bring the desired outcomes.
The system thinking will be helpful in unravelling the transformation in each element of
energy system or how they are related affects the system wholesomely. For instance, if
there’s a development in the radiator or the piping system, this could bring out a change in
how the heating takes place.
⊘ This is a preview!⊘
Do you want full access?
Subscribe today to unlock all pages.
Trusted by 1+ million students worldwide
4URBAN ENERGY SYSTEM DESIGN
Systems Approach
A collection of various components coordinated to work together, and
interconnected to each other, so that a final product comes out which otherwise would have
not been produced by one component is called a system. The quality of what is produced at
the end depends on the elements depend on each other and how they are interconnected, or
programmed. For instance, the electrical system in the UK, where electricity reaches each
home after being generated, transmitted and distributed through cables or different sizes to
homes in an appropriate capacity (voltage). Throughout the journey, there are losses incurred
in between transmission, and distribution
At the moment, energy efficiency represents one of the key challenges to
achieving the transformation into a less carbon world. The reduction of the energy use brings
with it a range of technicalities and spatial scales: from the equipment to the building energy
systems etc. The enhancement of energy efficiency is understood as very relevant point of
consideration in the planning at the urban development framework, which is represented by
the university. However, there have been studies that give evidence of major gaps that do
exist while trying to enhance the efficiency of energy systems within a locality. The starting
point to efficiency enhancement being a comprehensive assessment of the energy system.
Most of the times assessment is done at the point of use (which is a point where the product
or service is consumed). Assessing energy at this point, for electrical system means no
accounting for the losses, and for hot water system means not accounting for the temperature
loss when the water is flowing (Energy Star, 2020).
The ecosystem approach is a concept that work within a framework of land, water
and living resource management in a way that is in line with the conservation procedures and
equitable (Convention on Biological Diversity, 2019). When ecosystem is mentioned, the
three primary natural resources comes to mind, water, land and living organisms, and all
these are supported by the sun When considering ecosystem approach when mapping, it
shows where to start, by looking at the end product you can know where to start. For
instance, electricity generation for domestic use, if the electricity is from a solar PV, the
major question is where to locate the solar panels (land), if my system is to boil, then the
source etc.
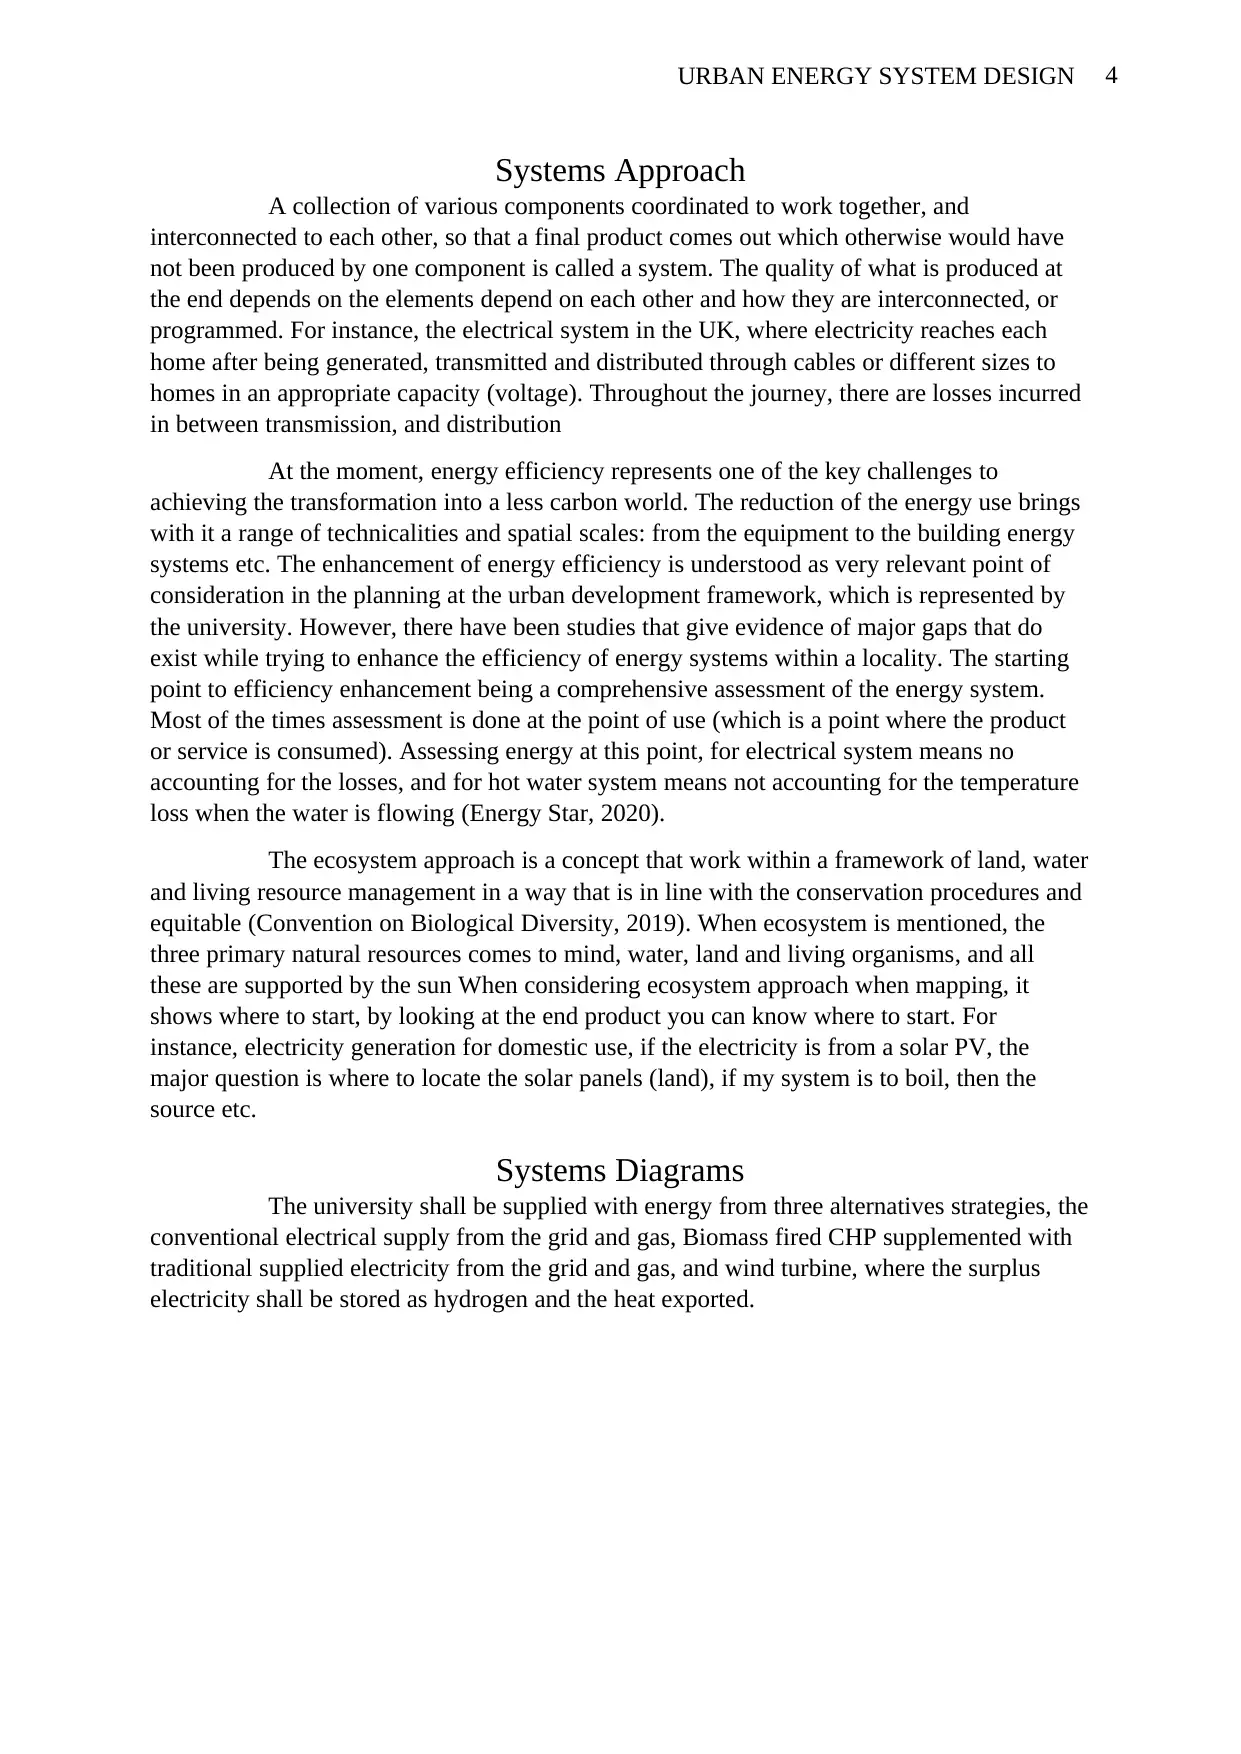
Systems Diagrams
The university shall be supplied with energy from three alternatives strategies, the
conventional electrical supply from the grid and gas, Biomass fired CHP supplemented with
traditional supplied electricity from the grid and gas, and wind turbine, where the surplus
electricity shall be stored as hydrogen and the heat exported.
Systems Approach
A collection of various components coordinated to work together, and
interconnected to each other, so that a final product comes out which otherwise would have
not been produced by one component is called a system. The quality of what is produced at
the end depends on the elements depend on each other and how they are interconnected, or
programmed. For instance, the electrical system in the UK, where electricity reaches each
home after being generated, transmitted and distributed through cables or different sizes to
homes in an appropriate capacity (voltage). Throughout the journey, there are losses incurred
in between transmission, and distribution
At the moment, energy efficiency represents one of the key challenges to
achieving the transformation into a less carbon world. The reduction of the energy use brings
with it a range of technicalities and spatial scales: from the equipment to the building energy
systems etc. The enhancement of energy efficiency is understood as very relevant point of
consideration in the planning at the urban development framework, which is represented by
the university. However, there have been studies that give evidence of major gaps that do
exist while trying to enhance the efficiency of energy systems within a locality. The starting
point to efficiency enhancement being a comprehensive assessment of the energy system.
Most of the times assessment is done at the point of use (which is a point where the product
or service is consumed). Assessing energy at this point, for electrical system means no
accounting for the losses, and for hot water system means not accounting for the temperature
loss when the water is flowing (Energy Star, 2020).
The ecosystem approach is a concept that work within a framework of land, water
and living resource management in a way that is in line with the conservation procedures and
equitable (Convention on Biological Diversity, 2019). When ecosystem is mentioned, the
three primary natural resources comes to mind, water, land and living organisms, and all
these are supported by the sun When considering ecosystem approach when mapping, it
shows where to start, by looking at the end product you can know where to start. For
instance, electricity generation for domestic use, if the electricity is from a solar PV, the
major question is where to locate the solar panels (land), if my system is to boil, then the
source etc.
Systems Diagrams
The university shall be supplied with energy from three alternatives strategies, the
conventional electrical supply from the grid and gas, Biomass fired CHP supplemented with
traditional supplied electricity from the grid and gas, and wind turbine, where the surplus
electricity shall be stored as hydrogen and the heat exported.
Paraphrase This Document
Need a fresh take? Get an instant paraphrase of this document with our AI Paraphraser
5URBAN ENERGY SYSTEM DESIGN
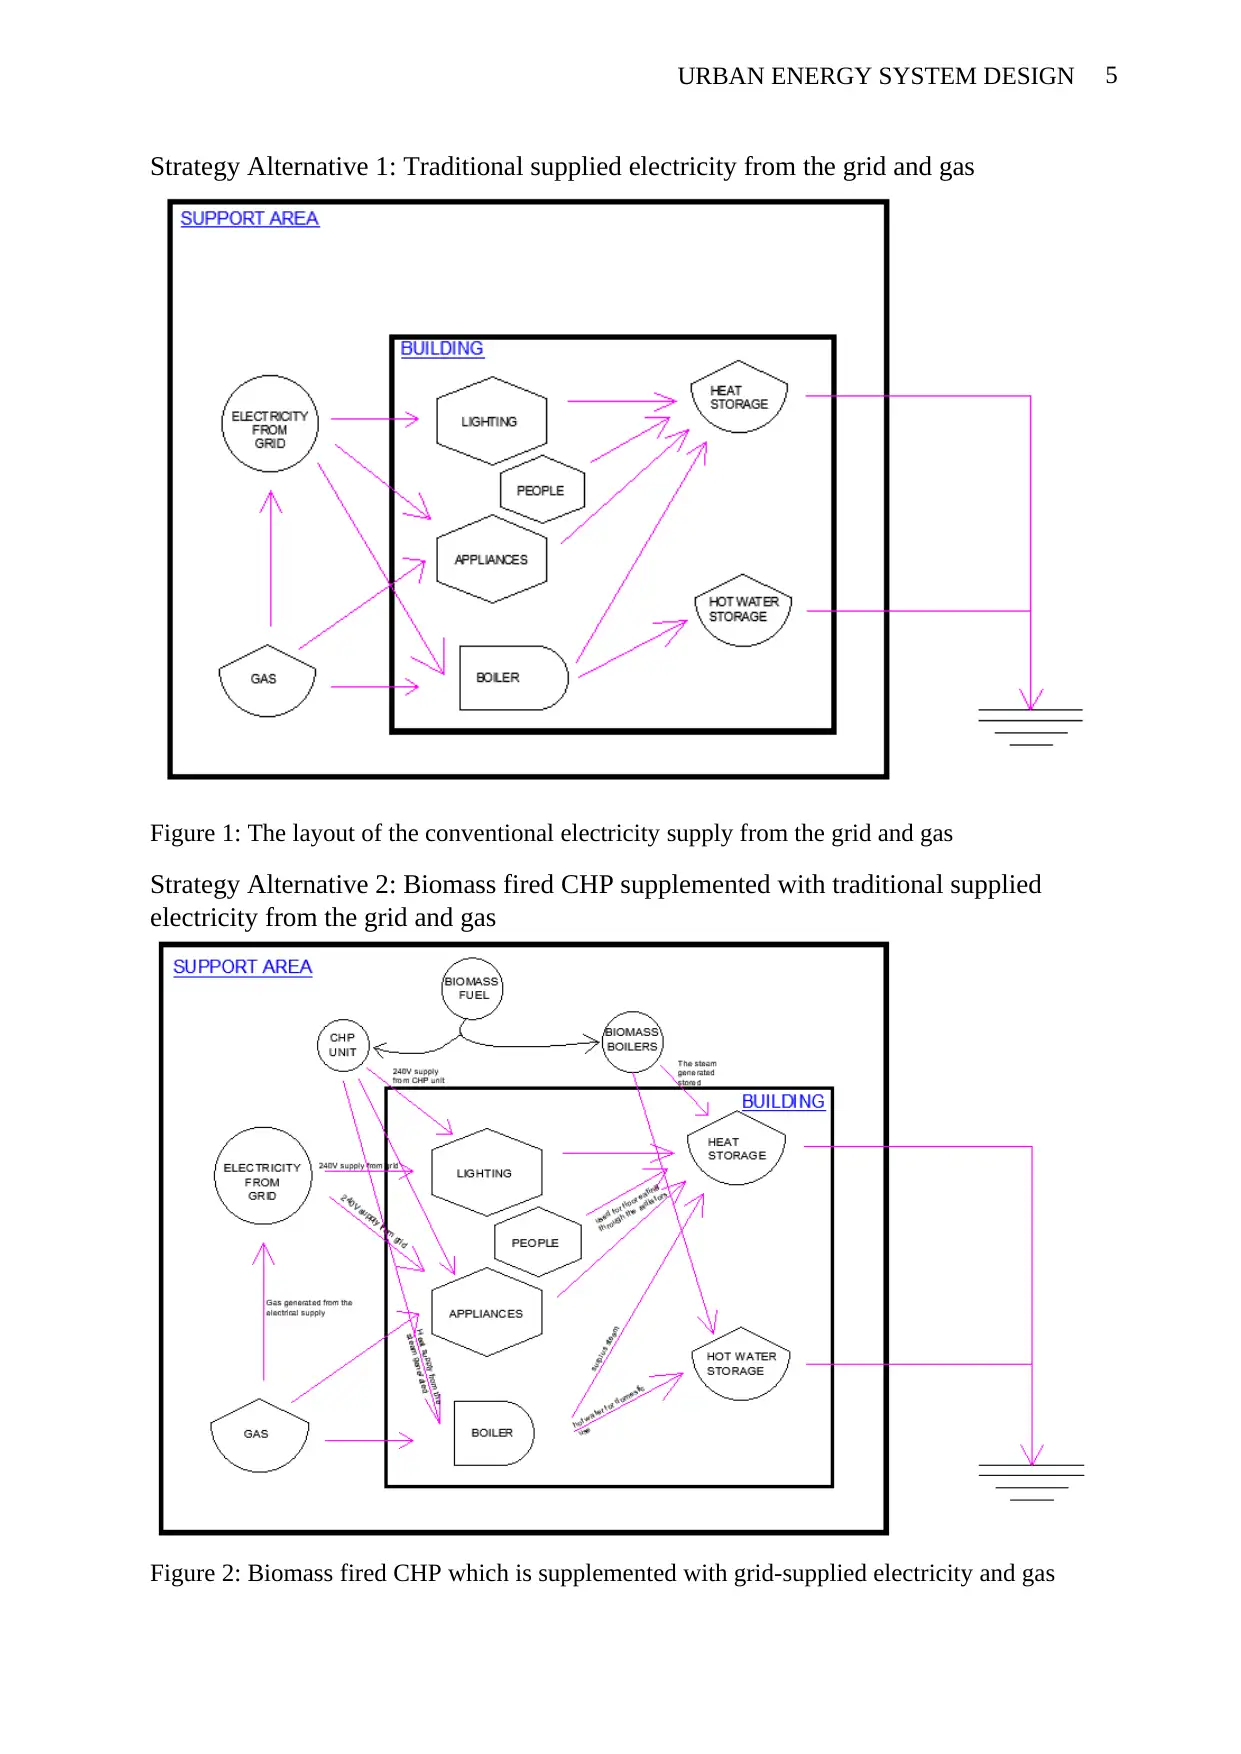
Strategy Alternative 1: Traditional supplied electricity from the grid and gas
Figure 1: The layout of the conventional electricity supply from the grid and gas
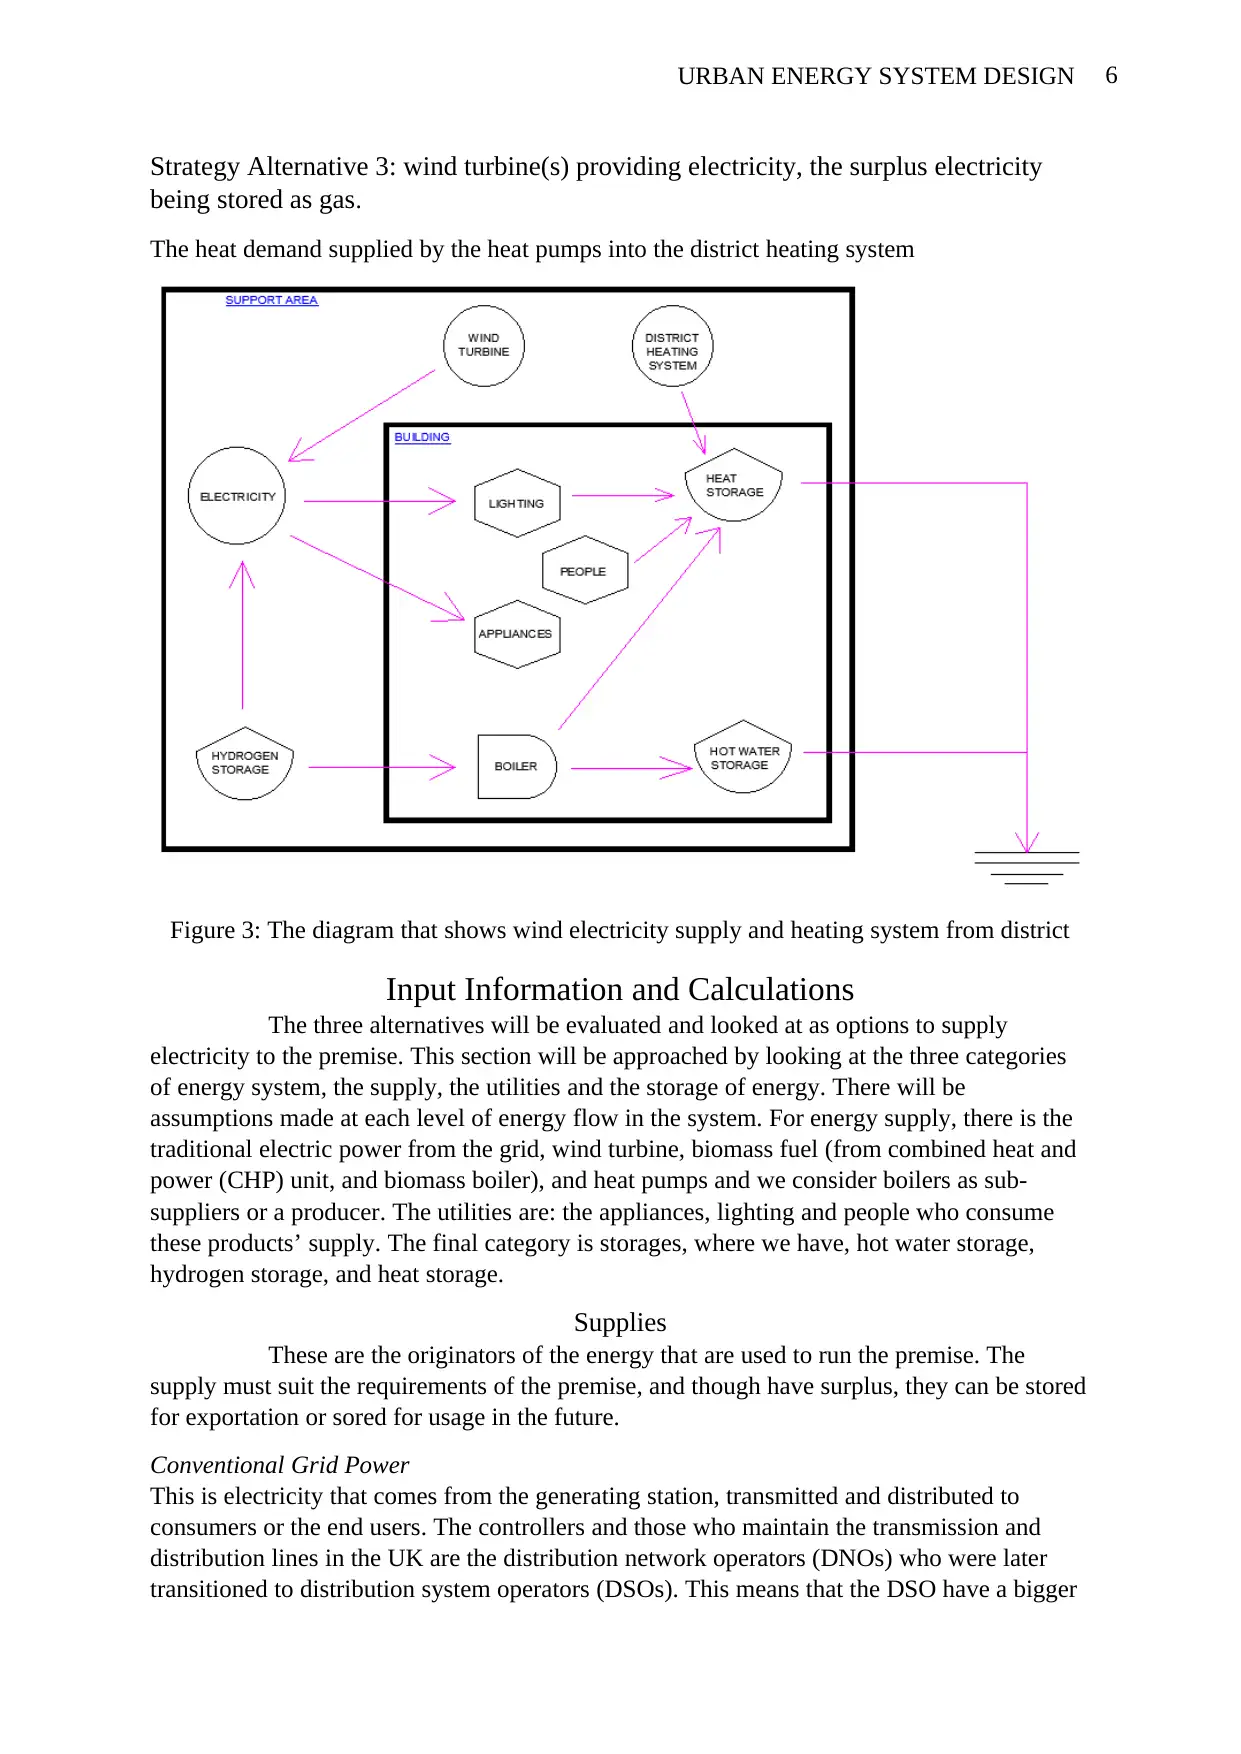
Strategy Alternative 2: Biomass fired CHP supplemented with traditional supplied
electricity from the grid and gas
Figure 2: Biomass fired CHP which is supplemented with grid-supplied electricity and gas
Strategy Alternative 1: Traditional supplied electricity from the grid and gas
Figure 1: The layout of the conventional electricity supply from the grid and gas
Strategy Alternative 2: Biomass fired CHP supplemented with traditional supplied
electricity from the grid and gas
Figure 2: Biomass fired CHP which is supplemented with grid-supplied electricity and gas
6URBAN ENERGY SYSTEM DESIGN
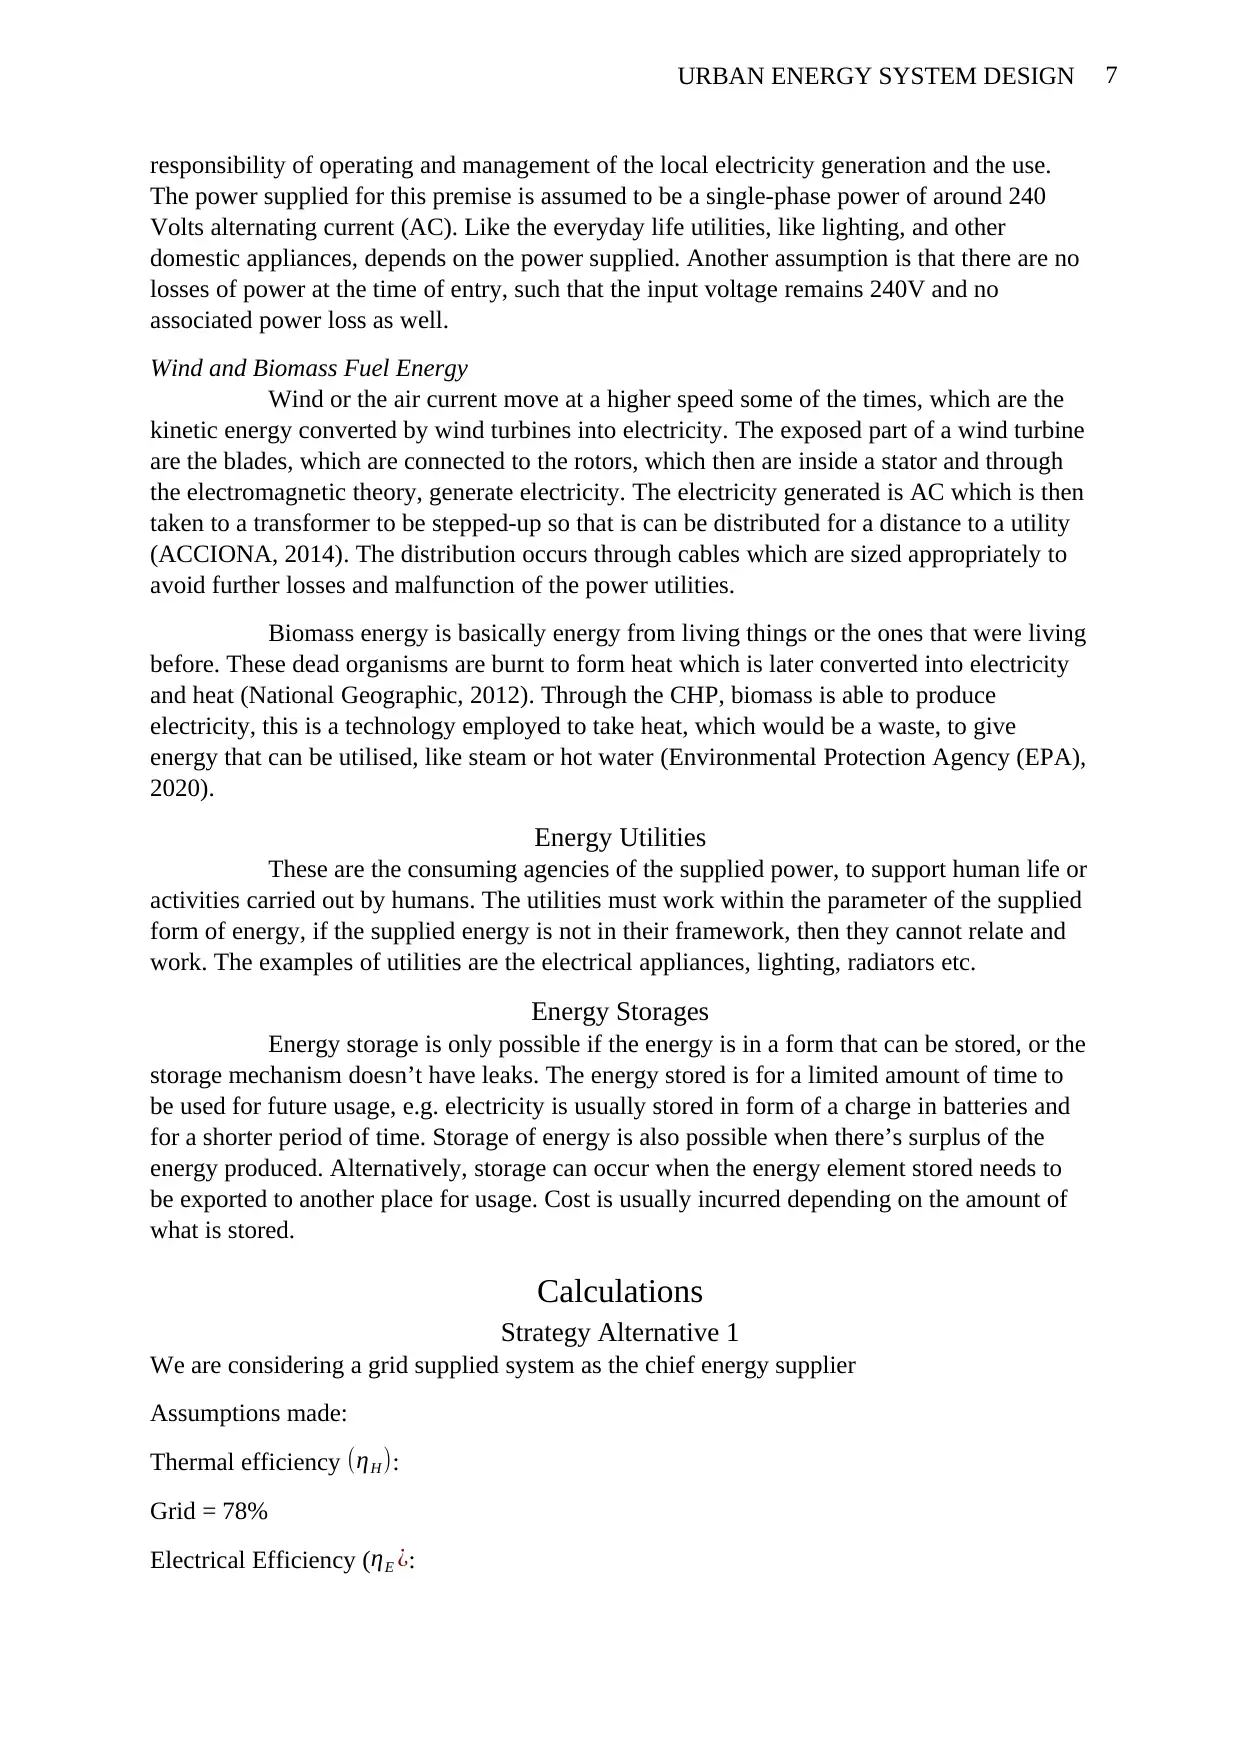
Strategy Alternative 3: wind turbine(s) providing electricity, the surplus electricity
being stored as gas.
The heat demand supplied by the heat pumps into the district heating system
Figure 3: The diagram that shows wind electricity supply and heating system from district
Input Information and Calculations
The three alternatives will be evaluated and looked at as options to supply
electricity to the premise. This section will be approached by looking at the three categories
of energy system, the supply, the utilities and the storage of energy. There will be
assumptions made at each level of energy flow in the system. For energy supply, there is the
traditional electric power from the grid, wind turbine, biomass fuel (from combined heat and
power (CHP) unit, and biomass boiler), and heat pumps and we consider boilers as sub-
suppliers or a producer. The utilities are: the appliances, lighting and people who consume
these products’ supply. The final category is storages, where we have, hot water storage,
hydrogen storage, and heat storage.
Supplies
These are the originators of the energy that are used to run the premise. The
supply must suit the requirements of the premise, and though have surplus, they can be stored
for exportation or sored for usage in the future.
Conventional Grid Power
This is electricity that comes from the generating station, transmitted and distributed to
consumers or the end users. The controllers and those who maintain the transmission and
distribution lines in the UK are the distribution network operators (DNOs) who were later
transitioned to distribution system operators (DSOs). This means that the DSO have a bigger
⊘ This is a preview!⊘
Do you want full access?
Subscribe today to unlock all pages.
Trusted by 1+ million students worldwide
7URBAN ENERGY SYSTEM DESIGN
responsibility of operating and management of the local electricity generation and the use.
The power supplied for this premise is assumed to be a single-phase power of around 240
Volts alternating current (AC). Like the everyday life utilities, like lighting, and other
domestic appliances, depends on the power supplied. Another assumption is that there are no
losses of power at the time of entry, such that the input voltage remains 240V and no
associated power loss as well.
Wind and Biomass Fuel Energy
Wind or the air current move at a higher speed some of the times, which are the
kinetic energy converted by wind turbines into electricity. The exposed part of a wind turbine
are the blades, which are connected to the rotors, which then are inside a stator and through
the electromagnetic theory, generate electricity. The electricity generated is AC which is then
taken to a transformer to be stepped-up so that is can be distributed for a distance to a utility
(ACCIONA, 2014). The distribution occurs through cables which are sized appropriately to
avoid further losses and malfunction of the power utilities.
Biomass energy is basically energy from living things or the ones that were living
before. These dead organisms are burnt to form heat which is later converted into electricity
and heat (National Geographic, 2012). Through the CHP, biomass is able to produce
electricity, this is a technology employed to take heat, which would be a waste, to give
energy that can be utilised, like steam or hot water (Environmental Protection Agency (EPA),
2020).
Energy Utilities
These are the consuming agencies of the supplied power, to support human life or
activities carried out by humans. The utilities must work within the parameter of the supplied
form of energy, if the supplied energy is not in their framework, then they cannot relate and
work. The examples of utilities are the electrical appliances, lighting, radiators etc.
Energy Storages
Energy storage is only possible if the energy is in a form that can be stored, or the
storage mechanism doesn’t have leaks. The energy stored is for a limited amount of time to
be used for future usage, e.g. electricity is usually stored in form of a charge in batteries and
for a shorter period of time. Storage of energy is also possible when there’s surplus of the
energy produced. Alternatively, storage can occur when the energy element stored needs to
be exported to another place for usage. Cost is usually incurred depending on the amount of
what is stored.
Calculations
Strategy Alternative 1
We are considering a grid supplied system as the chief energy supplier
Assumptions made:
Thermal efficiency (ηH ):
Grid = 78%
Electrical Efficiency (ηE ¿:
Paraphrase This Document
Need a fresh take? Get an instant paraphrase of this document with our AI Paraphraser
8URBAN ENERGY SYSTEM DESIGN
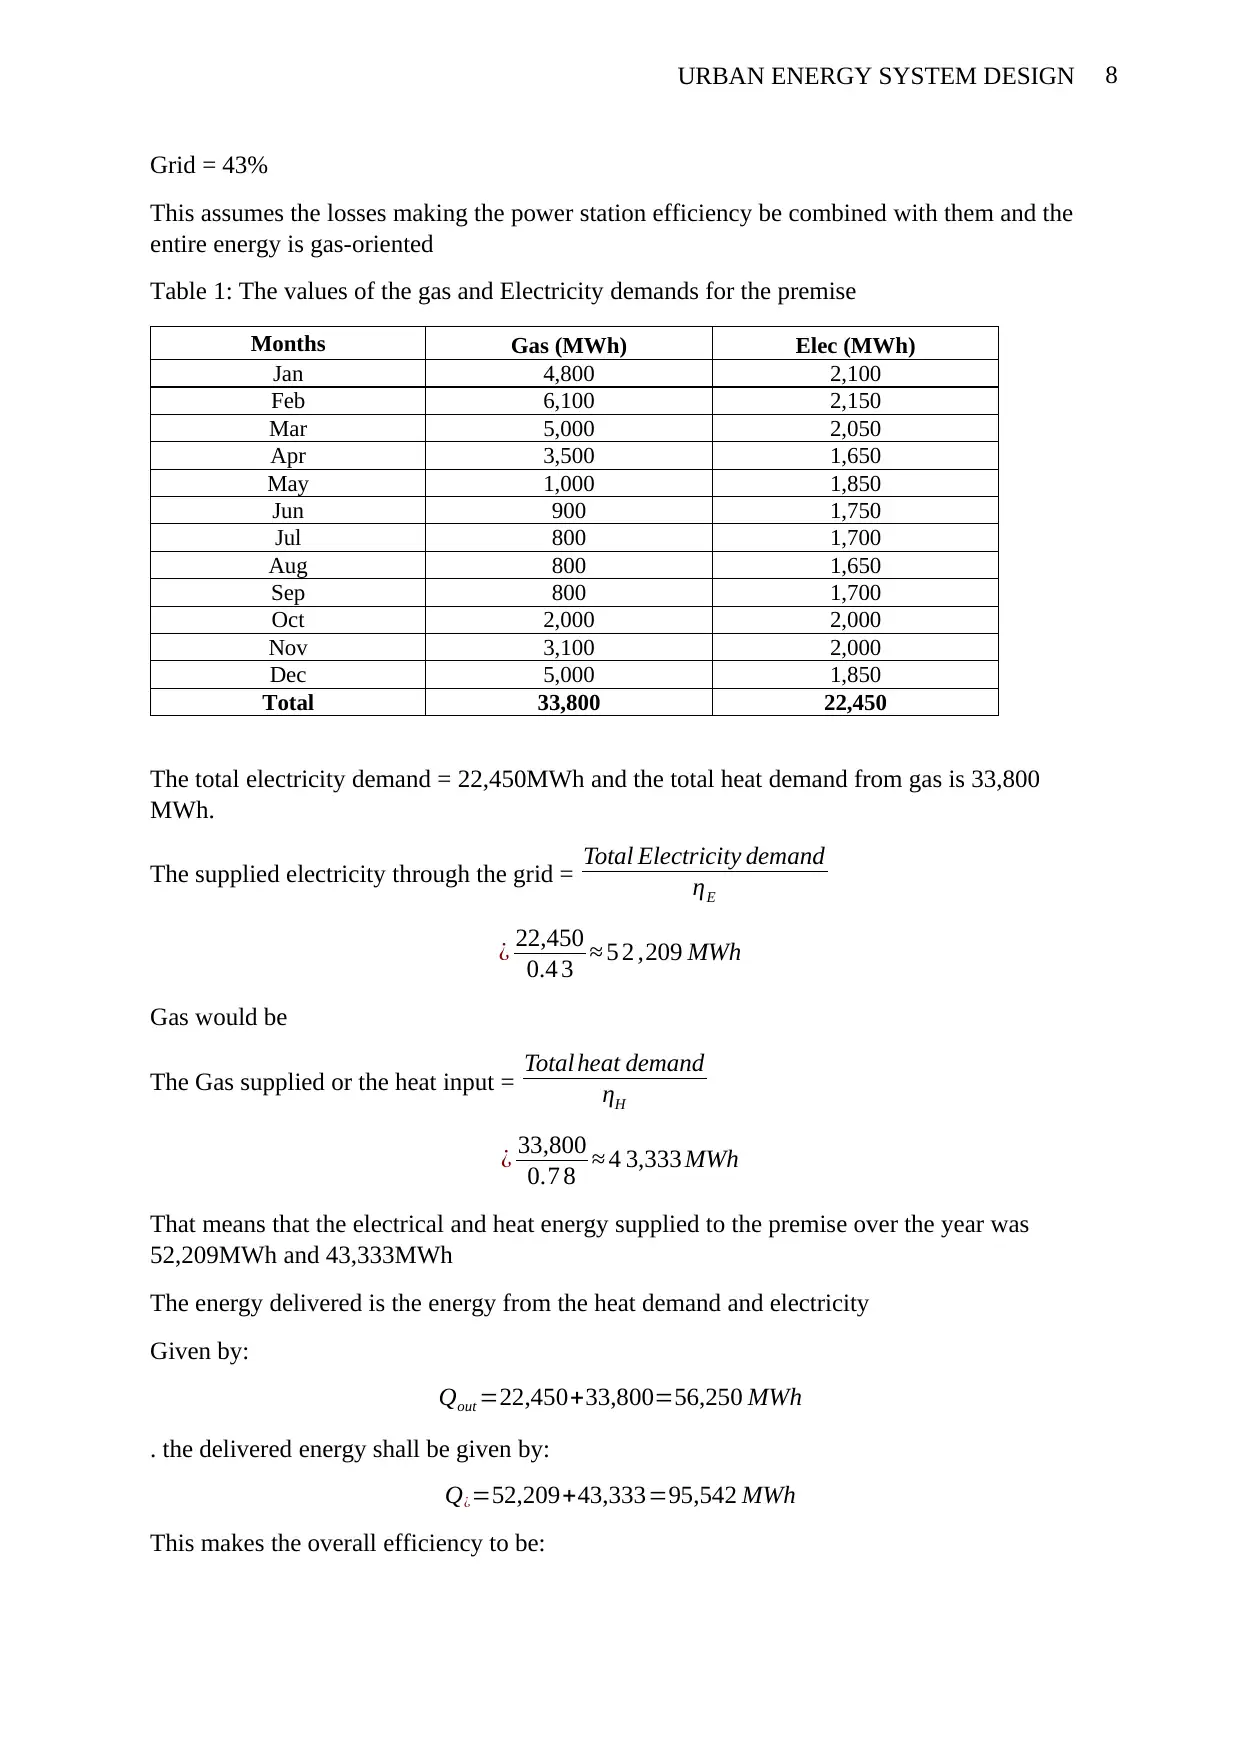
Grid = 43%
This assumes the losses making the power station efficiency be combined with them and the
entire energy is gas-oriented
Table 1: The values of the gas and Electricity demands for the premise
Months Gas (MWh) Elec (MWh)
Jan 4,800 2,100
Feb 6,100 2,150
Mar 5,000 2,050
Apr 3,500 1,650
May 1,000 1,850
Jun 900 1,750
Jul 800 1,700
Aug 800 1,650
Sep 800 1,700
Oct 2,000 2,000
Nov 3,100 2,000
Dec 5,000 1,850
Total 33,800 22,450
The total electricity demand = 22,450MWh and the total heat demand from gas is 33,800
MWh.
The supplied electricity through the grid = Total Electricity demand
ηE
¿ 22,450
0.4 3 ≈ 5 2 ,209 MWh
Gas would be
The Gas supplied or the heat input = Total heat demand
ηH
¿ 33,800
0.7 8 ≈ 4 3,333 MWh
That means that the electrical and heat energy supplied to the premise over the year was
52,209MWh and 43,333MWh
The energy delivered is the energy from the heat demand and electricity
Given by:
Qout =22,450+33,800=56,250 MWh
. the delivered energy shall be given by:
Q¿=52,209+43,333=95,542 MWh
This makes the overall efficiency to be:
9URBAN ENERGY SYSTEM DESIGN
ηT = Q¿
Qout
×100=56,250
95,542 ×100
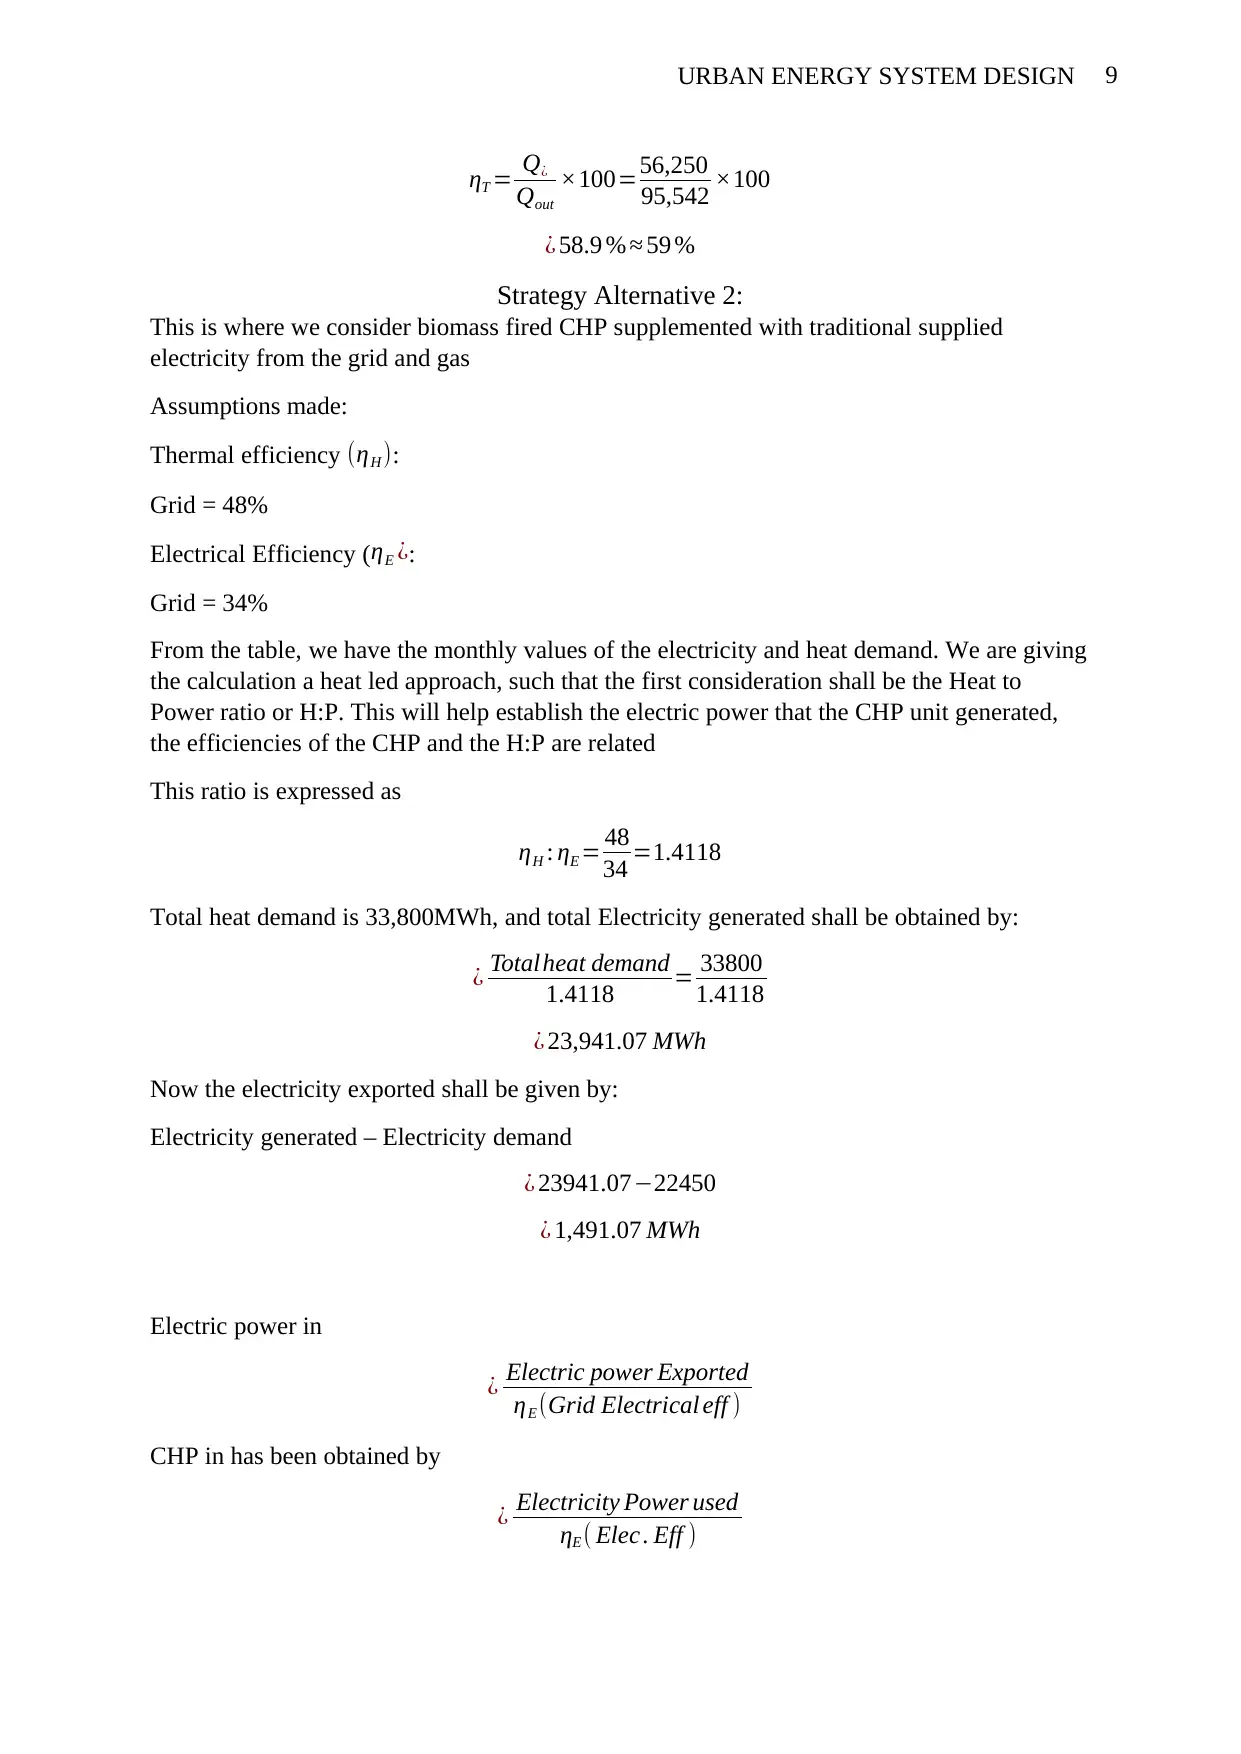
¿ 58.9 % ≈ 59 %
Strategy Alternative 2:
This is where we consider biomass fired CHP supplemented with traditional supplied
electricity from the grid and gas
Assumptions made:
Thermal efficiency (ηH ):
Grid = 48%
Electrical Efficiency ( ηE ¿:
Grid = 34%
From the table, we have the monthly values of the electricity and heat demand. We are giving
the calculation a heat led approach, such that the first consideration shall be the Heat to
Power ratio or H:P. This will help establish the electric power that the CHP unit generated,
the efficiencies of the CHP and the H:P are related
This ratio is expressed as
ηH : ηE = 48
34 =1.4118
Total heat demand is 33,800MWh, and total Electricity generated shall be obtained by:
¿ Totalheat demand
1.4118 = 33800
1.4118
¿ 23,941.07 MWh
Now the electricity exported shall be given by:
Electricity generated – Electricity demand
¿ 23941.07−22450
¿ 1,491.07 MWh
Electric power in
¿ Electric power Exported
ηE (Grid Electrical eff )
CHP in has been obtained by
¿ Electricity Power used
ηE ( Elec . Eff )
ηT = Q¿
Qout
×100=56,250
95,542 ×100
¿ 58.9 % ≈ 59 %
Strategy Alternative 2:
This is where we consider biomass fired CHP supplemented with traditional supplied
electricity from the grid and gas
Assumptions made:
Thermal efficiency (ηH ):
Grid = 48%
Electrical Efficiency ( ηE ¿:
Grid = 34%
From the table, we have the monthly values of the electricity and heat demand. We are giving
the calculation a heat led approach, such that the first consideration shall be the Heat to
Power ratio or H:P. This will help establish the electric power that the CHP unit generated,
the efficiencies of the CHP and the H:P are related
This ratio is expressed as
ηH : ηE = 48
34 =1.4118
Total heat demand is 33,800MWh, and total Electricity generated shall be obtained by:
¿ Totalheat demand
1.4118 = 33800
1.4118
¿ 23,941.07 MWh
Now the electricity exported shall be given by:
Electricity generated – Electricity demand
¿ 23941.07−22450
¿ 1,491.07 MWh
Electric power in
¿ Electric power Exported
ηE (Grid Electrical eff )
CHP in has been obtained by
¿ Electricity Power used
ηE ( Elec . Eff )
⊘ This is a preview!⊘
Do you want full access?
Subscribe today to unlock all pages.
Trusted by 1+ million students worldwide
10URBAN ENERGY SYSTEM DESIGN
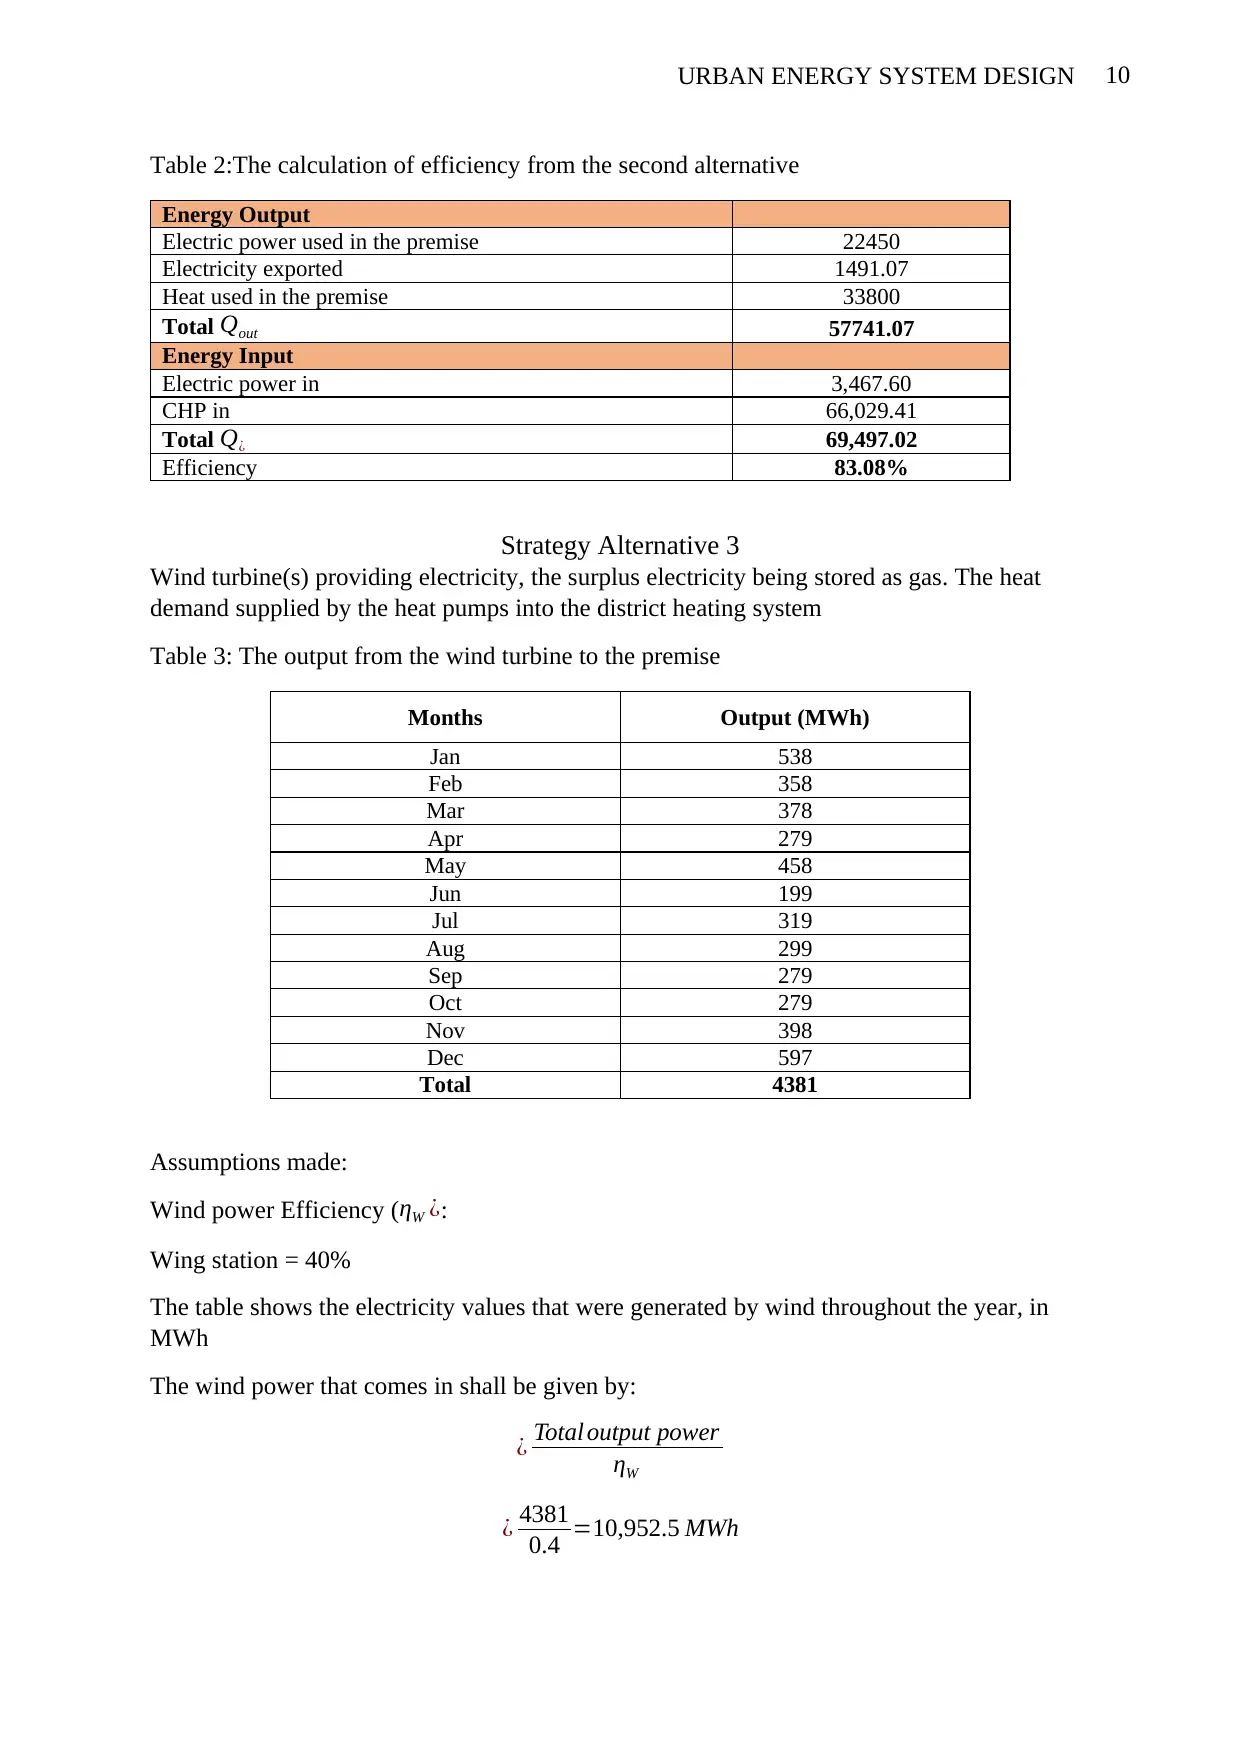
Table 2:The calculation of efficiency from the second alternative
Energy Output
Electric power used in the premise 22450
Electricity exported 1491.07
Heat used in the premise 33800
Total Qout 57741.07
Energy Input
Electric power in 3,467.60
CHP in 66,029.41
Total Q¿ 69,497.02
Efficiency 83.08%
Strategy Alternative 3
Wind turbine(s) providing electricity, the surplus electricity being stored as gas. The heat
demand supplied by the heat pumps into the district heating system
Table 3: The output from the wind turbine to the premise
Months Output (MWh)
Jan 538
Feb 358
Mar 378
Apr 279
May 458
Jun 199
Jul 319
Aug 299
Sep 279
Oct 279
Nov 398
Dec 597
Total 4381
Assumptions made:
Wind power Efficiency (ηW ¿:
Wing station = 40%
The table shows the electricity values that were generated by wind throughout the year, in
MWh
The wind power that comes in shall be given by:
¿ Total output power
ηW
¿ 4381
0.4 =10,952.5 MWh
Paraphrase This Document
Need a fresh take? Get an instant paraphrase of this document with our AI Paraphraser
11URBAN ENERGY SYSTEM DESIGN
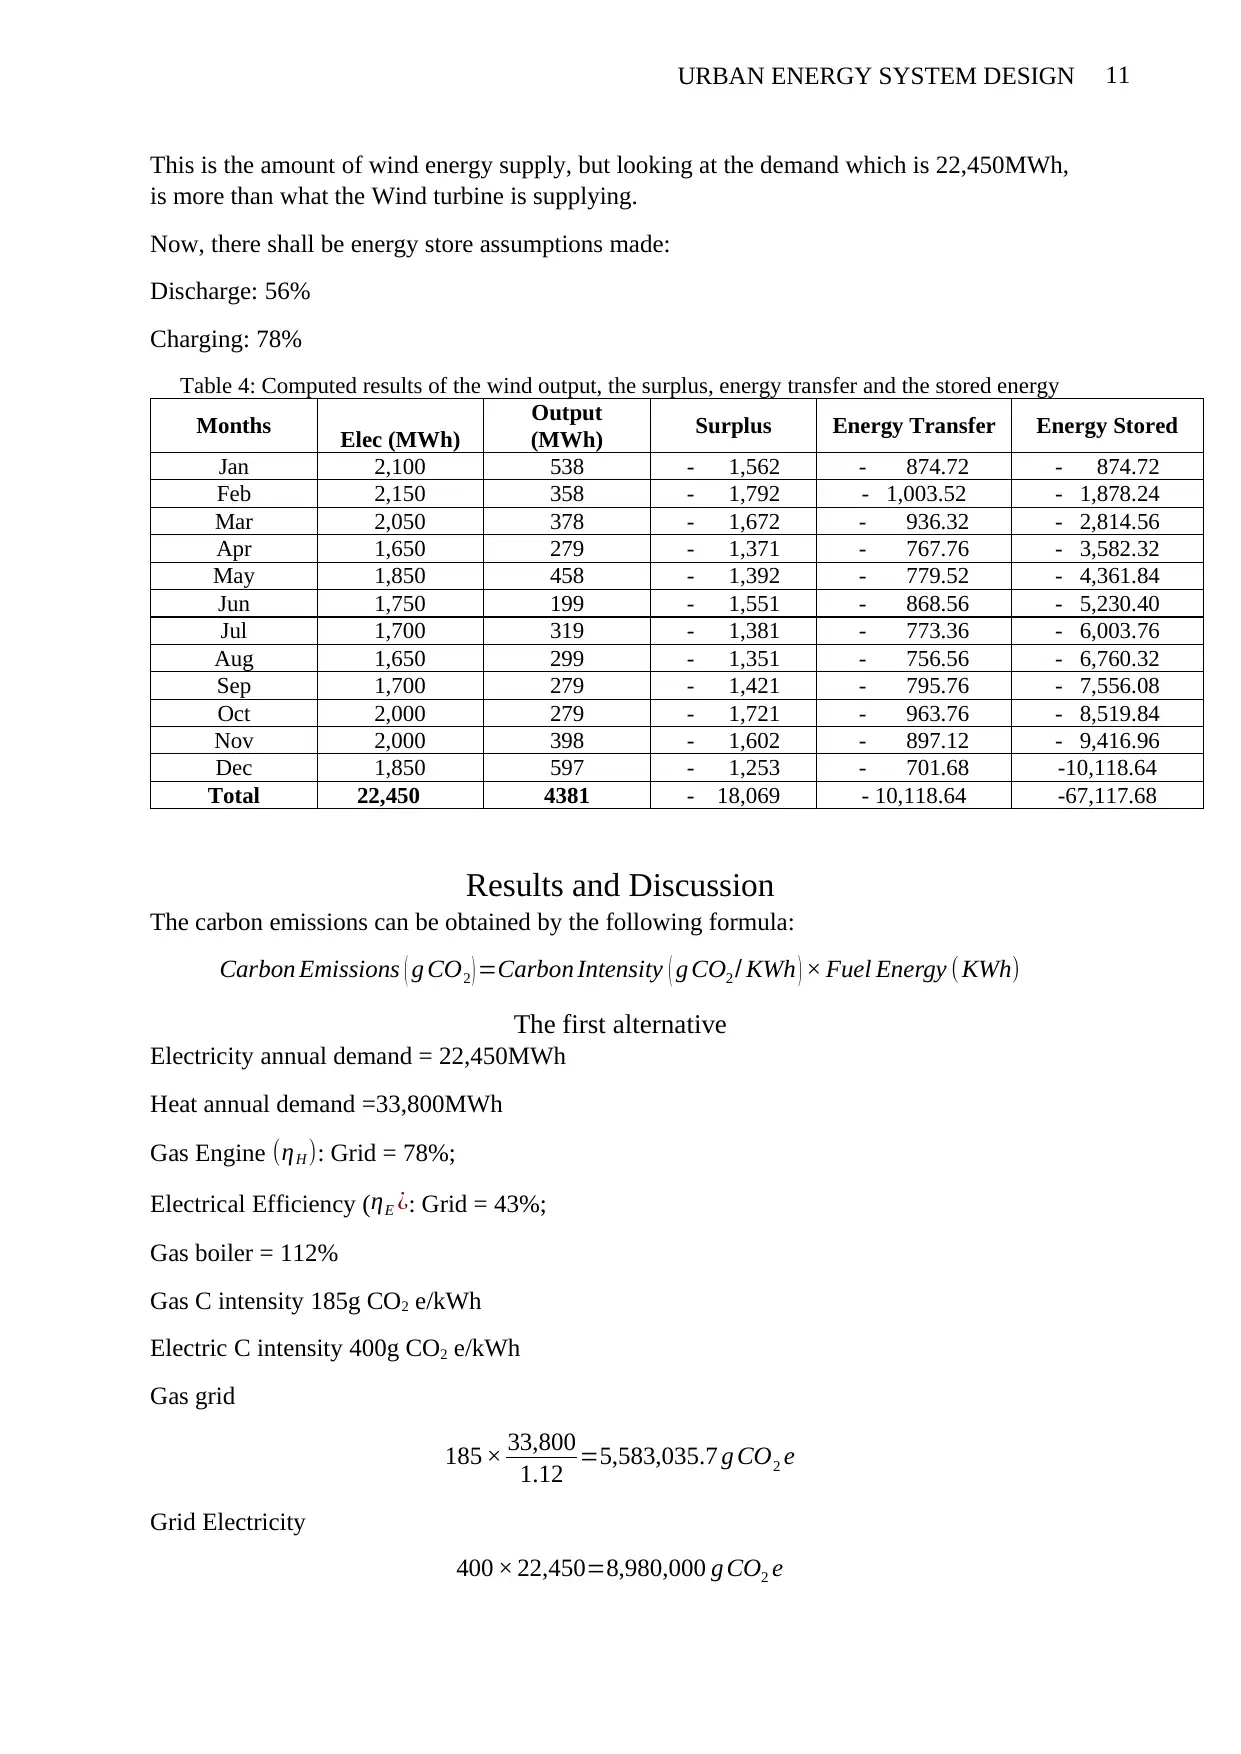
This is the amount of wind energy supply, but looking at the demand which is 22,450MWh,
is more than what the Wind turbine is supplying.
Now, there shall be energy store assumptions made:
Discharge: 56%
Charging: 78%
Table 4: Computed results of the wind output, the surplus, energy transfer and the stored energy
Months Elec (MWh)
Output
(MWh) Surplus Energy Transfer Energy Stored
Jan 2,100 538 - 1,562 - 874.72 - 874.72
Feb 2,150 358 - 1,792 - 1,003.52 - 1,878.24
Mar 2,050 378 - 1,672 - 936.32 - 2,814.56
Apr 1,650 279 - 1,371 - 767.76 - 3,582.32
May 1,850 458 - 1,392 - 779.52 - 4,361.84
Jun 1,750 199 - 1,551 - 868.56 - 5,230.40
Jul 1,700 319 - 1,381 - 773.36 - 6,003.76
Aug 1,650 299 - 1,351 - 756.56 - 6,760.32
Sep 1,700 279 - 1,421 - 795.76 - 7,556.08
Oct 2,000 279 - 1,721 - 963.76 - 8,519.84
Nov 2,000 398 - 1,602 - 897.12 - 9,416.96
Dec 1,850 597 - 1,253 - 701.68 -10,118.64
Total 22,450 4381 - 18,069 - 10,118.64 -67,117.68
Results and Discussion
The carbon emissions can be obtained by the following formula:
Carbon Emissions ( g CO2 ) =Carbon Intensity ( g CO2 / KWh ) × Fuel Energy ( KWh)
The first alternative
Electricity annual demand = 22,450MWh
Heat annual demand =33,800MWh
Gas Engine (ηH ): Grid = 78%;
Electrical Efficiency (ηE ¿: Grid = 43%;
Gas boiler = 112%
Gas C intensity 185g CO2 e/kWh
Electric C intensity 400g CO2 e/kWh
Gas grid
185 × 33,800
1.12 =5,583,035.7 g CO2 e
Grid Electricity
400 × 22,450=8,980,000 g CO2 e
12URBAN ENERGY SYSTEM DESIGN
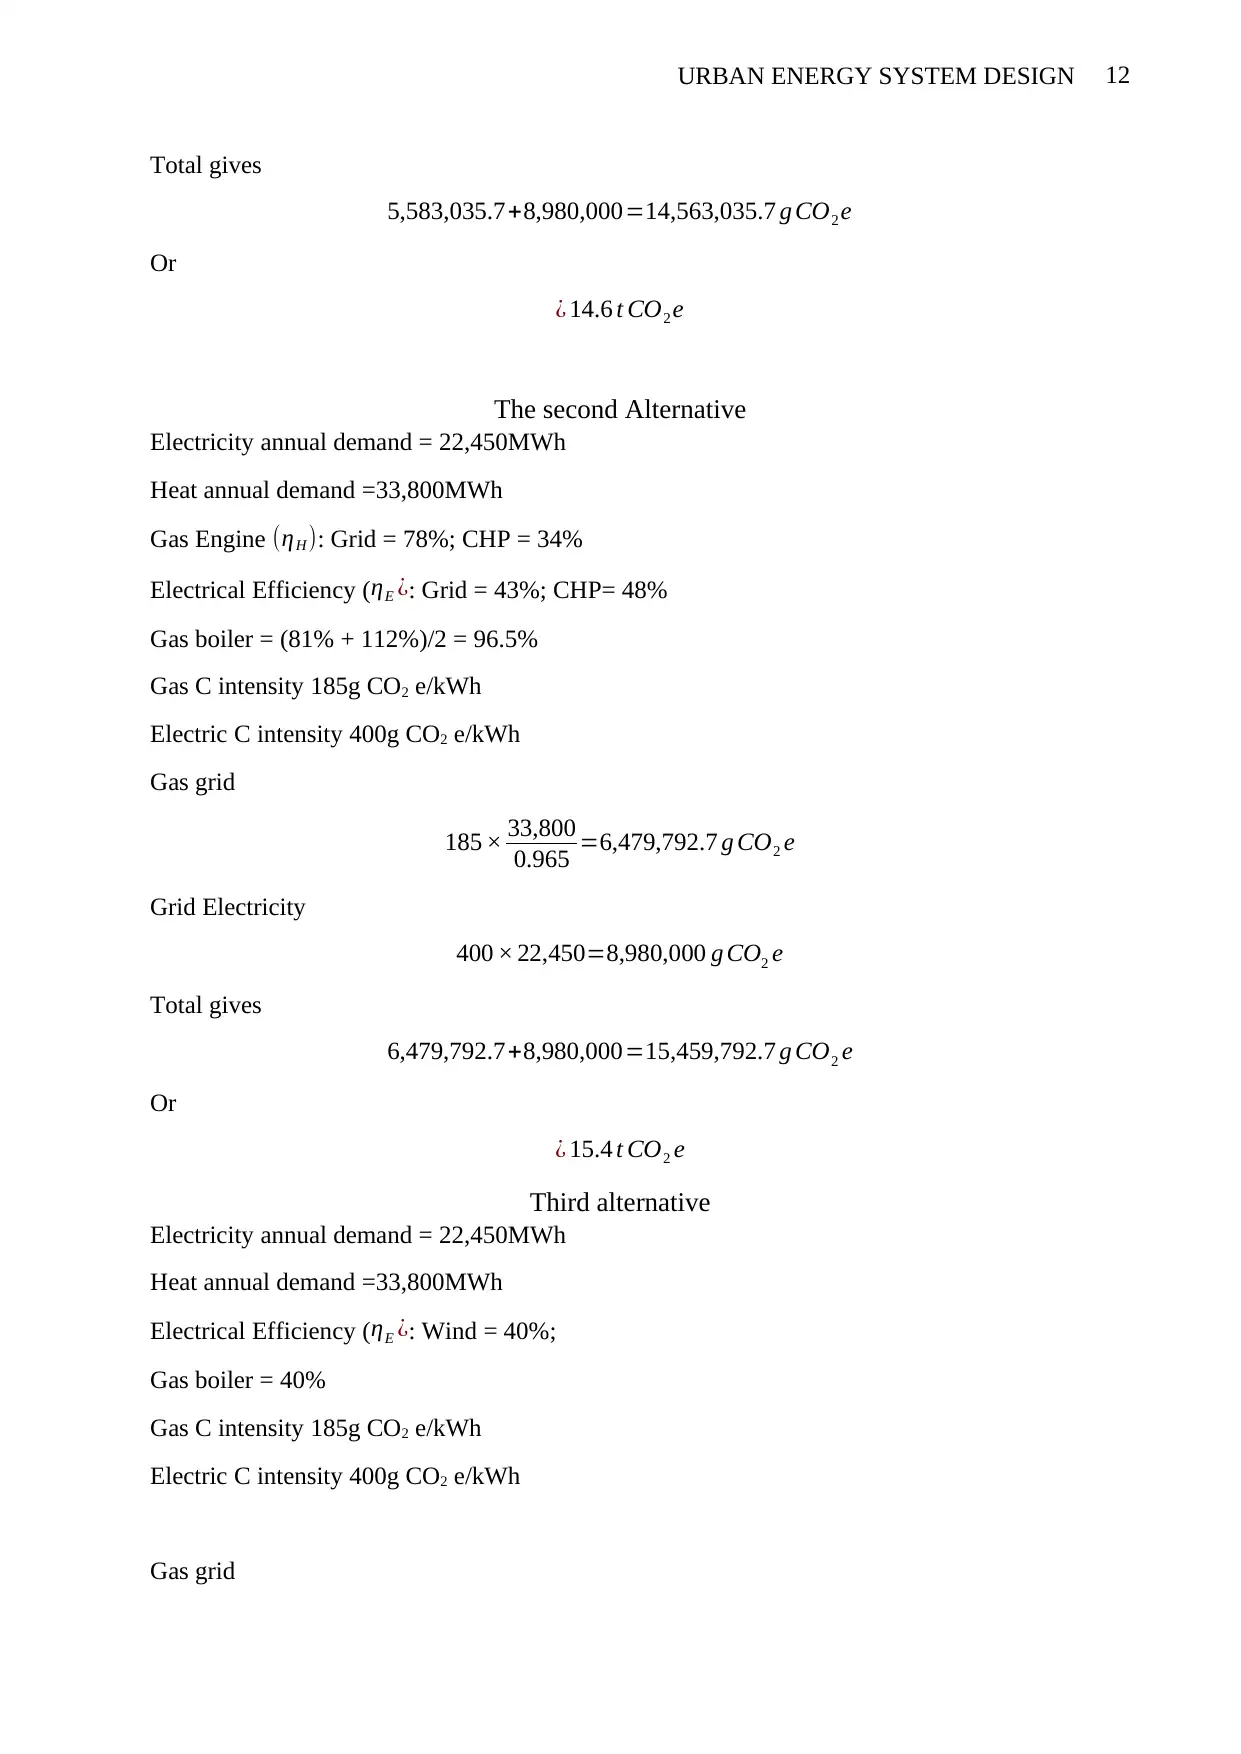
Total gives
5,583,035.7+8,980,000=14,563,035.7 g CO2 e
Or
¿ 14.6 t CO2 e
The second Alternative
Electricity annual demand = 22,450MWh
Heat annual demand =33,800MWh
Gas Engine (ηH ): Grid = 78%; CHP = 34%
Electrical Efficiency ( ηE ¿: Grid = 43%; CHP= 48%
Gas boiler = (81% + 112%)/2 = 96.5%
Gas C intensity 185g CO2 e/kWh
Electric C intensity 400g CO2 e/kWh
Gas grid
185 × 33,800
0.965 =6,479,792.7 g CO2 e
Grid Electricity
400 × 22,450=8,980,000 g CO2 e
Total gives
6,479,792.7+8,980,000=15,459,792.7 g CO2 e
Or
¿ 15.4 t CO2 e
Third alternative
Electricity annual demand = 22,450MWh
Heat annual demand =33,800MWh
Electrical Efficiency ( ηE ¿: Wind = 40%;
Gas boiler = 40%
Gas C intensity 185g CO2 e/kWh
Electric C intensity 400g CO2 e/kWh
Gas grid
Total gives
5,583,035.7+8,980,000=14,563,035.7 g CO2 e
Or
¿ 14.6 t CO2 e
The second Alternative
Electricity annual demand = 22,450MWh
Heat annual demand =33,800MWh
Gas Engine (ηH ): Grid = 78%; CHP = 34%
Electrical Efficiency ( ηE ¿: Grid = 43%; CHP= 48%
Gas boiler = (81% + 112%)/2 = 96.5%
Gas C intensity 185g CO2 e/kWh
Electric C intensity 400g CO2 e/kWh
Gas grid
185 × 33,800
0.965 =6,479,792.7 g CO2 e
Grid Electricity
400 × 22,450=8,980,000 g CO2 e
Total gives
6,479,792.7+8,980,000=15,459,792.7 g CO2 e
Or
¿ 15.4 t CO2 e
Third alternative
Electricity annual demand = 22,450MWh
Heat annual demand =33,800MWh
Electrical Efficiency ( ηE ¿: Wind = 40%;
Gas boiler = 40%
Gas C intensity 185g CO2 e/kWh
Electric C intensity 400g CO2 e/kWh
Gas grid
⊘ This is a preview!⊘
Do you want full access?
Subscribe today to unlock all pages.
Trusted by 1+ million students worldwide
1 out of 15
Related Documents


Your All-in-One AI-Powered Toolkit for Academic Success.
+13062052269
info@desklib.com
Available 24*7 on WhatsApp / Email
![[object Object]](/_next/static/media/star-bottom.7253800d.svg)
Unlock your academic potential
Copyright © 2020–2026 A2Z Services. All Rights Reserved. Developed and managed by ZUCOL.