ENVS1017 Assignment 1: Hydrology of Urban Streams and Restoration
VerifiedAdded on 2022/09/11
|7
|2077
|15
Report
AI Summary
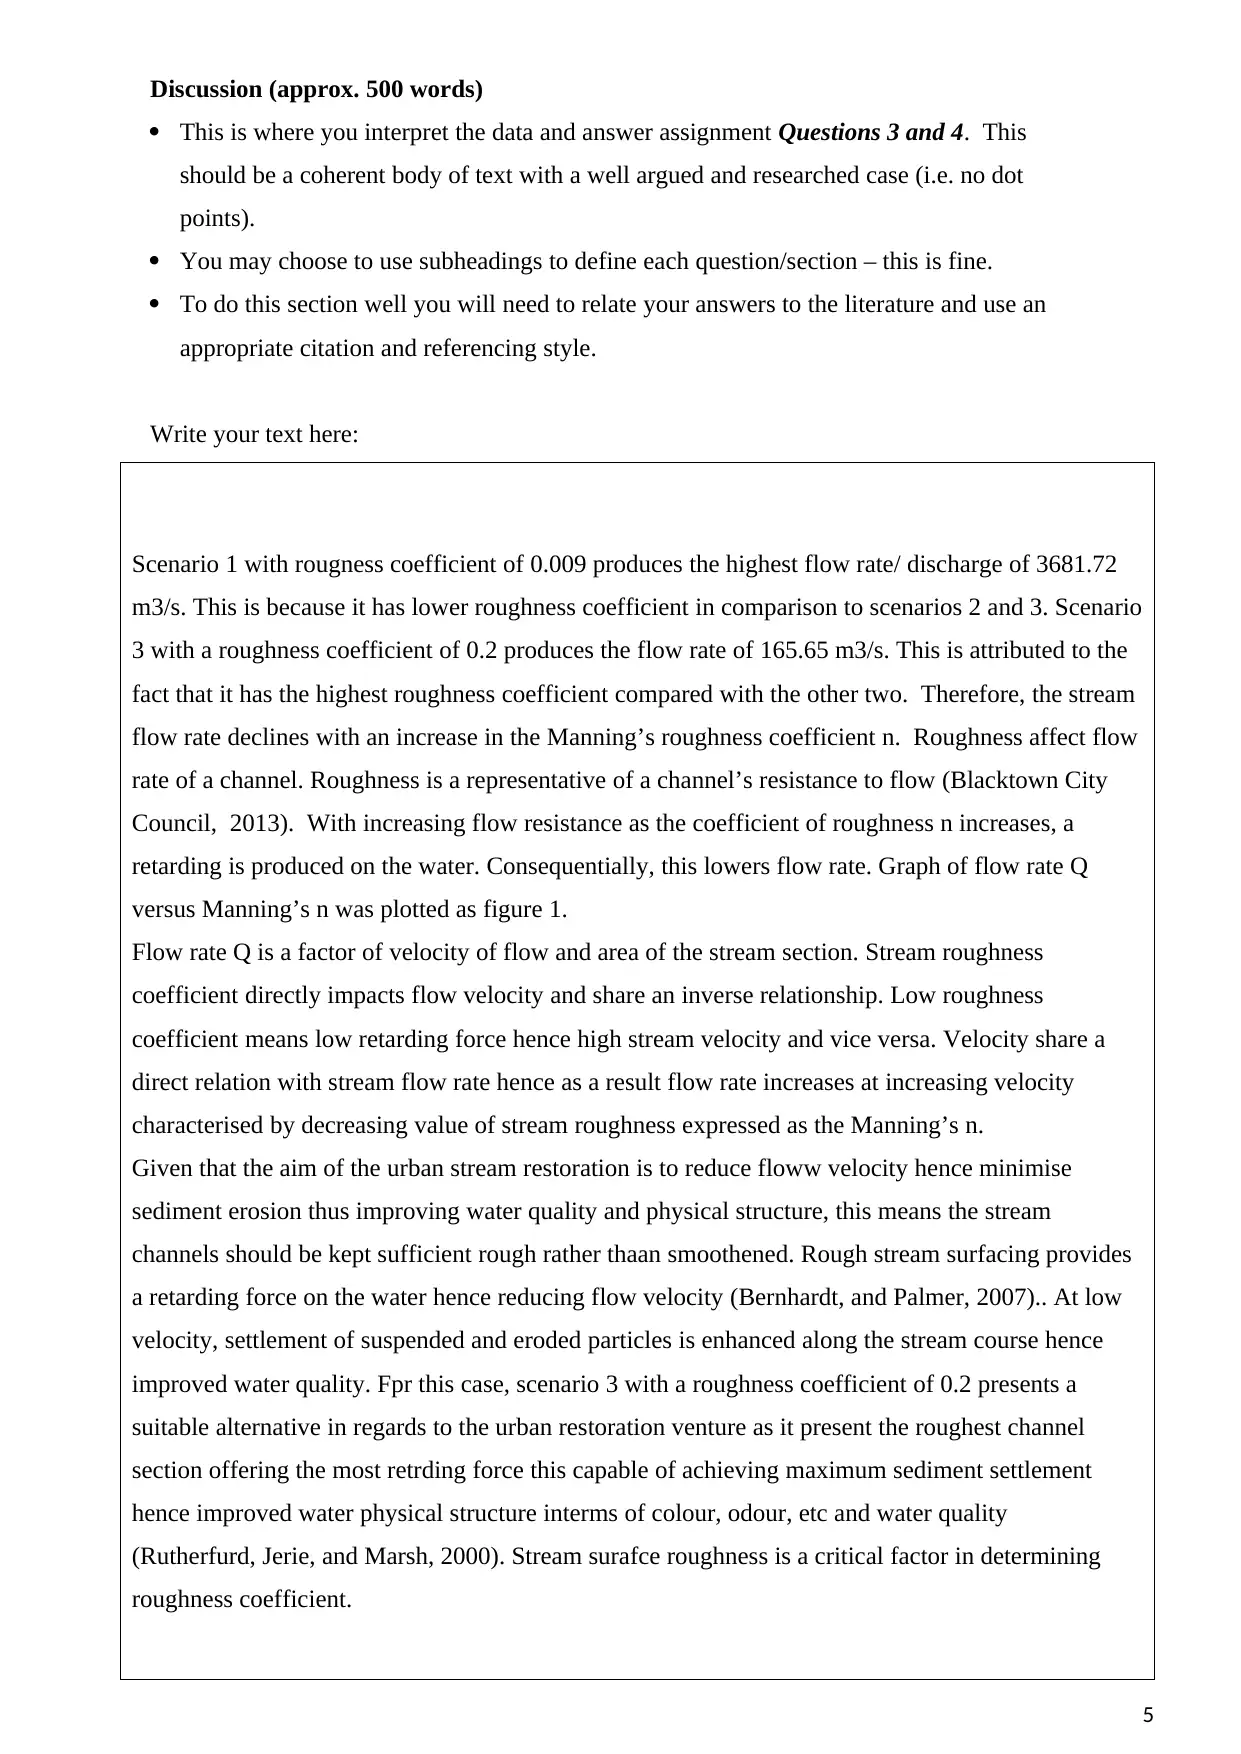
This scientific report examines the hydrology of urban streams, focusing on the impact of human activities on stream flow characteristics and the consequences for aquatic ecosystems. The introduction provides a literature review and defines key terms like urban hydrology, addressing assignment Question 1 by discussing the effects of development on stream flow and water quality. The methods section, pre-populated in the assignment template, outlines the process of surveying channel cross-sections and calculating bankfull discharge. The results section presents calculated values for flow velocity and discharge under different roughness scenarios, answering assignment Question 2 by describing the relationship between Manning's roughness coefficient and flow characteristics, supported by tables and figures. The discussion interprets the data, relating findings to existing literature and answering assignment Questions 3 and 4 by analyzing the impact of stream roughness on flow rates and the implications for urban stream restoration, emphasizing the importance of roughness for reducing flow velocity and improving water quality. The conclusion summarizes the findings, highlighting the challenges and limitations of urban stream restoration in improving water quality and downstream impacts. The report utilizes Harvard referencing style and includes at least ten scientific references.
Contribute Materials
Your contribution can guide someone’s learning journey. Share your
documents today.

ENVS1017/ENVS6202 Assignment 1 – Scientific Report Template
(Submit this document to TurnItIn)
Name:
Reminder: Do not change the font size or
formatting of this document in any way, just Student Number:
type your answers in the spaces provided.
This is the only document that will be marked.
Introduction (approx. 200 words)
Short literature review on the topic, using an appropriate referencing style.
You will need to define terms such as urban hydrology. Answer assignment Question 1 as
part of the introduction.
State the aims of the assignment.
Write your text here:
Stream flow characteristics are impacted by human activities and is a reflections of soil and
vegetataion types, human use, weather and climate consitions, and land characteristics. Human
activities such as increasing development and construction of roads, buildings, parking spaces
inevitably alter the timing and strength of runoff events consequencing “flashy” systems (Birch,
Lean, and Gunns, 2015).. This variation impacts the biotic diversity within the stream ecosysem by
influencing essential habitat consitions. During a storm, a portion of the rainfall evaporates while
some infiltrate into the ground (Rutherfurd, Jerie, and Marsh, 2000).. The rest flows as a thin layer
of flows over land surface otherwise termed as overland flow. For a critically impervios stratum, the
the infiltrated water moves laterally in the soil surface joining the stream flow. This flow is termed
as interflow or underflow or sub-surface flow (Chin, O’Dowd, and Gregory, 2013). This has a
bearing on flow rate and velocity of stream at given conditions. This generally defines flow
Methods (approx. 200 words)
This has been completed for you. You do not need to write or add anything to this section.
Methods sections set out how the experiments and research were conducted.
1
Secure Best Marks with AI Grader
Need help grading? Try our AI Grader for instant feedback on your assignments.

In the field we surveyed a channel cross-section perpendicular to the channel. Slope was
surveyed longitudinally along the top of the bank. We used an automatic level and staff for
these surveys. Levels were recorded to millimetre accuracy and our calculations checked
in the field. Slope was originally calculated using the rise over run method.
In the laboratory we calculated bankfull discharge for a range of different Manning’s n
roughness coefficients ranging from 0.009 to 0.2. These Manning’s n coefficients were
provided for us, but were originally derived using the component method.
We used the discharge equation as follows:
Q = V x A, where
Q = discharge (m 3
/s)
V = velocity (m/s)
A = cross-sectional area (m 2 )
Bankfull flow velocity was calculated using the following equation:
V = [(D 2/3
) x (S 1/2 ) ÷ n], where
V = mean channel velocity (m/s)
D = flow depth (m)
S = water surface slope (m/m; often approximated by the slope of the bed)
n = Manning's roughness coefficient
Cross-sectional area (A), bankfull channel depth and bankfull channel width were all
calculated from our processed cross-section.
Results (approx. 250 words)
This is where you transfer the answers to the calculations you completed in the section
‘Assignment data to use’ of the assignment instructions onto Figure 1, and into Tables 1
and 2.
Answer assignment Question 2 in the text box. You need to describe, in the text box, the
values you have calculated and any trends you see in the data. You need to cite your tables
and figures when describing the results.
If you wish supplement your results with additional figures or graphs, you can. An
additional box for these is provided. The good use of figures in the results sections of
scientific reports is often critical. Be imaginative! If you choose to include additional
figures or graphs make sure you add figure numbers and titles to them. However, you
should never put a figure or table into a report and then provide no description of what
they show in the text.
2

7.5
8.0
8.5
9.0
9.5
10.0
10.5
0 10 20 30 40 50 60 70
Height (m)
Distance (m)
Figure 1 Cross section across urban stream at Macquarie University
floodplainchannelfloodplain
Figure 1 Cross-section across an urban stream in a coastal catchment near Sydney.
Table 1 Hydrology of an urban stream in a coastal catchment near Sydney.
Channel slope (m/m) 0.006
Bankfull channel depth (m) 2.1
Bankfull channel width (m) 25
Bankfull channel cross-sectional area (m2) 49.3
Table 2 Roughness scenarios, flow velocity and discharge characteristics of an urban
stream in a coastal catchment near Sydney.
Manning's n roughness for scenario 1 (smooth stormwater pipe) 0.009
Manning's n roughness for scenario 2 (moderate in-channel
vegetation)
0.05
Manning's n roughness for scenario 3 (woody debris and dense in-
channel vegetation)
0.2
Bankfull flow velocity for scenario 1 74.68
Bankfull flow velocity for scenario 2 13.44
Bankfull flow velocity for scenario 3 3.36
Bankfull discharge for scenario 1 3681.72
Bankfull discharge for scenario 2 662.59
3

Bankfull discharge for scenario 3 165.65
Write your text here:
Surface roughness affects velocity of stream flow hence the discharge. From Scenario 1 with
roughness coefficeint of 0.009, a velocity of 74.68 m/s and discharge of 3681.72 m3/s is attained.
This the greatest values of the three scenarios. In Scenario 2, the roughness coefficient is 0.05 which
is higher than in the scnario 1 of 0.009. Based on this coefficient, flow velocity of 13.44 m/s and
discharge of 662.59 m3/s is deduced. This is a decline as compared to the first scenario. In Scenario
3, having the greatest value of roughness coefficient of the three scenario, the lowest flow velocity
and discharge is deduced. With a roughness coefficient of 0.2, flow velocity of 3.36 m/s and
discharge of 165.65 m3/s is attained. It can generally be noted that flow velocity and discharge
increases with decreasing roughness coefficient of an urban stream section and vice versa. This is
illustrated in figure 1.
Box to paste additional figures, if needed. Other than captions on your figures, do not add text to
this box – it will not be marked.
Manning's roughness coefficient flow velocity V m/s
discharge Q
m3/s
0.009 74.68 3681.72
0.05 13.44 662.59
0.2 3.36 165.65
The above are plotted as in figure 1 below:
4
Secure Best Marks with AI Grader
Need help grading? Try our AI Grader for instant feedback on your assignments.

Discussion (approx. 500 words)
This is where you interpret the data and answer assignment Questions 3 and 4. This
should be a coherent body of text with a well argued and researched case (i.e. no dot
points).
You may choose to use subheadings to define each question/section – this is fine.
To do this section well you will need to relate your answers to the literature and use an
appropriate citation and referencing style.
Write your text here:
Scenario 1 with rougness coefficient of 0.009 produces the highest flow rate/ discharge of 3681.72
m3/s. This is because it has lower roughness coefficient in comparison to scenarios 2 and 3. Scenario
3 with a roughness coefficient of 0.2 produces the flow rate of 165.65 m3/s. This is attributed to the
fact that it has the highest roughness coefficient compared with the other two. Therefore, the stream
flow rate declines with an increase in the Manning’s roughness coefficient n. Roughness affect flow
rate of a channel. Roughness is a representative of a channel’s resistance to flow (Blacktown City
Council, 2013). With increasing flow resistance as the coefficient of roughness n increases, a
retarding is produced on the water. Consequentially, this lowers flow rate. Graph of flow rate Q
versus Manning’s n was plotted as figure 1.
Flow rate Q is a factor of velocity of flow and area of the stream section. Stream roughness
coefficient directly impacts flow velocity and share an inverse relationship. Low roughness
coefficient means low retarding force hence high stream velocity and vice versa. Velocity share a
direct relation with stream flow rate hence as a result flow rate increases at increasing velocity
characterised by decreasing value of stream roughness expressed as the Manning’s n.
Given that the aim of the urban stream restoration is to reduce floww velocity hence minimise
sediment erosion thus improving water quality and physical structure, this means the stream
channels should be kept sufficient rough rather thaan smoothened. Rough stream surfacing provides
a retarding force on the water hence reducing flow velocity (Bernhardt, and Palmer, 2007).. At low
velocity, settlement of suspended and eroded particles is enhanced along the stream course hence
improved water quality. Fpr this case, scenario 3 with a roughness coefficient of 0.2 presents a
suitable alternative in regards to the urban restoration venture as it present the roughest channel
section offering the most retrding force this capable of achieving maximum sediment settlement
hence improved water physical structure interms of colour, odour, etc and water quality
(Rutherfurd, Jerie, and Marsh, 2000). Stream surafce roughness is a critical factor in determining
roughness coefficient.
5

Conclusion (approx. 100 words)
One paragraph summary of findings.
Write your text here:
Urban stream restortion is relevant initiative but unfortunately may not independently significantly
improve water quality and and the downstream impacts from urbanised coastal catchments. For
instance, with increased roughnesss coefficient and resultant settlement and deposition of eroded
matter and other suspended solids,the stream channel capacity may be significantly impacted when
constant removal of settled and deposited particles is not attained (Ladson, 2004). This consequently
reduces the stream cross section which is an important parameter for flow rate and hence flow
Reference list (no set length)
Set out in Harvard referencing style.
At least 10 scientific references should be used in your assignment, including Chin et al.
(2013) and Birch et al. (2015).
Write your text here
6

Bernhardt, E.S. and Palmer, M.A. (2007). Restoring streams in an urbanized world. Freshwater
Biology, 52, 738-751.
Birch, G.F., Lean, J. and Gunns, T. (2015). Historic change in catchment land use and metal
loading to Sydney estuary, Australia (1788–2010). Environmental Monitoring and Assessment,
187:594.
Birch, G.F. and McCready, S. (2009). Catchment condition as a major control on the quality of
receiving basin sediments (Sydney Harbour, Australia). Science of the Total Environment, 407,
2820-2835.
Blacktown City Council. (2013). Developer handbook for water sensitive urban design.
Available online: https://www.sydneycoastalcouncils.com.au/wpcontent/uploads/2018/09/
v11_DEVELOPER_HANDBOOK_FOR_WSUD-1-1.pdf
Chin, A., O’Dowd. A.P. and Gregory, K.J. (2013). Urbanization and river channels. In Schroder,
L. and Wohl, E., (Eds.). Treatise on Geomorphology. Academic Press, San Diego, CA. vol. 9
Fluvial Geomorphology, pp. 809-827.
Ladson, A. (2004). Optimising Urban Stream Rehabilitation and Execution. Technical Report
04/7. Cooperative Research Centre for Catchment Hydrology, Melbourne, Victoria, Australia.
43pp.
Rutherfurd, I.D., Jerie, K. and Marsh, N. (2000). A Rehabilitation Manual for Australian Streams,
Volumes 1 and 2. Cooperative Research Centre for Catchment Hydrology, and the Land and
Water Resources Research and Development Corporation, Canberra. Available at
https://arrc.com.au/wp-content/uploads/2018/08/A-Rehabilitation-Manual-for-
AustralianStreams-Vol1.pdf
https://www.engr.colostate.edu/~bbledsoe/CIVE413/Rehabilitation_Manual_for_Australian_Stre
7
1 out of 7

Your All-in-One AI-Powered Toolkit for Academic Success.
+13062052269
info@desklib.com
Available 24*7 on WhatsApp / Email
Unlock your academic potential
© 2024 | Zucol Services PVT LTD | All rights reserved.