Comparative Economic Analysis: US and Australia (2012-2016)
VerifiedAdded on 2020/05/16
|12
|2140
|249
AI Summary
The research compares the economic conditions of the United States and Australia from 2012 to 2016. Over this period, both nations experienced expansionary stages within their respective business cycles, characterized by steady economic growth. The US demonstrated a higher GDP, indicating stronger overall economic performance compared to Australia. However, when examining productivity through GDP per capita, Australia surpassed the US. This suggests that while the American economy grew more significantly in absolute terms, Australians were able to achieve greater output on a per-person basis. Both countries utilized fiscal and monetary policies effectively during this period to sustain growth and navigate their business cycles towards expansion peaks. Ultimately, despite Australia's higher productivity levels, the broader economic indicators suggest slightly superior economic health for the US within this timeframe.
Running head: ECONOMICS AND INTERNATIONAL TRADE
ECONOMICS AND INTERNATIONAL TRADE
Name of the Student
Name of the University
Author’s Note
ECONOMICS AND INTERNATIONAL TRADE
Name of the Student
Name of the University
Author’s Note
Paraphrase This Document
Need a fresh take? Get an instant paraphrase of this document with our AI Paraphraser
1ECONOMICS AND INTERNATIONAL TRADE
Table of contents
Introduction......................................................................................................................................3
GDP, GDP Per capita and economic growth rate of Australia and US during 2012-2016.............3
Economic growth.........................................................................................................................3
GDP.............................................................................................................................................4
GDP Per Capita............................................................................................................................6
Production possibility Frontier....................................................................................................8
GDP accounting methods............................................................................................................9
Business cycles............................................................................................................................9
Conclusion.....................................................................................................................................10
Reference.......................................................................................................................................11
2ECONOMICS AND INTERNATIONAL TRADE
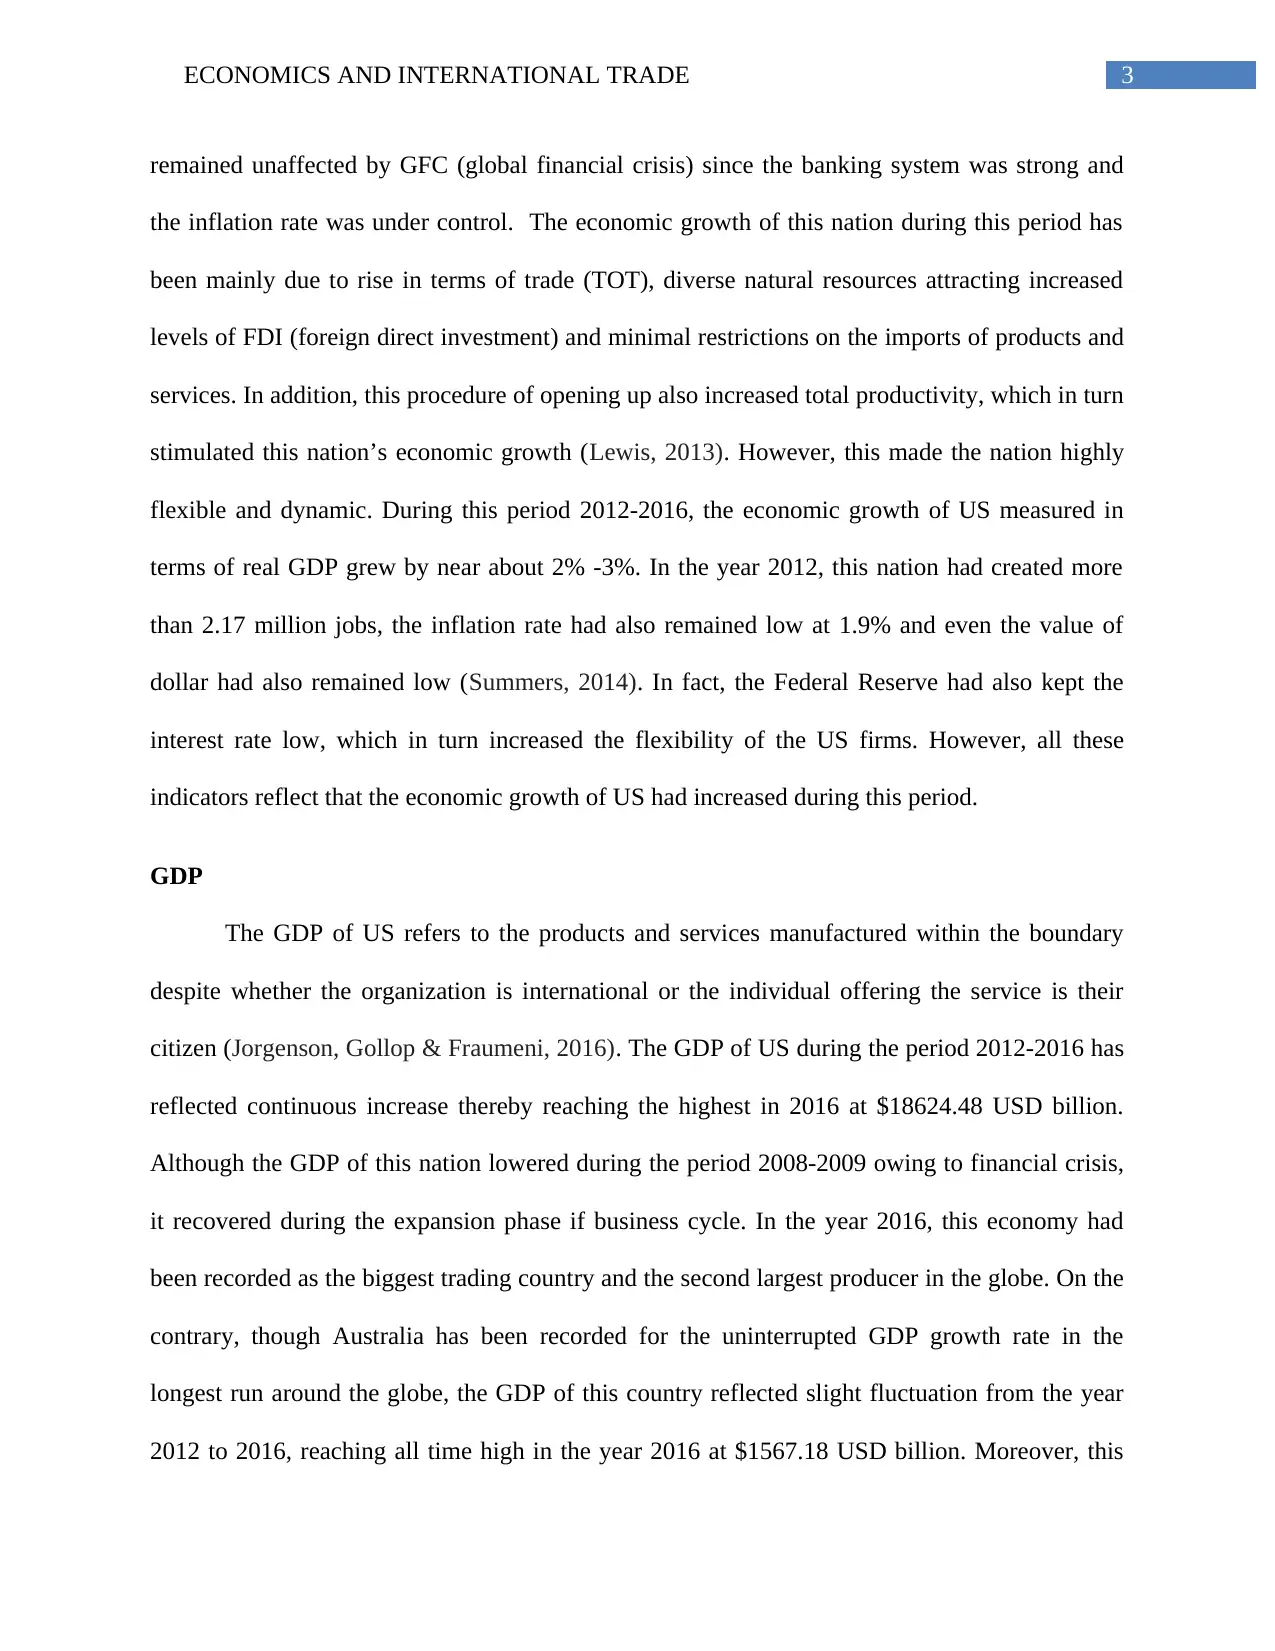
Introduction
The present report provides an overview about the comparison of GDP, GDP per capita
and economic growth between the two countries. The two countries selected for this study are
Australia and US. Gross domestic product (GDP) refers to the monetary value of the final
products and services that is produced within the geographical boundary of the nation for the
specific time period. GDP has huge significance as it is considered as one of the vital indicators
of economic performance and standard of living of a particular nation (Gillespie, 2014). The
GDP of a country fluctuates owing to business cycle while various macroeconomic indicators
including inflation rate, unemployment rate varies owing to fluctuation in GDP growth rate.
Economic growth indicates rise in inflation adjusted value of products and service manufactured
by the nation and is conventionally measured in terms of real GDP. Moreover, economic growth
rate of the country is basically compared using ratio of GDP to the per capita income. The
differences and similarities between these selected nations have been analyzed in this report
using PPF (Production Possibility Frontier) concept, GDP accounting method and the business
cycles.
GDP, GDP Per capita and economic growth rate of Australia and US during 2012-2016
Economic growth
The economy of Australia has experienced unremitting growth and featured with low
inflation as well as unemployment rate, low public debt and stable financial system during the
year 2012-2016. During this period, this nation had experienced high economic growth with
respect to the last 20 years and hence has been averaged to 3.5% per year. This nation had
⊘ This is a preview!⊘
Do you want full access?
Subscribe today to unlock all pages.
Trusted by 1+ million students worldwide
3ECONOMICS AND INTERNATIONAL TRADE
remained unaffected by GFC (global financial crisis) since the banking system was strong and
the inflation rate was under control. The economic growth of this nation during this period has
been mainly due to rise in terms of trade (TOT), diverse natural resources attracting increased
levels of FDI (foreign direct investment) and minimal restrictions on the imports of products and
services. In addition, this procedure of opening up also increased total productivity, which in turn
stimulated this nation’s economic growth (Lewis, 2013). However, this made the nation highly
flexible and dynamic. During this period 2012-2016, the economic growth of US measured in
terms of real GDP grew by near about 2% -3%. In the year 2012, this nation had created more
than 2.17 million jobs, the inflation rate had also remained low at 1.9% and even the value of
dollar had also remained low (Summers, 2014). In fact, the Federal Reserve had also kept the
interest rate low, which in turn increased the flexibility of the US firms. However, all these
indicators reflect that the economic growth of US had increased during this period.
GDP
The GDP of US refers to the products and services manufactured within the boundary
despite whether the organization is international or the individual offering the service is their
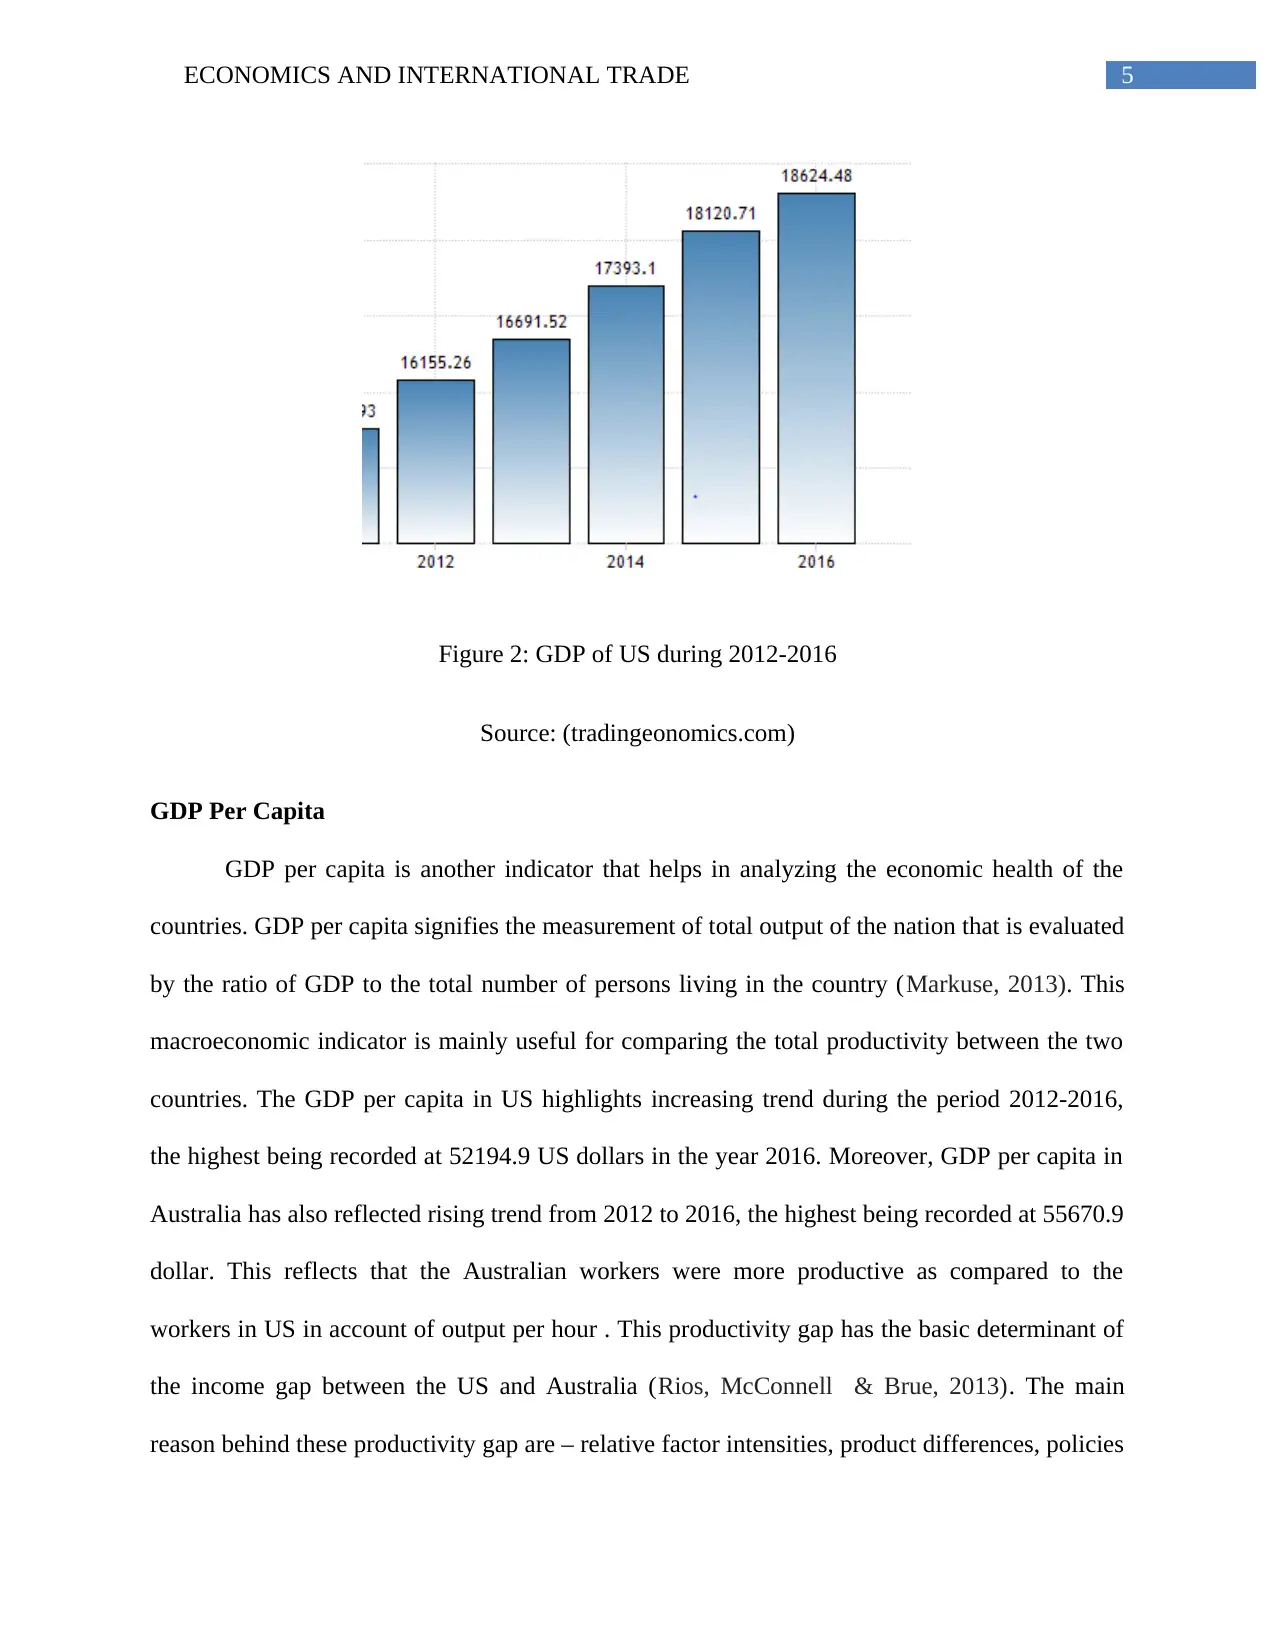
citizen (Jorgenson, Gollop & Fraumeni, 2016). The GDP of US during the period 2012-2016 has
reflected continuous increase thereby reaching the highest in 2016 at $18624.48 USD billion.
Although the GDP of this nation lowered during the period 2008-2009 owing to financial crisis,
it recovered during the expansion phase if business cycle. In the year 2016, this economy had
been recorded as the biggest trading country and the second largest producer in the globe. On the
contrary, though Australia has been recorded for the uninterrupted GDP growth rate in the
longest run around the globe, the GDP of this country reflected slight fluctuation from the year
2012 to 2016, reaching all time high in the year 2016 at $1567.18 USD billion. Moreover, this
remained unaffected by GFC (global financial crisis) since the banking system was strong and
the inflation rate was under control. The economic growth of this nation during this period has
been mainly due to rise in terms of trade (TOT), diverse natural resources attracting increased
levels of FDI (foreign direct investment) and minimal restrictions on the imports of products and
services. In addition, this procedure of opening up also increased total productivity, which in turn
stimulated this nation’s economic growth (Lewis, 2013). However, this made the nation highly
flexible and dynamic. During this period 2012-2016, the economic growth of US measured in
terms of real GDP grew by near about 2% -3%. In the year 2012, this nation had created more
than 2.17 million jobs, the inflation rate had also remained low at 1.9% and even the value of
dollar had also remained low (Summers, 2014). In fact, the Federal Reserve had also kept the
interest rate low, which in turn increased the flexibility of the US firms. However, all these
indicators reflect that the economic growth of US had increased during this period.
GDP
The GDP of US refers to the products and services manufactured within the boundary
despite whether the organization is international or the individual offering the service is their
citizen (Jorgenson, Gollop & Fraumeni, 2016). The GDP of US during the period 2012-2016 has
reflected continuous increase thereby reaching the highest in 2016 at $18624.48 USD billion.
Although the GDP of this nation lowered during the period 2008-2009 owing to financial crisis,
it recovered during the expansion phase if business cycle. In the year 2016, this economy had
been recorded as the biggest trading country and the second largest producer in the globe. On the
contrary, though Australia has been recorded for the uninterrupted GDP growth rate in the
longest run around the globe, the GDP of this country reflected slight fluctuation from the year
2012 to 2016, reaching all time high in the year 2016 at $1567.18 USD billion. Moreover, this
Paraphrase This Document
Need a fresh take? Get an instant paraphrase of this document with our AI Paraphraser
4ECONOMICS AND INTERNATIONAL TRADE
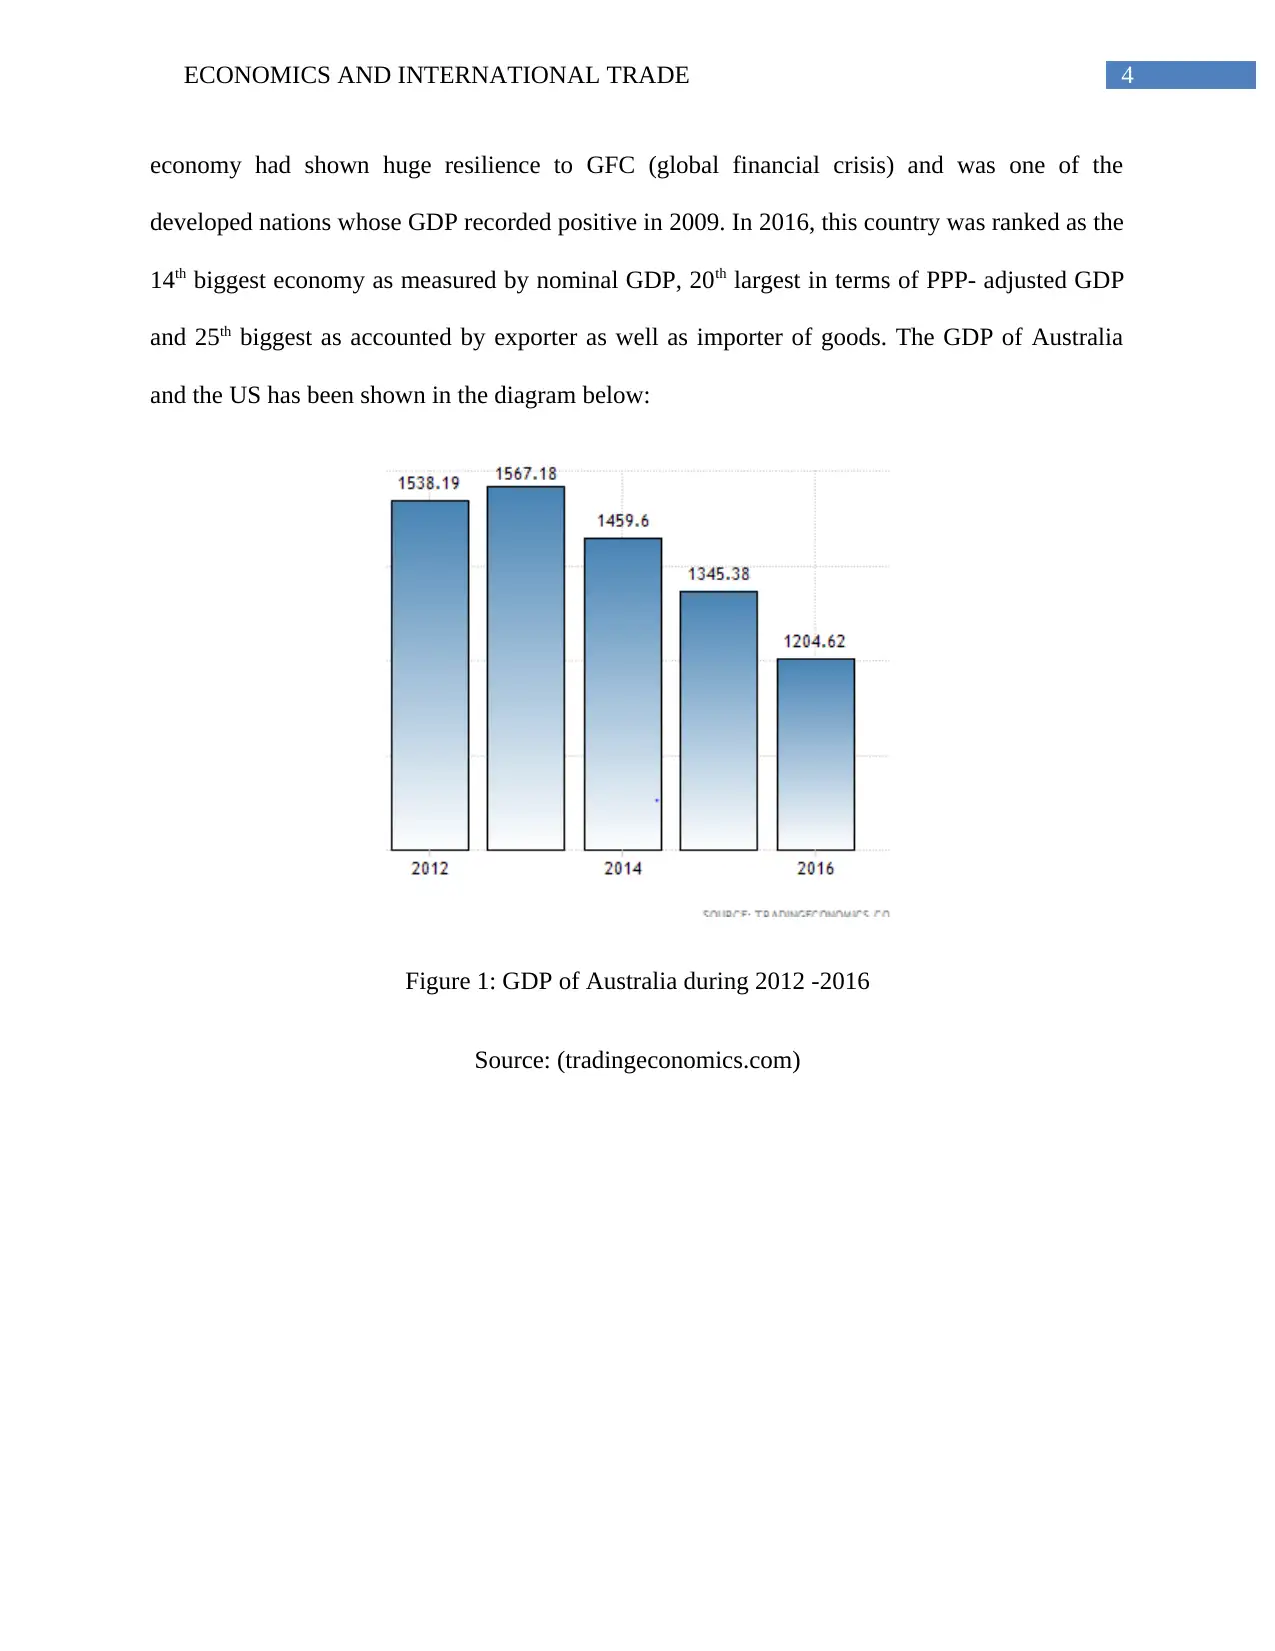
economy had shown huge resilience to GFC (global financial crisis) and was one of the
developed nations whose GDP recorded positive in 2009. In 2016, this country was ranked as the
14th biggest economy as measured by nominal GDP, 20th largest in terms of PPP- adjusted GDP
and 25th biggest as accounted by exporter as well as importer of goods. The GDP of Australia
and the US has been shown in the diagram below:
Figure 1: GDP of Australia during 2012 -2016
Source: (tradingeconomics.com)
5ECONOMICS AND INTERNATIONAL TRADE
Figure 2: GDP of US during 2012-2016
Source: (tradingeonomics.com)
GDP Per Capita
GDP per capita is another indicator that helps in analyzing the economic health of the
countries. GDP per capita signifies the measurement of total output of the nation that is evaluated
by the ratio of GDP to the total number of persons living in the country (Markuse, 2013). This
macroeconomic indicator is mainly useful for comparing the total productivity between the two
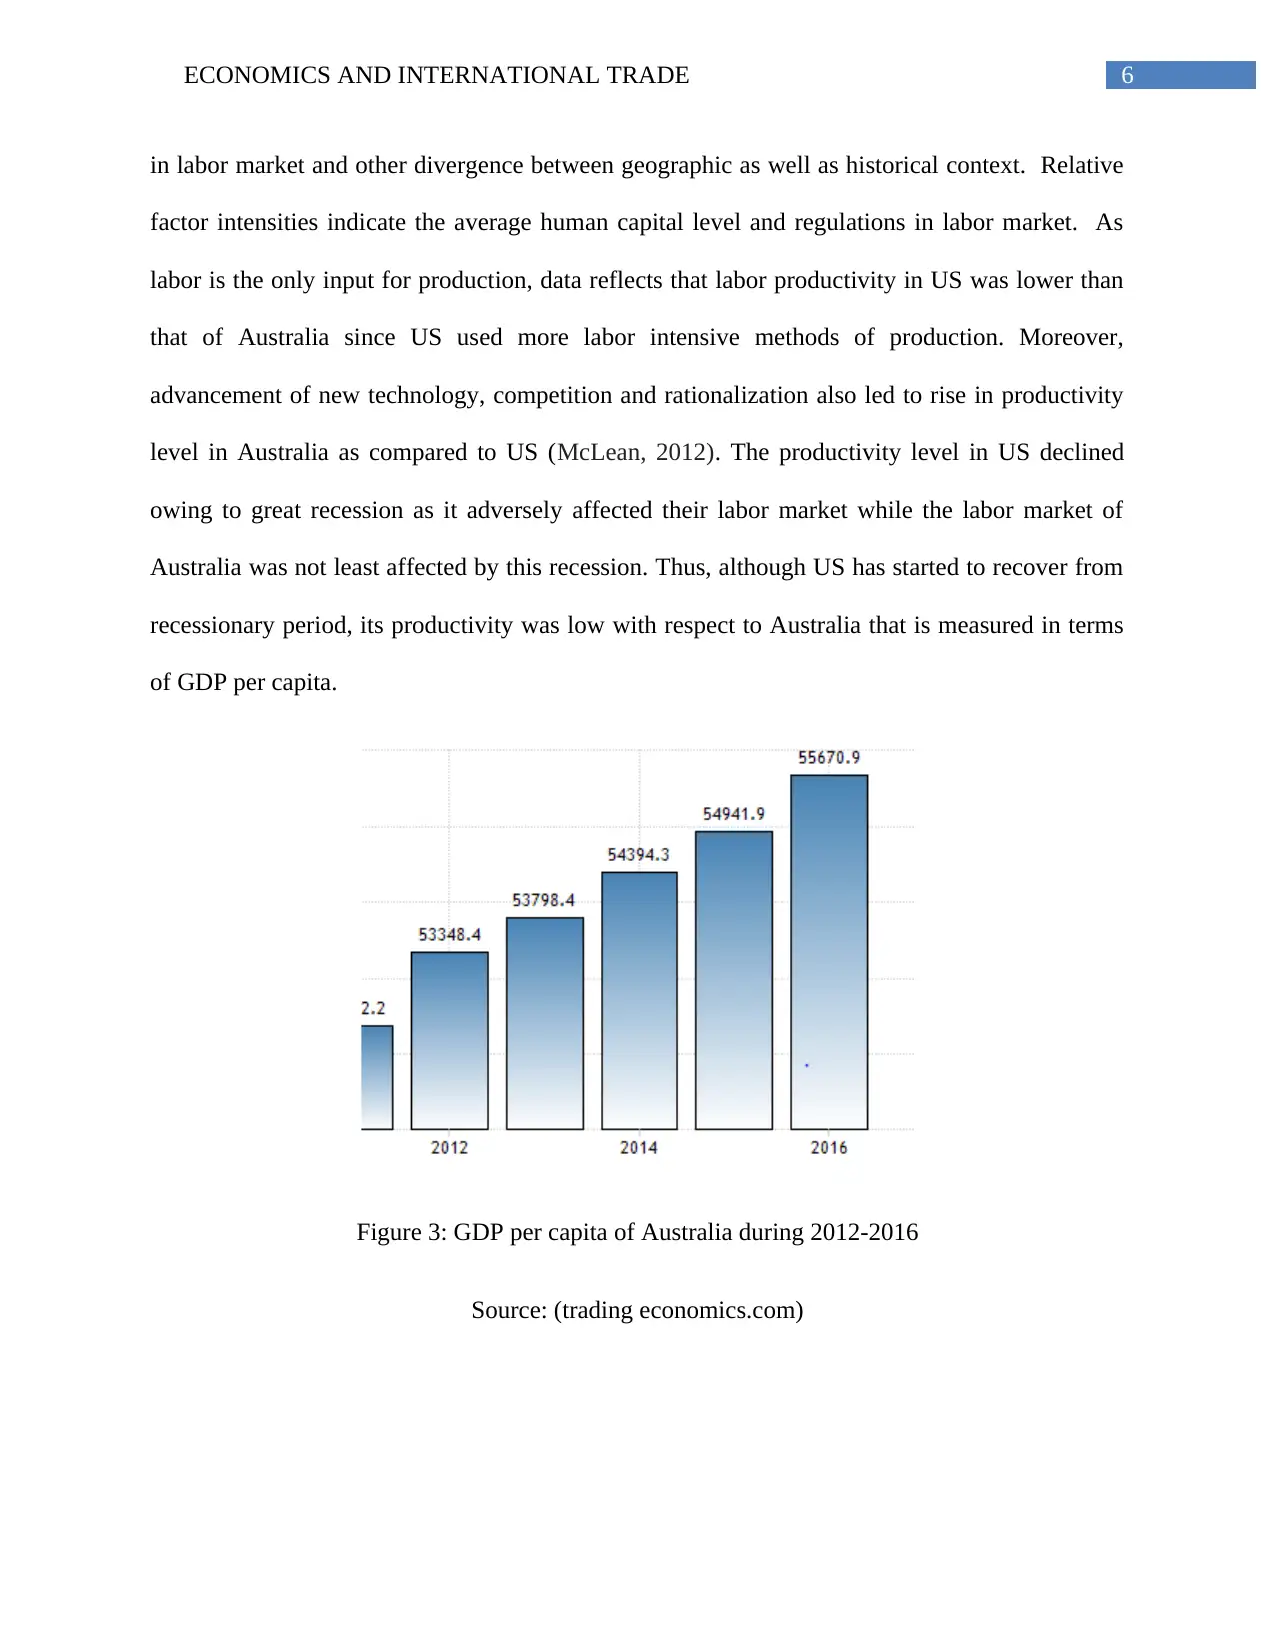
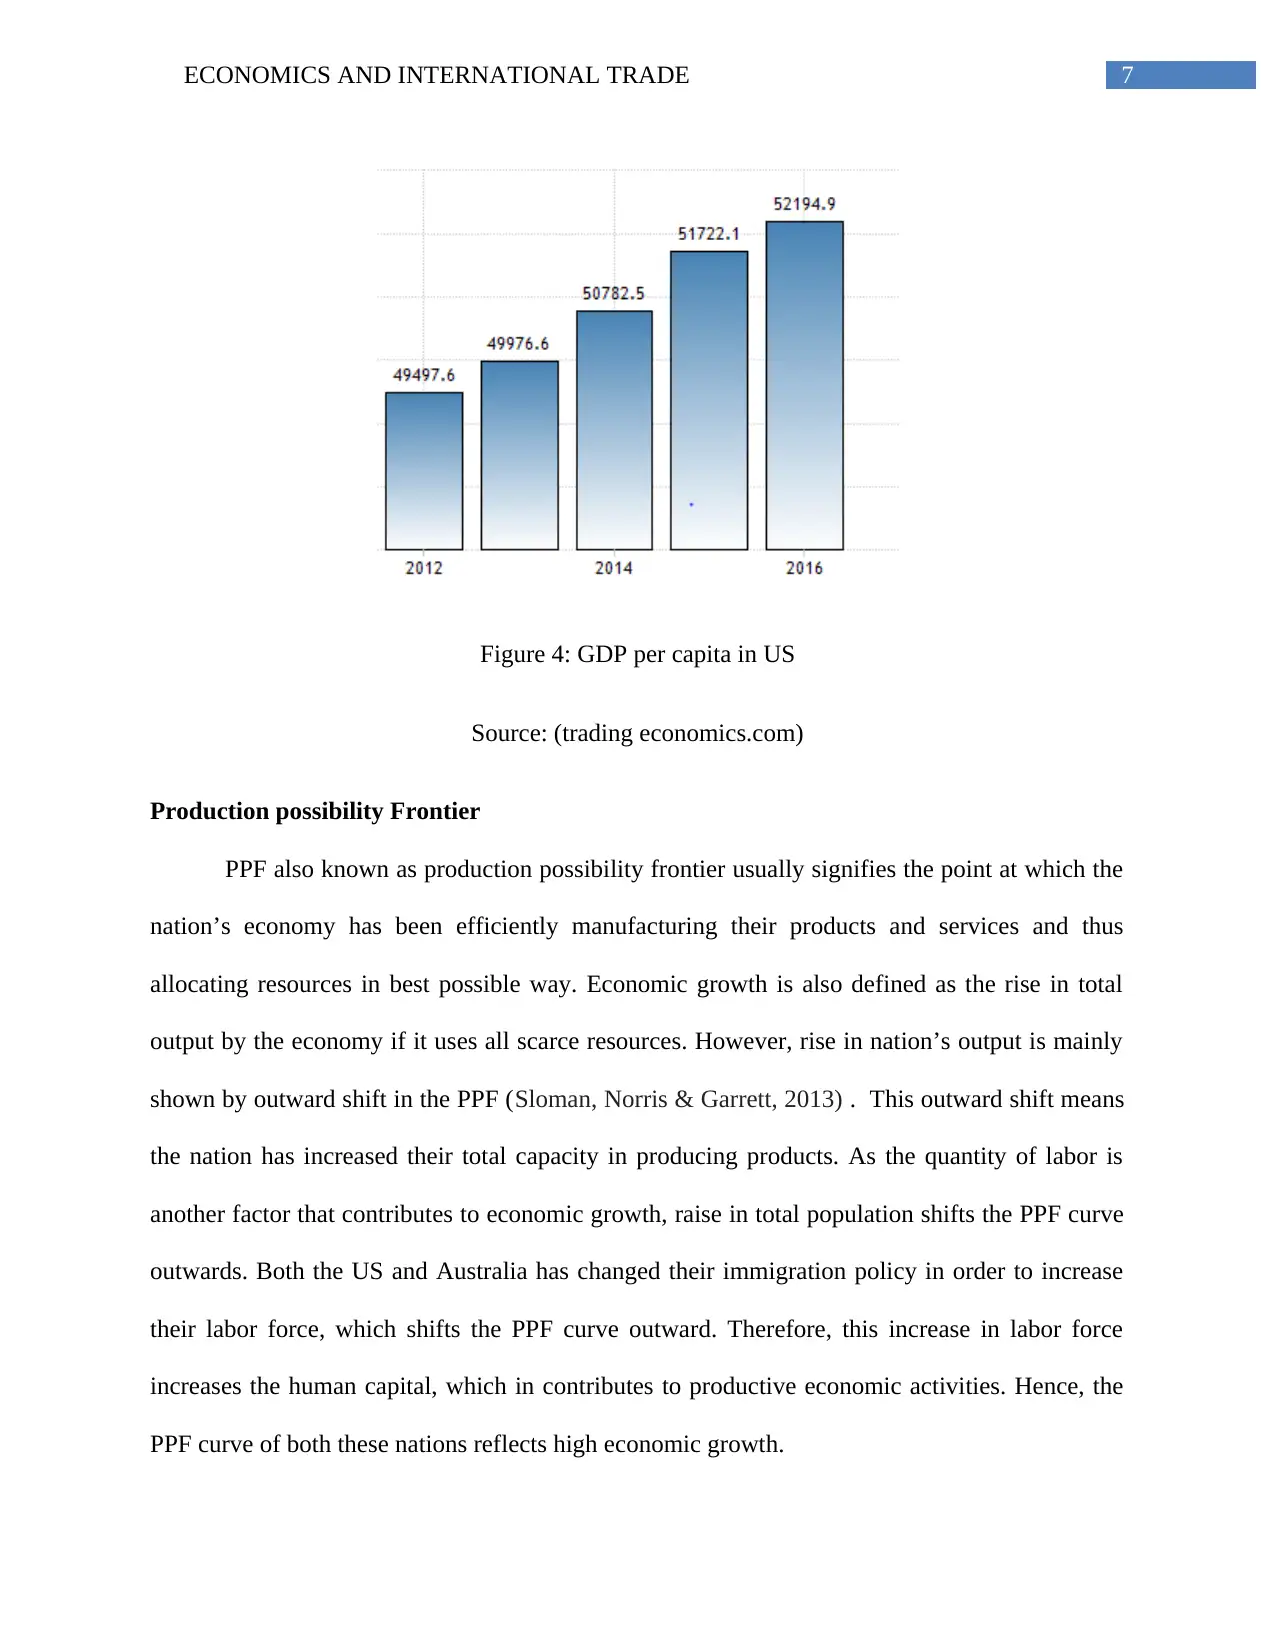
countries. The GDP per capita in US highlights increasing trend during the period 2012-2016,
the highest being recorded at 52194.9 US dollars in the year 2016. Moreover, GDP per capita in
Australia has also reflected rising trend from 2012 to 2016, the highest being recorded at 55670.9
dollar. This reflects that the Australian workers were more productive as compared to the
workers in US in account of output per hour . This productivity gap has the basic determinant of
the income gap between the US and Australia (Rios, McConnell & Brue, 2013). The main
reason behind these productivity gap are – relative factor intensities, product differences, policies
Figure 2: GDP of US during 2012-2016
Source: (tradingeonomics.com)
GDP Per Capita
GDP per capita is another indicator that helps in analyzing the economic health of the
countries. GDP per capita signifies the measurement of total output of the nation that is evaluated
by the ratio of GDP to the total number of persons living in the country (Markuse, 2013). This
macroeconomic indicator is mainly useful for comparing the total productivity between the two
countries. The GDP per capita in US highlights increasing trend during the period 2012-2016,
the highest being recorded at 52194.9 US dollars in the year 2016. Moreover, GDP per capita in
Australia has also reflected rising trend from 2012 to 2016, the highest being recorded at 55670.9
dollar. This reflects that the Australian workers were more productive as compared to the
workers in US in account of output per hour . This productivity gap has the basic determinant of
the income gap between the US and Australia (Rios, McConnell & Brue, 2013). The main
reason behind these productivity gap are – relative factor intensities, product differences, policies
⊘ This is a preview!⊘
Do you want full access?
Subscribe today to unlock all pages.
Trusted by 1+ million students worldwide
6ECONOMICS AND INTERNATIONAL TRADE
in labor market and other divergence between geographic as well as historical context. Relative
factor intensities indicate the average human capital level and regulations in labor market. As
labor is the only input for production, data reflects that labor productivity in US was lower than
that of Australia since US used more labor intensive methods of production. Moreover,
advancement of new technology, competition and rationalization also led to rise in productivity
level in Australia as compared to US (McLean, 2012). The productivity level in US declined
owing to great recession as it adversely affected their labor market while the labor market of
Australia was not least affected by this recession. Thus, although US has started to recover from
recessionary period, its productivity was low with respect to Australia that is measured in terms
of GDP per capita.
Figure 3: GDP per capita of Australia during 2012-2016
Source: (trading economics.com)
Paraphrase This Document
Need a fresh take? Get an instant paraphrase of this document with our AI Paraphraser
7ECONOMICS AND INTERNATIONAL TRADE
Figure 4: GDP per capita in US
Source: (trading economics.com)
Production possibility Frontier
PPF also known as production possibility frontier usually signifies the point at which the
nation’s economy has been efficiently manufacturing their products and services and thus
allocating resources in best possible way. Economic growth is also defined as the rise in total
output by the economy if it uses all scarce resources. However, rise in nation’s output is mainly
shown by outward shift in the PPF (Sloman, Norris & Garrett, 2013) . This outward shift means
the nation has increased their total capacity in producing products. As the quantity of labor is
another factor that contributes to economic growth, raise in total population shifts the PPF curve
outwards. Both the US and Australia has changed their immigration policy in order to increase
their labor force, which shifts the PPF curve outward. Therefore, this increase in labor force
increases the human capital, which in contributes to productive economic activities. Hence, the
PPF curve of both these nations reflects high economic growth.
8ECONOMICS AND INTERNATIONAL TRADE
GDP accounting methods
There three various ways of accounting GDP, which includes- income approach,
production approach and expenditure approach. In case of Australia, income, production and
expenditure estimates are usually integrated within the annual balanced supply. The reason for
using national accounts is to provide time series of production aggregates as well as expenditure
that are free of impact of price change (Taussig, 2013). The ABS ( Australian Bureau of
Statistics) derived estimation of constant price as means of estimating variation in volume of
aggregates. Moreover, they also measure the GDP value in every period by applying equal unit
prices. On the other hand, in US the most important method used in estimating GDP is the
expenditure method. In this method, the GDP is calculated by the summation of total
consumption, government expenditure, investment and net exports.
Business cycles
Business cycle also known as economic cycle refers to the downward as well as upward
movement of GDP around their long term trend in growth. It is usually measured by taking into
account real GDP growth rate. There are mainly five phases if business cycle such as- expansion,
peak, recession, trough and recovery (Galí, 2015). In expansion phase, the economy grows at
increasing rate. At peak, the economy increases more than 3%. At recession, the economy slows
down but does not become negative. At Trough, the economic moves into recession and at last in
recovery stage the economy again increases. The government of the respective nation manages
the business cycle. The policymakers of these two nations implements fiscal as well as monetary
policies for influencing the economy. During this period 2012-2016, both the US and the
Australian economy existed in expansion phase, where the economy grows at stable rate.
⊘ This is a preview!⊘
Do you want full access?
Subscribe today to unlock all pages.
Trusted by 1+ million students worldwide
9ECONOMICS AND INTERNATIONAL TRADE
Conclusion
The above report reflects that the US economy has slightly better economic health as
compared to the Australia during this period 2012-2016. Although the GDP and economic
growth of US reflects better economic performance than Australia during this period, the GDP
per capita highlights that Australia had higher productivity than US. Overall, both these
economies are prevailing at expansionary stage of business cycle and are moving towards peak.
Paraphrase This Document
Need a fresh take? Get an instant paraphrase of this document with our AI Paraphraser
10ECONOMICS AND INTERNATIONAL TRADE
Reference
Australia GDP | 1960-2018 | Data | Chart | Calendar | Forecast | News.
(2018). Tradingeconomics.com. Retrieved 23 January 2018, from
https://tradingeconomics.com/australia/gdp
Galí, J. (2015). Monetary policy, inflation, and the business cycle: an introduction to the new
Keynesian framework and its applications. Princeton University Press.
Gillespie, A. (2014). Foundations of economics. Oxford University Press, USA.
Jorgenson, D., Gollop, F. M., & Fraumeni, B. (2016). Productivity and US economic
growth (Vol. 169). Elsevier.
Lewis, W. A. (2013). Theory of economic growth (Vol. 7). Routledge.
Markusen, J. R. (2013). Putting per-capita income back into trade theory. Journal of
International Economics, 90(2), 255-265.
McLean, I. W. (2012). Why Australia prospered: The shifting sources of economic growth.
Princeton University Press.
Rios, M. C., McConnell, C. R., & Brue, S. L. (2013). Economics: Principles, problems, and
policies. McGraw-Hill.
Sloman, J., Norris, K., & Garrett, D. (2013). Principles of economics. Pearson Higher Education
AU.
11ECONOMICS AND INTERNATIONAL TRADE
Summers, L. H. (2014). US economic prospects: Secular stagnation, hysteresis, and the zero
lower bound. Business Economics, 49(2), 65-73.
Taussig, F. W. (2013). Principles of economics (Vol. 2). Cosimo, Inc..
United States GDP | 1960-2018 | Data | Chart | Calendar | Forecast | News.
(2018). Tradingeconomics.com. Retrieved 23 January 2018, from
https://tradingeconomics.com/united-states/gdp
⊘ This is a preview!⊘
Do you want full access?
Subscribe today to unlock all pages.
Trusted by 1+ million students worldwide
1 out of 12
Related Documents


Your All-in-One AI-Powered Toolkit for Academic Success.
+13062052269
info@desklib.com
Available 24*7 on WhatsApp / Email
![[object Object]](/_next/static/media/star-bottom.7253800d.svg)
Unlock your academic potential
Copyright © 2020–2026 A2Z Services. All Rights Reserved. Developed and managed by ZUCOL.