Healthcare Report: US Elderly Population Data Analysis and Trends

Verified

Added on  2022/08/15

|8
|1080
|12
Report
AI Summary
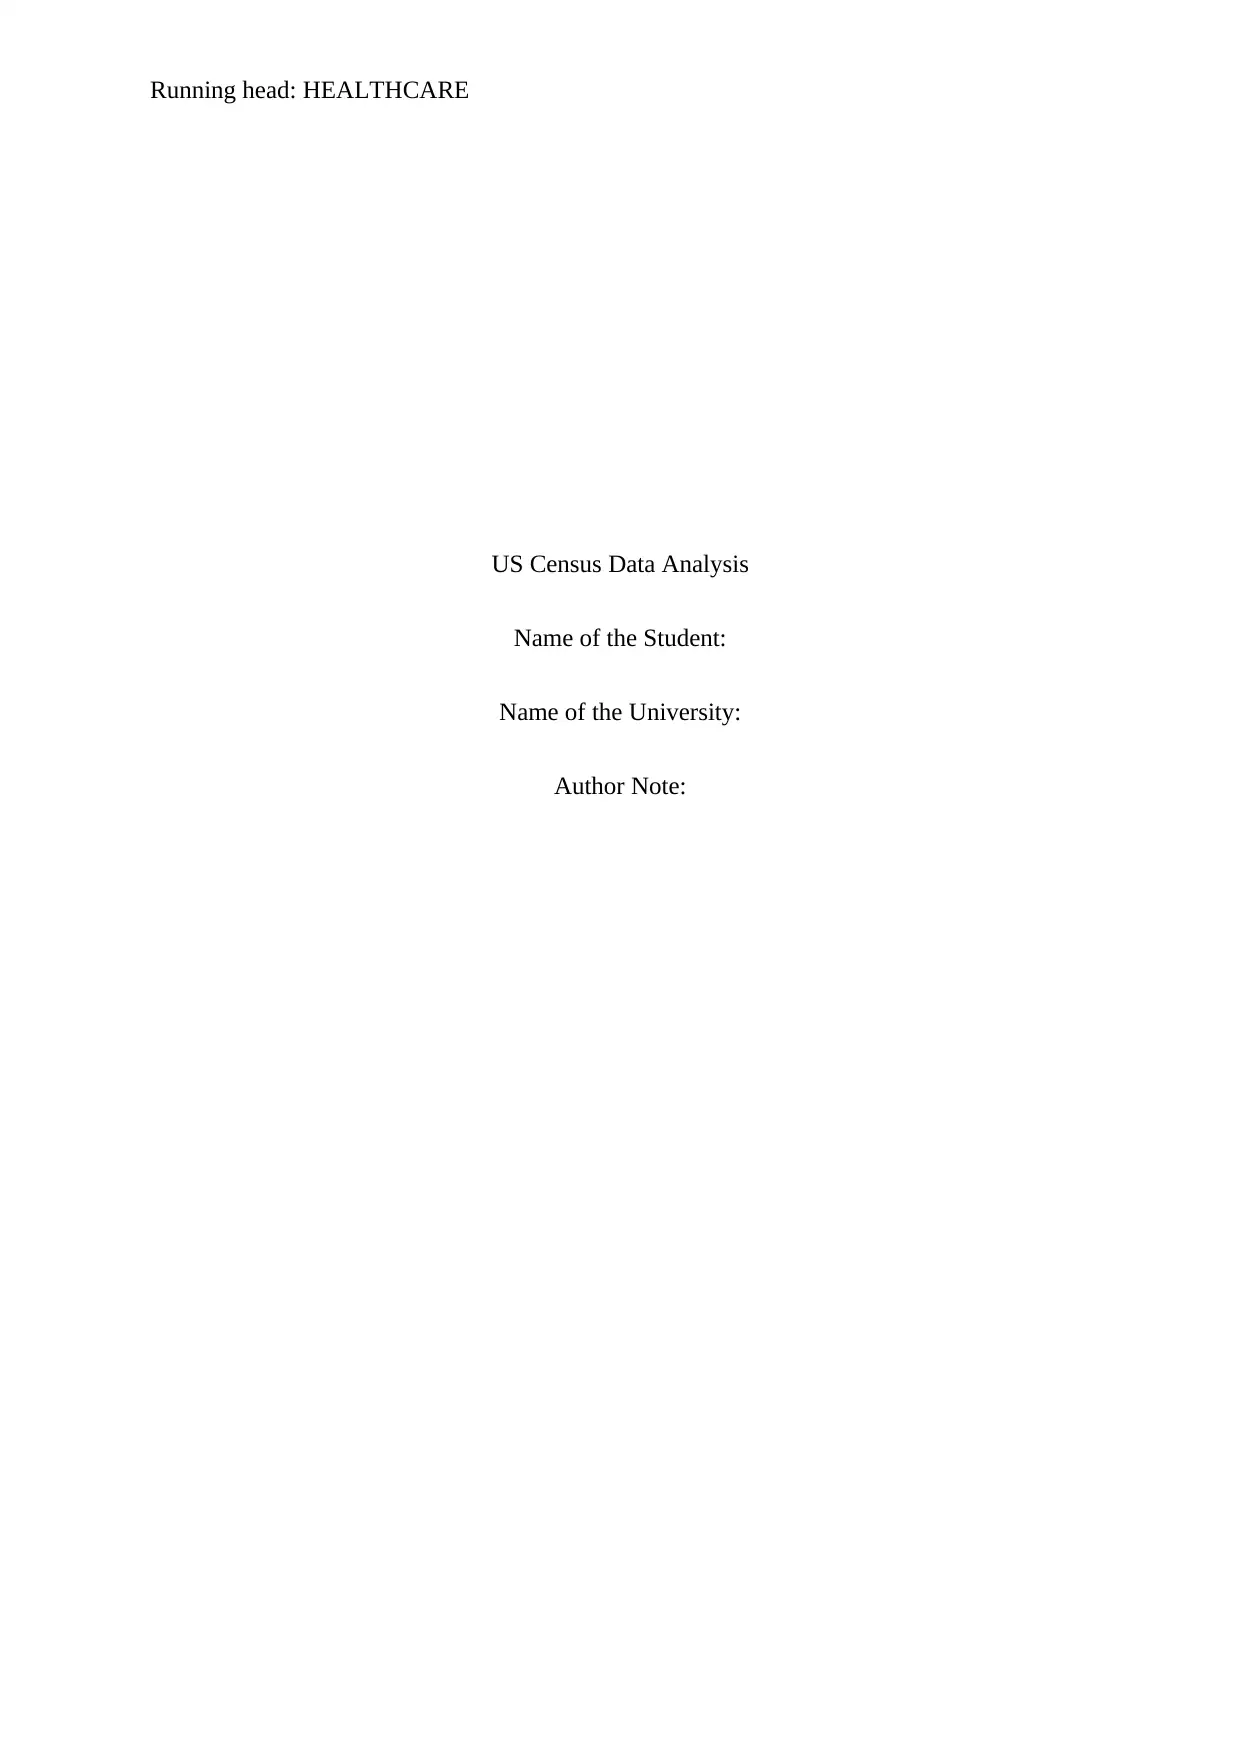
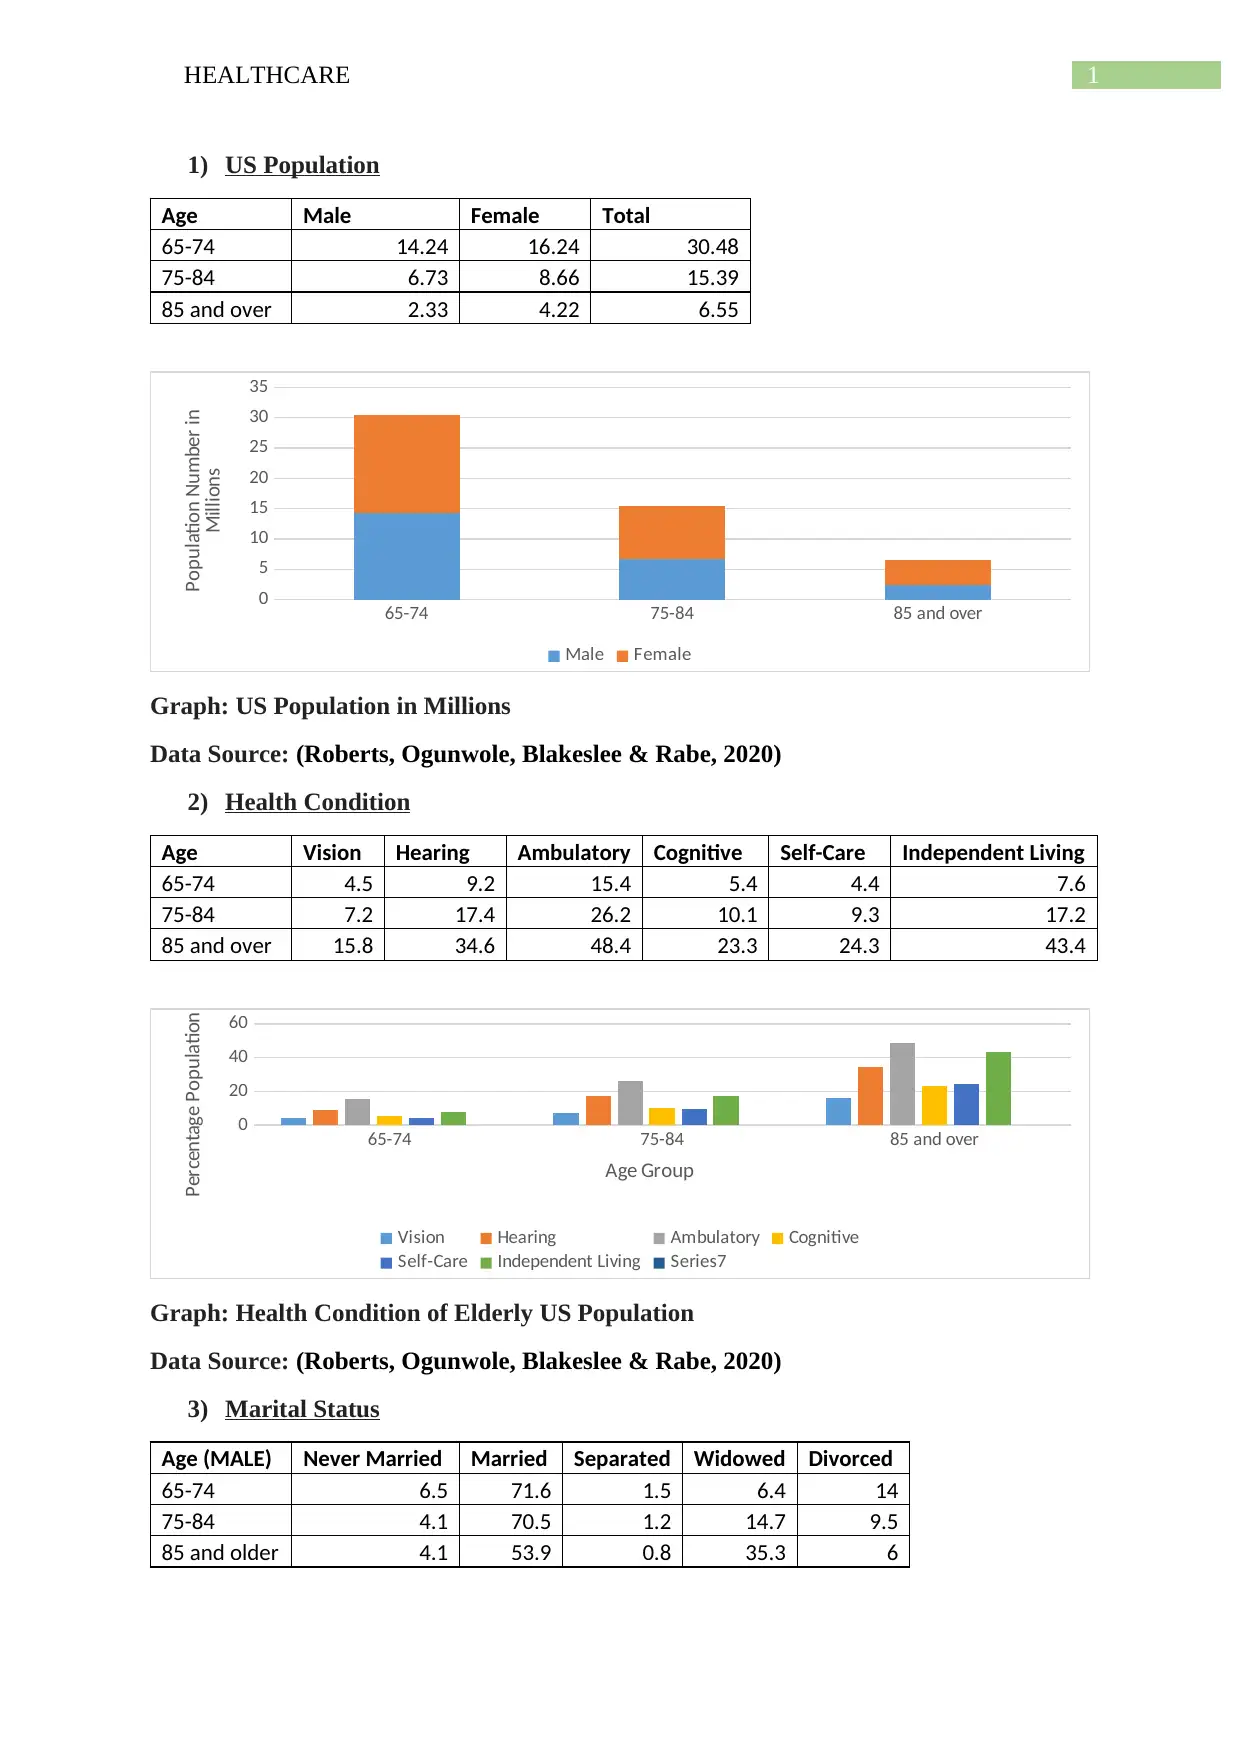
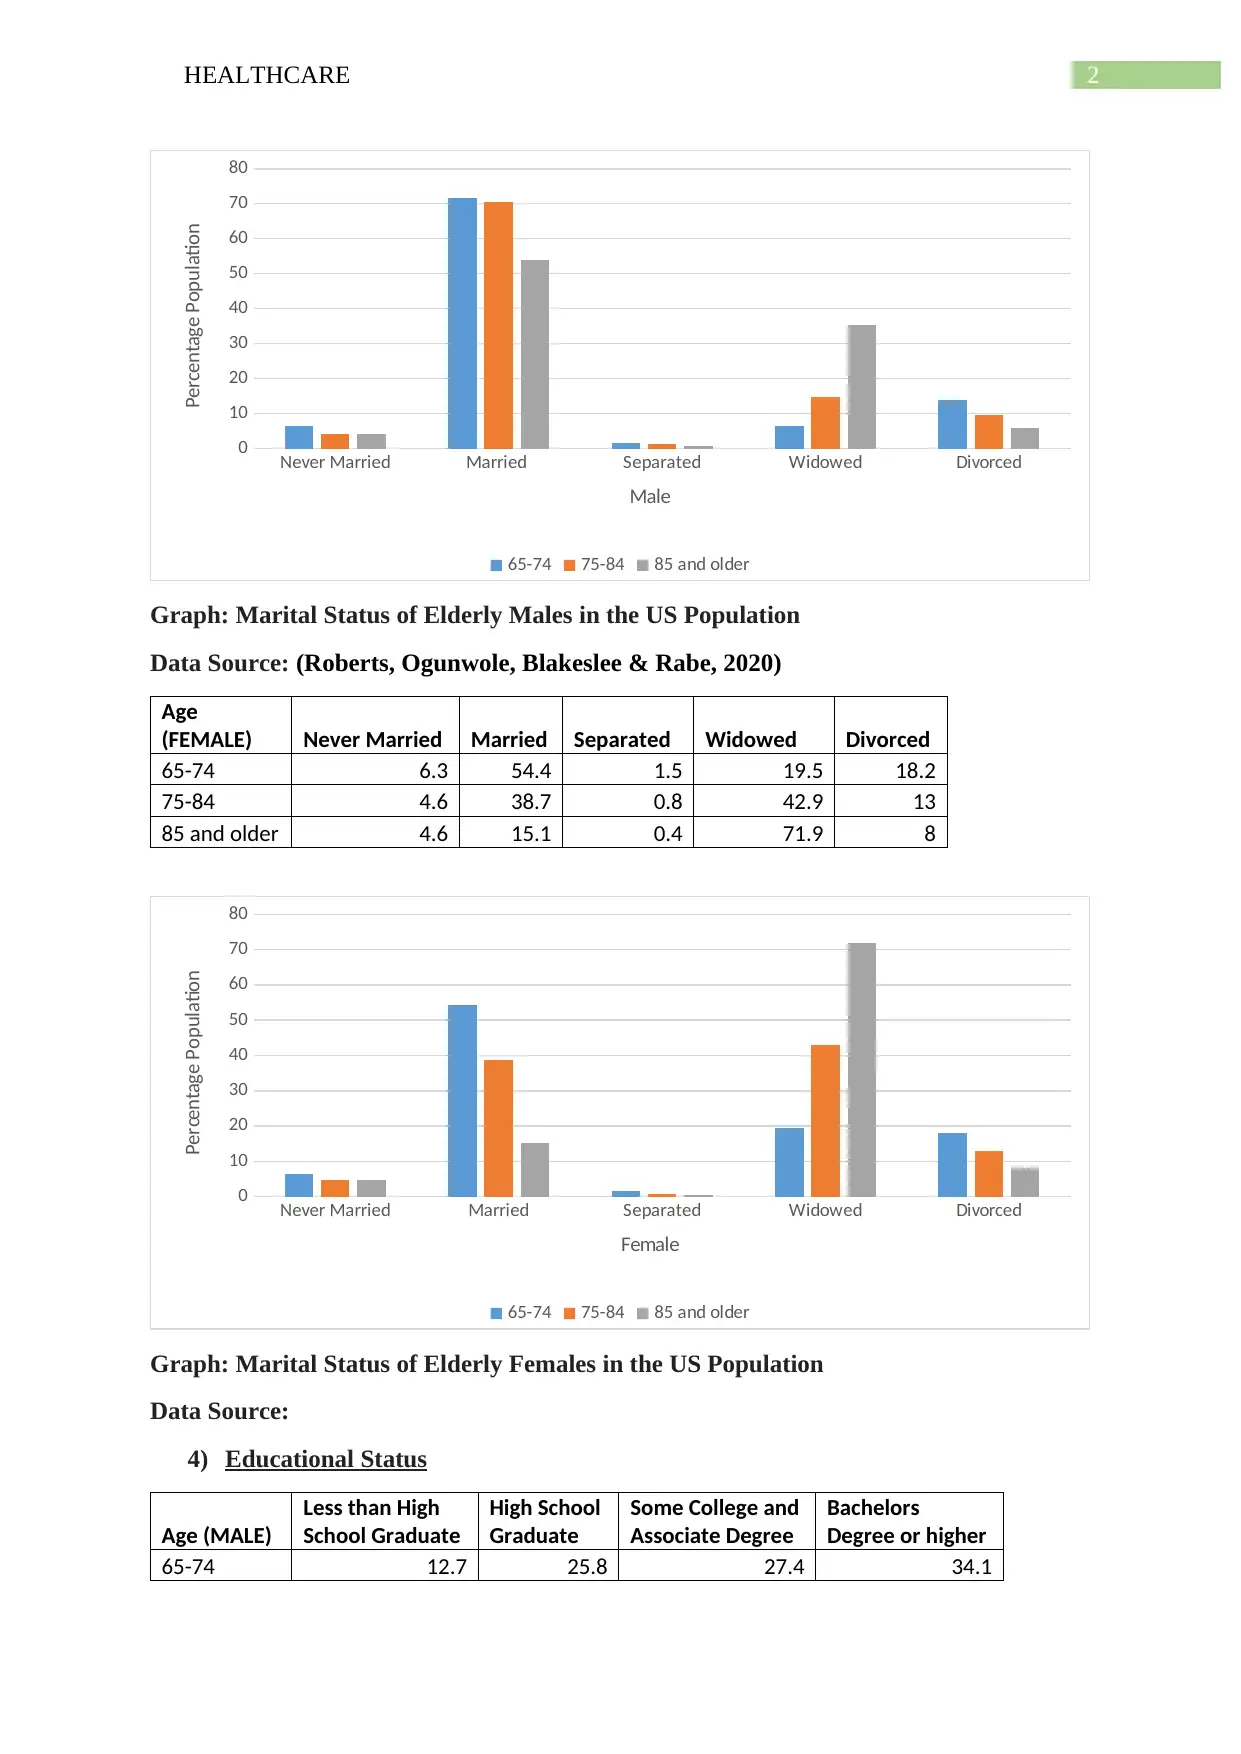
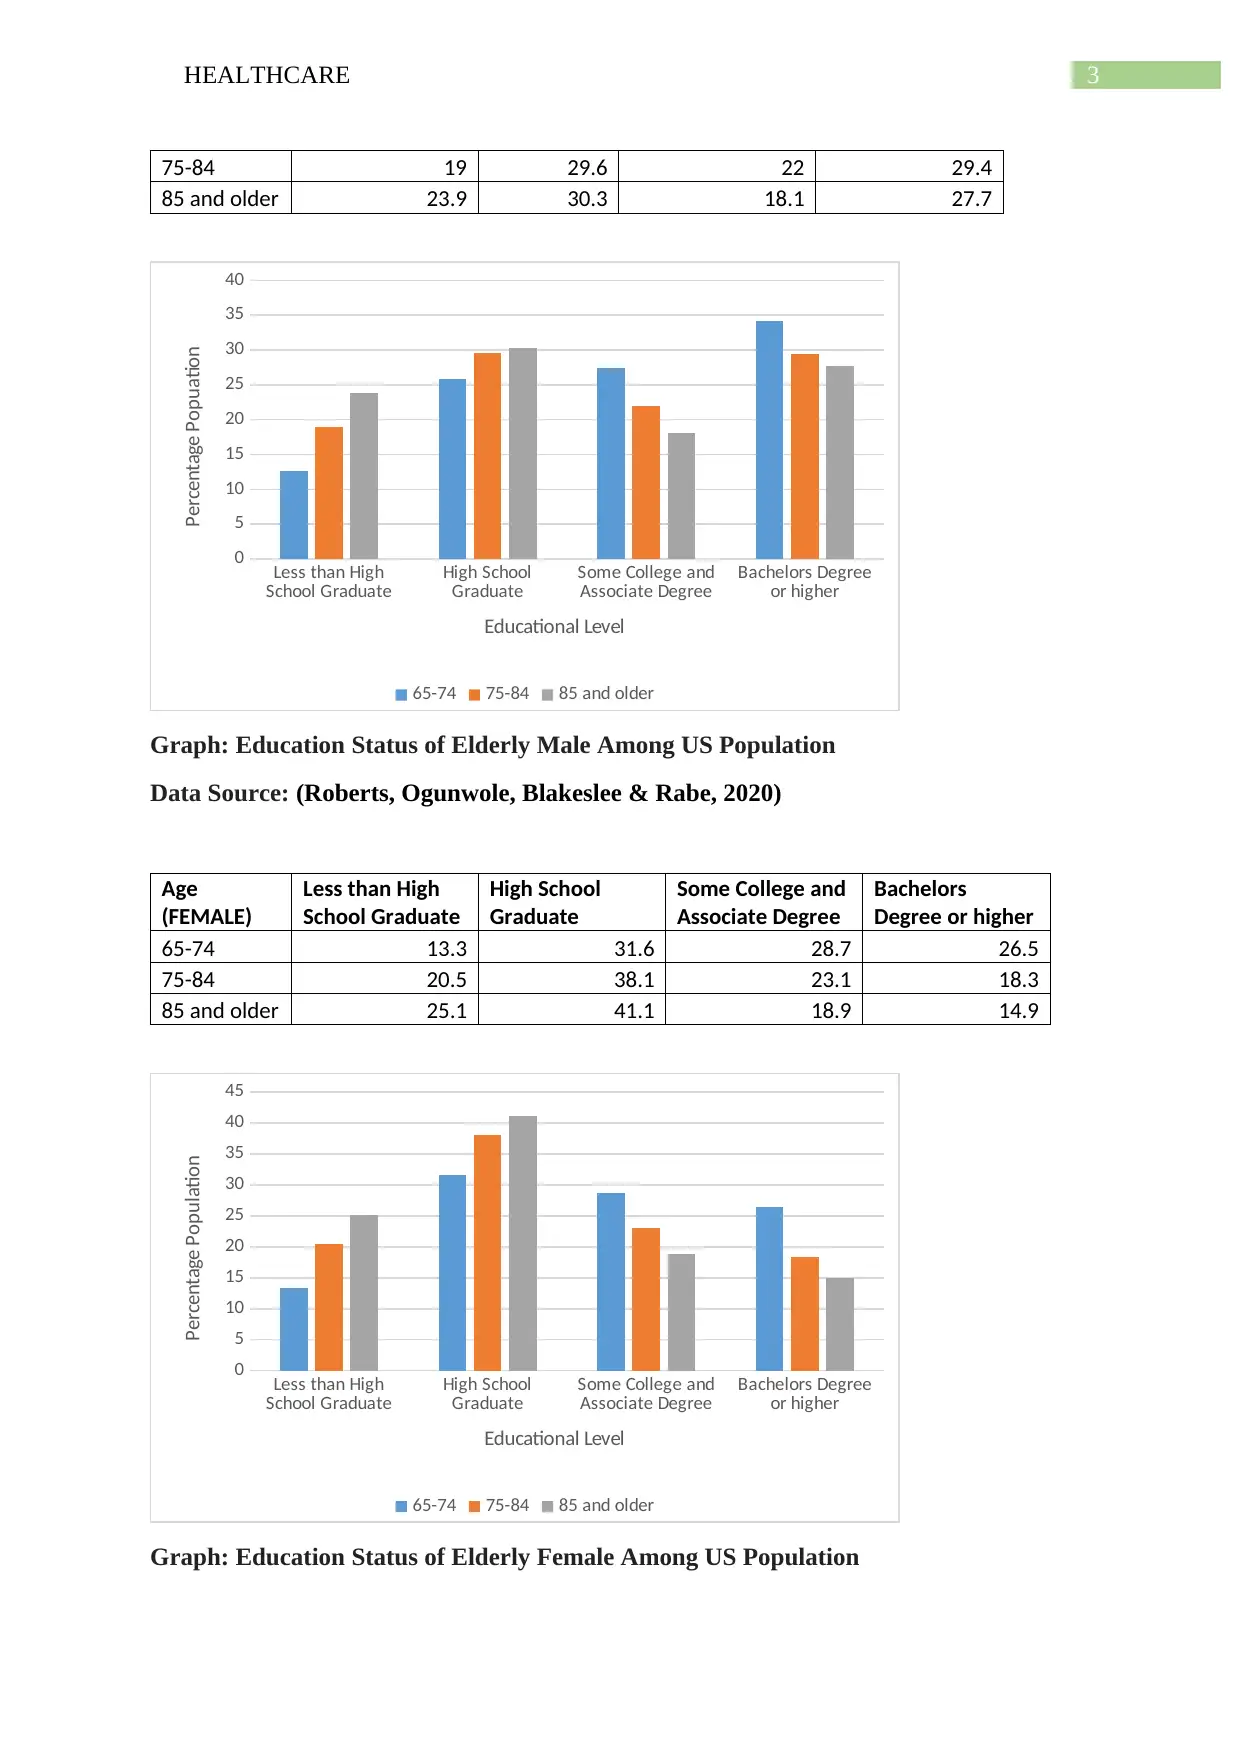
This report analyzes US Census data to understand the characteristics and healthcare needs of the elderly population in the United States. The analysis focuses on three age groups (65-74, 75-84, and 85+) and examines data on health conditions, marital status, educational attainment, and homeownership. The data reveals trends such as the decline in the sex ratio with age, increasing health vulnerabilities in older age groups, and shifts in marital status and educational levels. The report also explores the implications of these findings for long-term care and community care practices, suggesting the types of environments that different age groups might prefer. The findings indicate that health, marital status, educational background, and homeownership significantly influence the elderly population's needs and expectations regarding care settings. The analysis provides insights into the diverse needs of the aging population and their preferences for long-term and community care, offering a comprehensive overview based on the provided data.
Document Page
Running head: HEALTHCARE
US Census Data Analysis
Name of the Student:
Name of the University:
Author Note:
tabler-icon-diamond-filled.svg

Secure Best Marks with AI Grader

Need help grading? Try our AI Grader for instant feedback on your assignments.
Document Page
1HEALTHCARE
1) US Population
Age Male Female Total
65-74 14.24 16.24 30.48
75-84 6.73 8.66 15.39
85 and over 2.33 4.22 6.55
65-74 75-84 85 and over
0
5
10
15
20
25
30
35
Male Female
Population Number in
Millions
Graph: US Population in Millions
Data Source: (Roberts, Ogunwole, Blakeslee & Rabe, 2020)
2) Health Condition
Age Vision Hearing Ambulatory Cognitive Self-Care Independent Living
65-74 4.5 9.2 15.4 5.4 4.4 7.6
75-84 7.2 17.4 26.2 10.1 9.3 17.2
85 and over 15.8 34.6 48.4 23.3 24.3 43.4
65-74 75-84 85 and over
0
20
40
60
Vision Hearing Ambulatory Cognitive
Self-Care Independent Living Series7
Age Group
Percentage Population
Graph: Health Condition of Elderly US Population
Data Source: (Roberts, Ogunwole, Blakeslee & Rabe, 2020)
3) Marital Status
Age (MALE) Never Married Married Separated Widowed Divorced
65-74 6.5 71.6 1.5 6.4 14
75-84 4.1 70.5 1.2 14.7 9.5
85 and older 4.1 53.9 0.8 35.3 6
Document Page
2HEALTHCARE
Never Married Married Separated Widowed Divorced
0
10
20
30
40
50
60
70
80
65-74 75-84 85 and older
Male
Percentage Population
Graph: Marital Status of Elderly Males in the US Population
Data Source: (Roberts, Ogunwole, Blakeslee & Rabe, 2020)
Age
(FEMALE) Never Married Married Separated Widowed Divorced
65-74 6.3 54.4 1.5 19.5 18.2
75-84 4.6 38.7 0.8 42.9 13
85 and older 4.6 15.1 0.4 71.9 8
Never Married Married Separated Widowed Divorced
0
10
20
30
40
50
60
70
80
65-74 75-84 85 and older
Female
Percentage Population
Graph: Marital Status of Elderly Females in the US Population
Data Source:
4) Educational Status
Age (MALE)
Less than High
School Graduate
High School
Graduate
Some College and
Associate Degree
Bachelors
Degree or higher
65-74 12.7 25.8 27.4 34.1
Document Page
3HEALTHCARE
75-84 19 29.6 22 29.4
85 and older 23.9 30.3 18.1 27.7
Less than High
School Graduate High School
Graduate Some College and
Associate Degree Bachelors Degree
or higher
0
5
10
15
20
25
30
35
40
65-74 75-84 85 and older
Educational Level
Percentage Popuation
Graph: Education Status of Elderly Male Among US Population
Data Source: (Roberts, Ogunwole, Blakeslee & Rabe, 2020)
Age
(FEMALE)
Less than High
School Graduate
High School
Graduate
Some College and
Associate Degree
Bachelors
Degree or higher
65-74 13.3 31.6 28.7 26.5
75-84 20.5 38.1 23.1 18.3
85 and older 25.1 41.1 18.9 14.9
Less than High
School Graduate High School
Graduate Some College and
Associate Degree Bachelors Degree
or higher
0
5
10
15
20
25
30
35
40
45
65-74 75-84 85 and older
Educational Level
Percentage Population
Graph: Education Status of Elderly Female Among US Population
tabler-icon-diamond-filled.svg

Secure Best Marks with AI Grader

Need help grading? Try our AI Grader for instant feedback on your assignments.
Document Page
4HEALTHCARE
Data Source: (Roberts, Ogunwole, Blakeslee & Rabe, 2020)
5) Home Ownership Rate
Age Ownership Rate
65-74 79.4
75-84 78.9
85 and older 68.7
65-74 75-84 85 and older
62
64
66
68
70
72
74
76
78
80
82
Age Group
Percentage Population
Graph: Elderly Home Owners among US Population
Data Source: (Roberts, Ogunwole, Blakeslee & Rabe, 2020)
The first data set shows that the sex ratio declines with age, which leaves an
increasing number of females in comparison to the number of females. The graph also shows
male vulnerability more than the females at the elderly stage of life (census.gov, 2020).
The second dataset shows the vulnerability of health of older individuals. The data
shows that in every sector of health (vision, ambulatory, hearing, cognitive, self-care and
independent living) the most elderly individuals are affected the most. Ambulatory health and
independent living are the most highlighted scenario which shows the impact to turn the
elderly individuals towards the vulnerability. Moreover it was also proved that with ageing
each of these factors will grow on increasing (Census.gov, 2020).
Document Page
5HEALTHCARE
The Analysis of the third Dataset of the marital status came up with amazing
highlights, which clearly mentions that if an individual (either male or female) stays
unmarried by the age of 75, then the whole tenure of their life remains the same as the
percentage for the age group of 75-84 and 85 and older are the same. Moreover, another
interesting fact the graph pointed was the percentage of divorced individuals. The rate of
demand for the divorce was high among the females that in terms of males, which can be a
cause towards hypothesizing that the rate of conflicts created in a relationship, are higher due
to the females. Lastly, it also highlights that with increasing age the death prevails as
widowing is higher among the 85 and older age group for both males and females.
The fourth set of analysis was the educational analysis of the individuals above 65
years of age. The data clearly shows that the first three sections denoting the elderly females
instead of the males achieved high school mid school, and college associate degree more.
However, it also depicts that males had approached more towards the bachelor’s degree and
post bachelor’s programs. However, an interesting fact came to notice that with tenure the
awareness of education has increased among the individuals, which shows a higher number
of individuals in the age group of 65-74 years who have under gone bachelor’s and post
bachelor’s degree.
The fifth and the last analysis of the graphs were circulated among the
homeownership of elderly individuals. The analysis provided shows that 77.9 percent of
elders on an average of 65 years or more owns their own property. However, the detailed
analysis based on the segregated age groups of 65 to 74 years show that individual have more
ownership of properties than the other elderly age groups. The terms may be such because of
loss of house due to elderly abuse or natural calamities or due to increase mortality of those
individuals with homeownership. The late phase of the life shows that 68.7 percent of
individuals aged 85 years or more have a home ownership, whereas the count was 79.4
Document Page
6HEALTHCARE
percent for those in the age groups of 65 to 74 years old. Moreover, a possibility also lies that
with increase in time frame the awareness of education has also shown its impact which may
have resulted in growing economy for more individuals to afford a homeownership. Thus the
results might have varied immensely from one age group (75-84 years) to other (85 years and
older).
tabler-icon-diamond-filled.svg

Paraphrase This Document

Need a fresh take? Get an instant paraphrase of this document with our AI Paraphraser
Document Page
7HEALTHCARE
References
census.gov. (2020). Older Population and Aging. Retrieved 8 February 2020, from
https://www.census.gov/topics/population/older-aging.html
Census.gov. (2020). Sixty-Five Plus in the United States. Retrieved 8 February 2020, from
https://www.census.gov/population/socdemo/statbriefs/agebrief.html
Roberts, A., Ogunwole, S., Blakeslee, L., & Rabe, M. (2020). The Population 65 Years and
Older in the United States: 2016 [Ebook] (pp. 2-15). census.gov. Retrieved from
https://www.census.gov/content/dam/Census/library/publications/2018/acs/ACS-
38.pdf
chevron_up_icon
1 out of 8
circle_padding
hide_on_mobile
zoom_out_icon
logo.png

Your All-in-One AI-Powered Toolkit for Academic Success.

Available 24*7 on WhatsApp / Email

[object Object]