International Financial Management: US vs China (10 Year Analysis)

Verified

Added on  2022/08/29

|8
|750
|21
Report
AI Summary
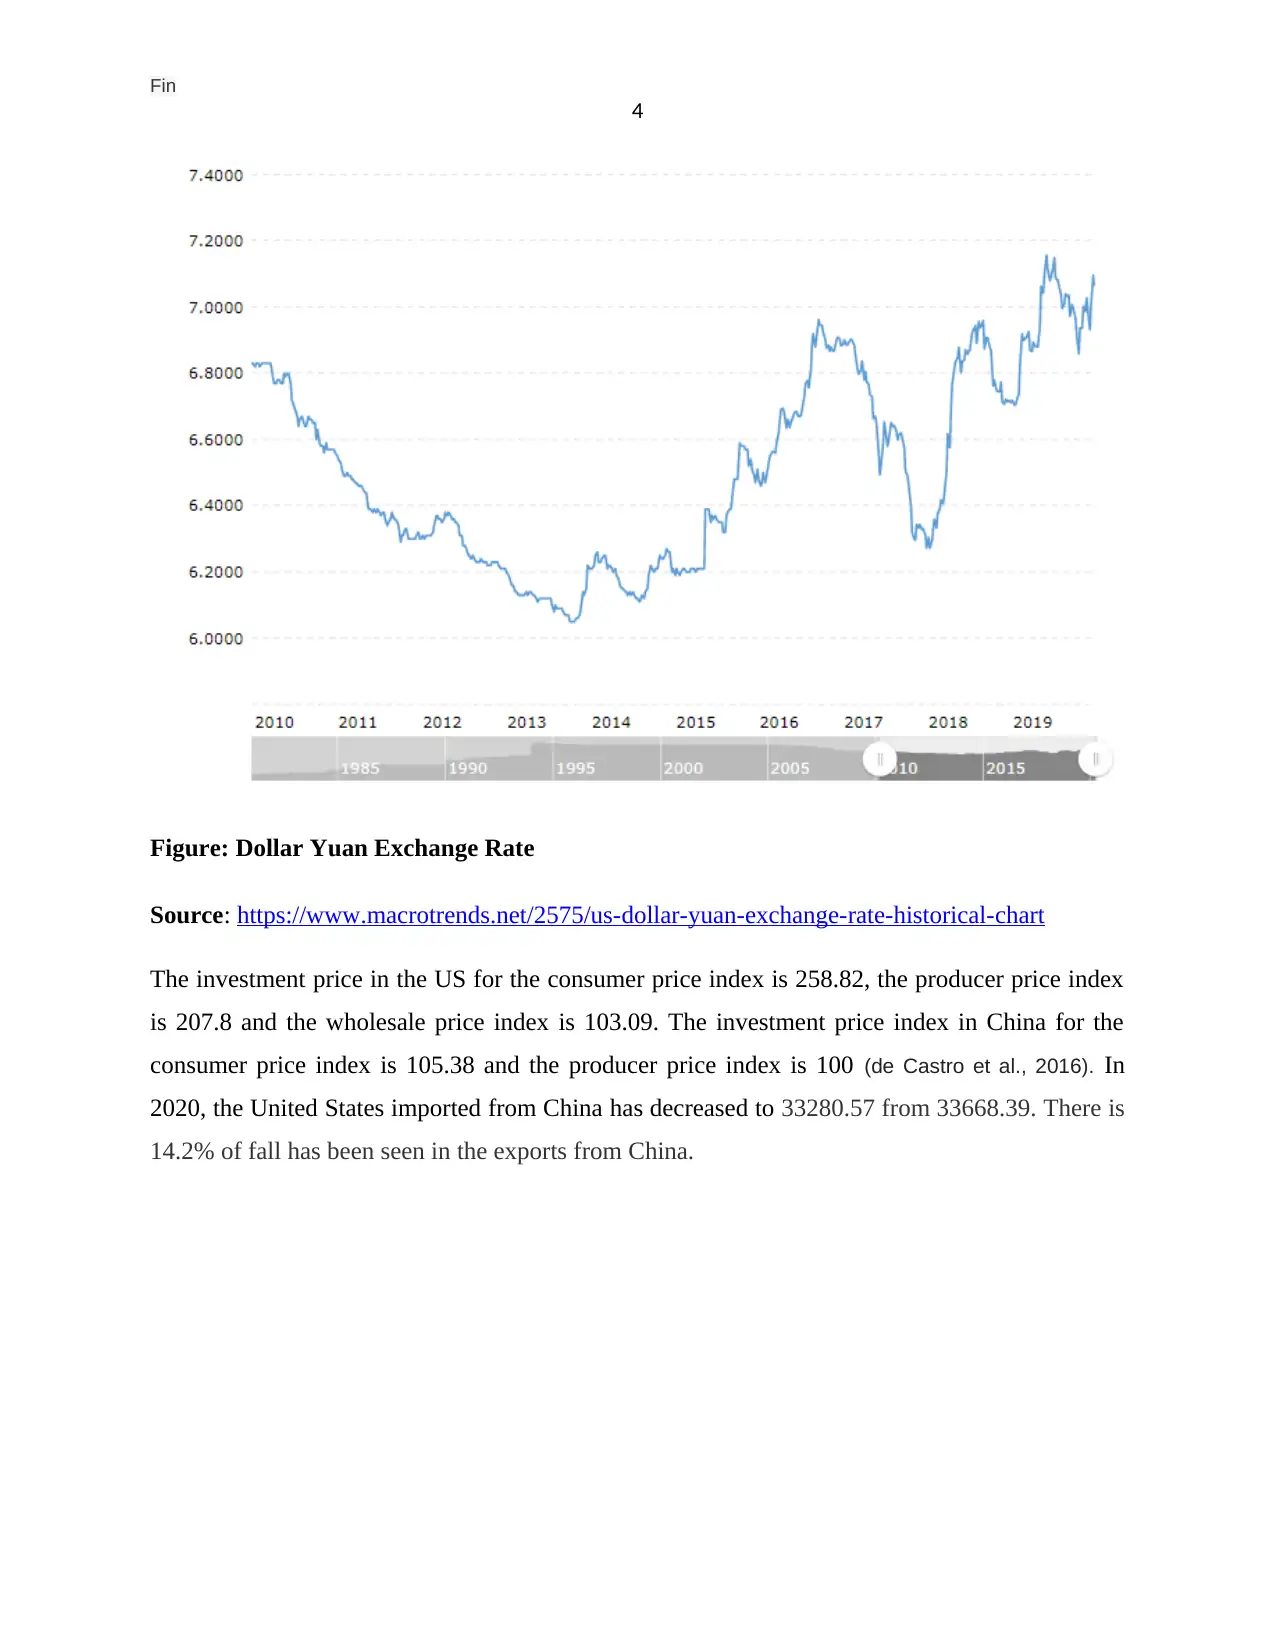
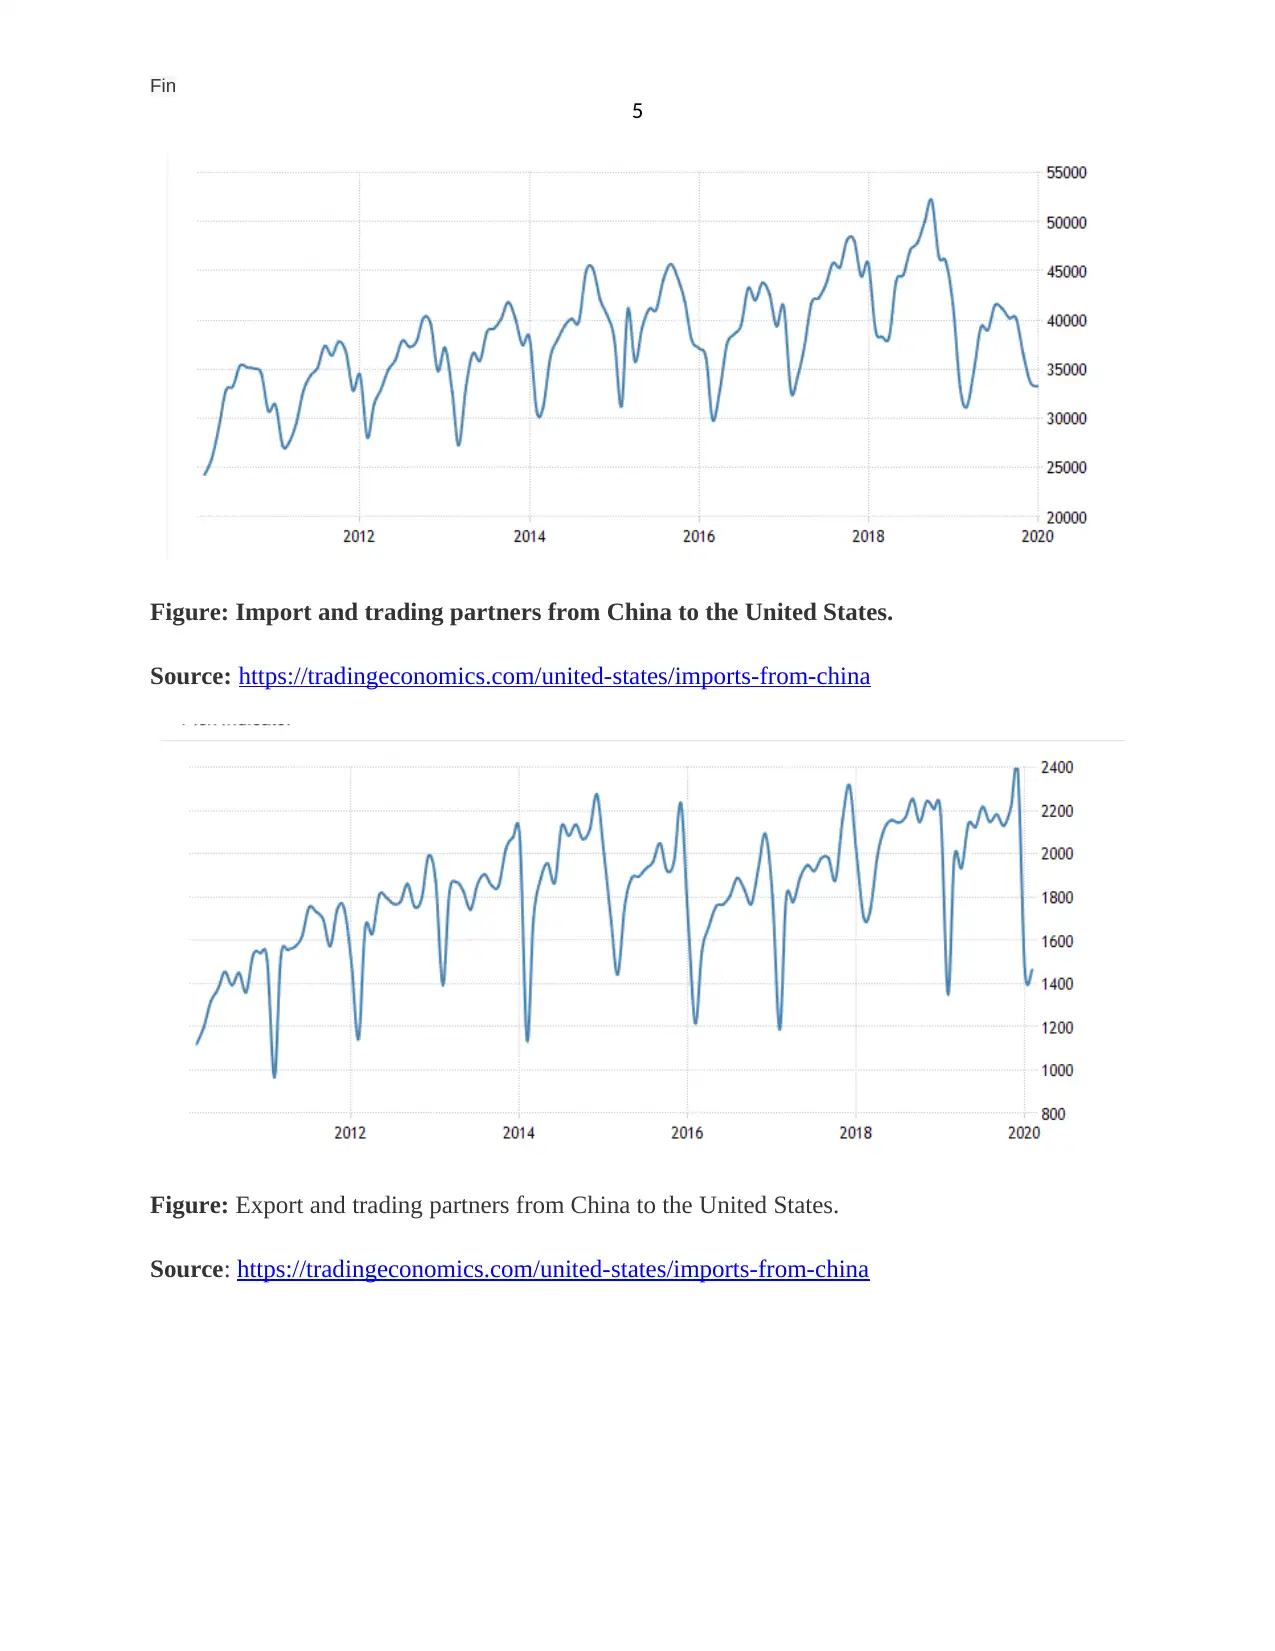
This report offers a comparative financial analysis of the United States and China over a 10-year span, focusing on key economic indicators and financial theories. It begins by examining Purchasing Power Parity (PPP), highlighting the difference in nominal GDP and per capita income between the two countries. The report then delves into the Net Effective Exchange Rate (NEER) review, assessing the weighted geometric average of both countries' foreign currency values. The analysis includes exchange rate fluctuations between the US dollar and the Chinese Yuan, alongside investment price indices for consumer prices, producer prices, and wholesale prices. Furthermore, the report explores trade dynamics, including import and export data between the US and China. References to relevant research papers are also provided, supporting the analysis with academic insights. This report provides a comprehensive overview of the financial relationship between the US and China, offering valuable insights for students studying international finance.
Document Page
Running Head: Fin
0
International financial management
USA and China over a 10 year period
3/25/2020
tabler-icon-diamond-filled.svg

Paraphrase This Document

Need a fresh take? Get an instant paraphrase of this document with our AI Paraphraser
Document Page
Fin
1
U.S. and China over 10 years PPP theory
Over the 10 years, the population of China is four times more than the population of the US. In
the last 10 years, China's per capita income has been gown up more than 10%. Based on the
purchasing power parity the nominal GDP of China is $13.41 trillion so their size of the
economy is smaller than the US as their nominal GDP as per the PPP is $25.27 trillion (Qiao, et
al., 2015).
Based on the PPP, the US is the richer country than China as the US per capita income is the
6.38 which is greater than the china by 3.32 times. As per the statistic measures of the PPP, it
was found that the United States is in the 12th position in terms of the richest country whereas
China stands for 75th position.
GDP per capita in China has raised with the rapid rate and as per the economic global macro
models, it was expected that it will reach up to 18450 USD. On the PPP scale, China always
ranks higher as the labor costs are very lower which helps in keeping the prices lower. China has
the highest Purchasing power parity with the $23210 billion and the US is the second country
with the $19490 billion (Zhang, 2017). In 2021, it was projected to trend that as per PPP, the GDP
per capita of the US will be around $58500. US GDP per capita PPP has also enhanced but that
not much effective rate in comparison to China.
China GDP per capita PPP for the 10 years
Document Page
Fin
2
Source: https://tradingeconomics.com/china/gdp-per-capita-ppp
US GDP per capita PPP for the 10 years
Source: https://tradingeconomics.com/united-states/gdp-per-capita-ppp
NEER Review
In the NEER review, the weighted geometric average of both countries is evaluated in terms of
the foreign currency with the bilateral nominal exchange rate. The REER review is evaluated by
doing the weighted average of the ratio. In this review, the ratio is evaluated in terms of the
domestic price to foreign currency. As per the REER review the exchange rate of the1 China
Yuan is the 0.14 United States Dollars. The Exchange rate of the 1 US dollar is equal to the
Chinese Yuan of 7.07 (Karagöz and Saraç, 2016).
Document Page
Fin
3
Figure: US Dollar Exchange rate
Source: https://www.xe.com/currencycharts/?from=USD&to=INR&view=10Y
tabler-icon-diamond-filled.svg

Paraphrase This Document

Need a fresh take? Get an instant paraphrase of this document with our AI Paraphraser
Document Page
Fin
4
Figure: Dollar Yuan Exchange Rate
Source: https://www.macrotrends.net/2575/us-dollar-yuan-exchange-rate-historical-chart
The investment price in the US for the consumer price index is 258.82, the producer price index
is 207.8 and the wholesale price index is 103.09. The investment price index in China for the
consumer price index is 105.38 and the producer price index is 100 (de Castro et al., 2016). In
2020, the United States imported from China has decreased to 33280.57 from 33668.39. There is
14.2% of fall has been seen in the exports from China.
Document Page
Fin
5
Figure: Import and trading partners from China to the United States.
Source: https://tradingeconomics.com/united-states/imports-from-china
Figure: Export and trading partners from China to the United States.
Source: https://tradingeconomics.com/united-states/imports-from-china
Document Page
Fin
6
tabler-icon-diamond-filled.svg

Paraphrase This Document

Need a fresh take? Get an instant paraphrase of this document with our AI Paraphraser
Document Page
Fin
7
References
de Castro e Silva Neto, D., Cruz, C.O., Rodrigues, F. and Silva, P., 2016. Bibliometric analysis of PPP
and PFI literature: Overview of 25 years of research. Journal of construction engineering and
management, 142(10), p.06016002.
Karagöz, K. and Saraç, T.B., 2016. Testing the validity of PPP theory for Turkey: nonlinear unit root
testing. Procedia Economics and Finance, 38, pp.458-467.
Qiao, H., Li, Y. and Xia, Y., 2015. Analysis of linkage effects among currency networks using REER
data. Discrete Dynamics in Nature and Society, 2015.
Zhang, X., 2017. Trade Policy Review for China: The world's top exporter with “new normal” economic
growth. The World Economy, 40(11), pp.2491-2499.
chevron_up_icon
1 out of 8
circle_padding
hide_on_mobile
zoom_out_icon
[object Object]