MATH 114: Discussion Forum 2: Analysis of US Death Rates 1980 and 2014

Verified

Added on  2023/03/17

|3
|643
|55
Discussion Board Post
AI Summary
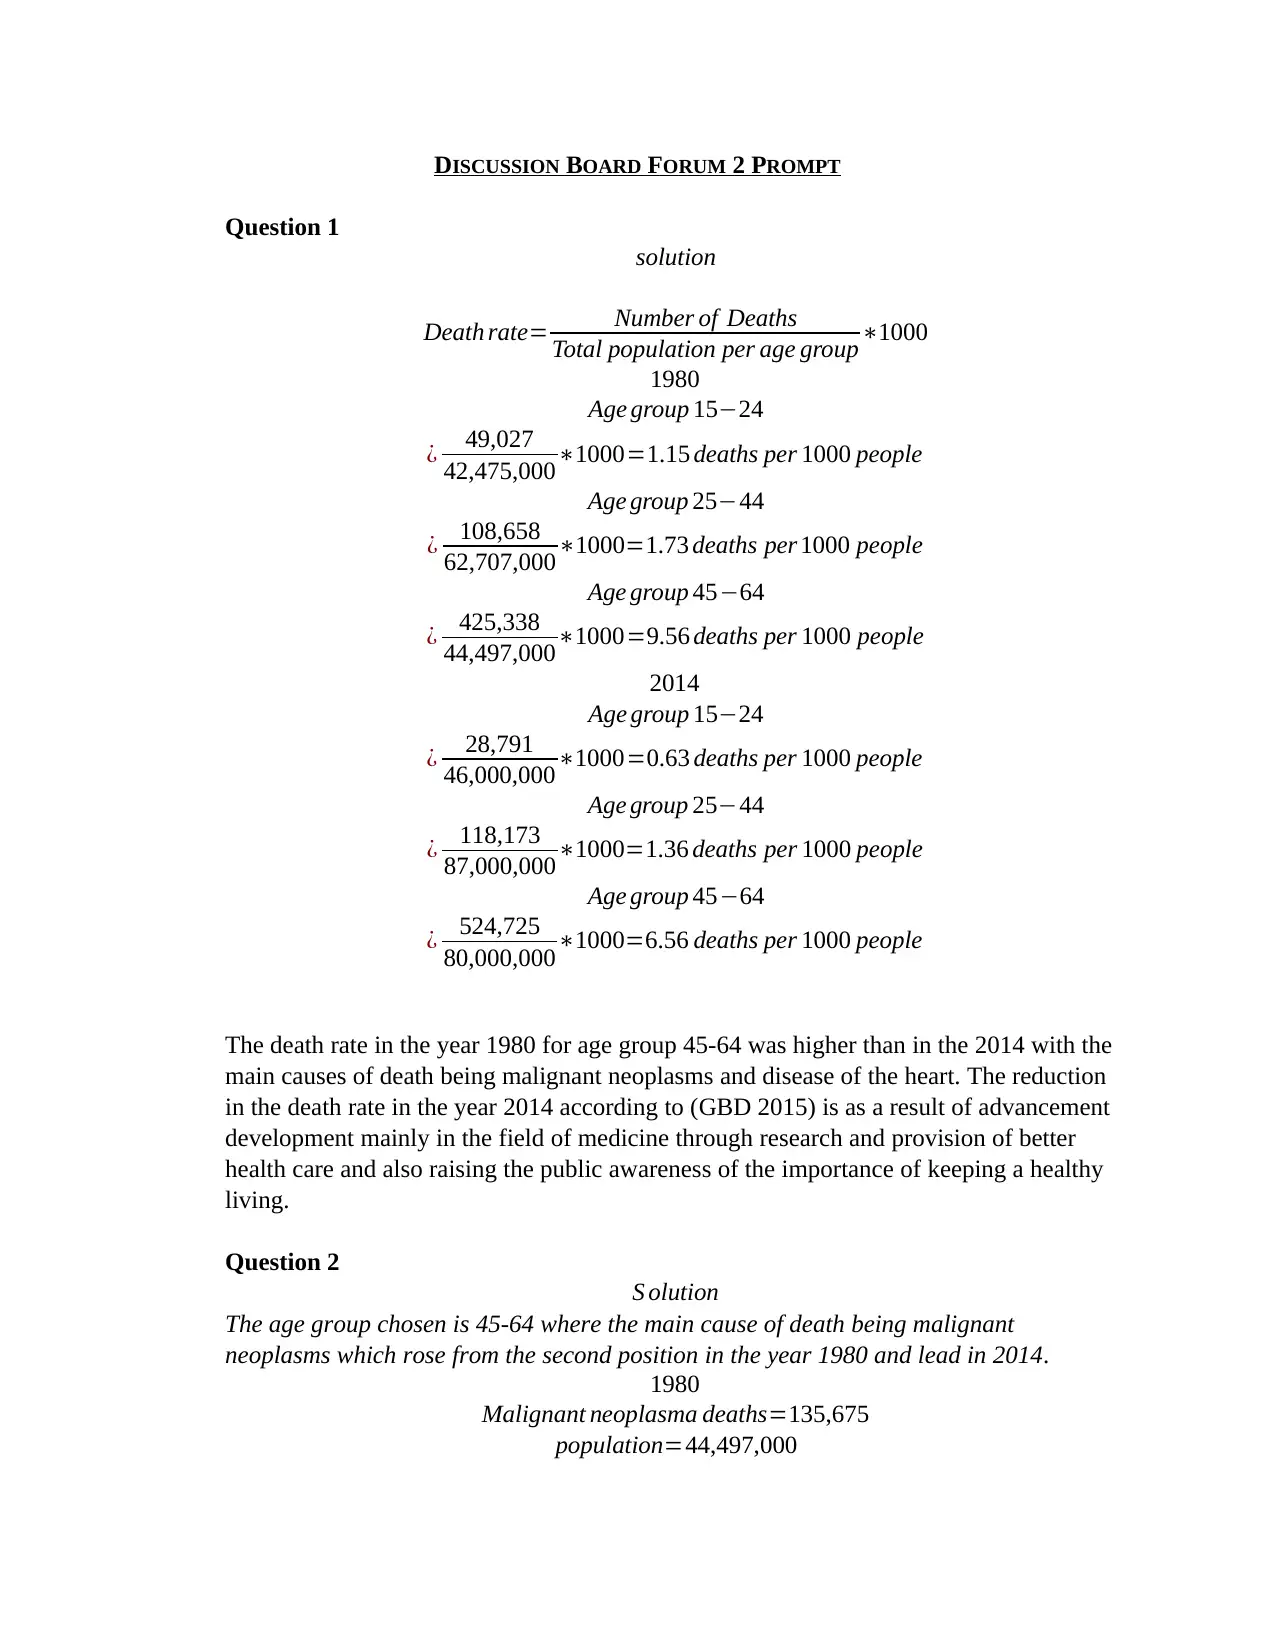
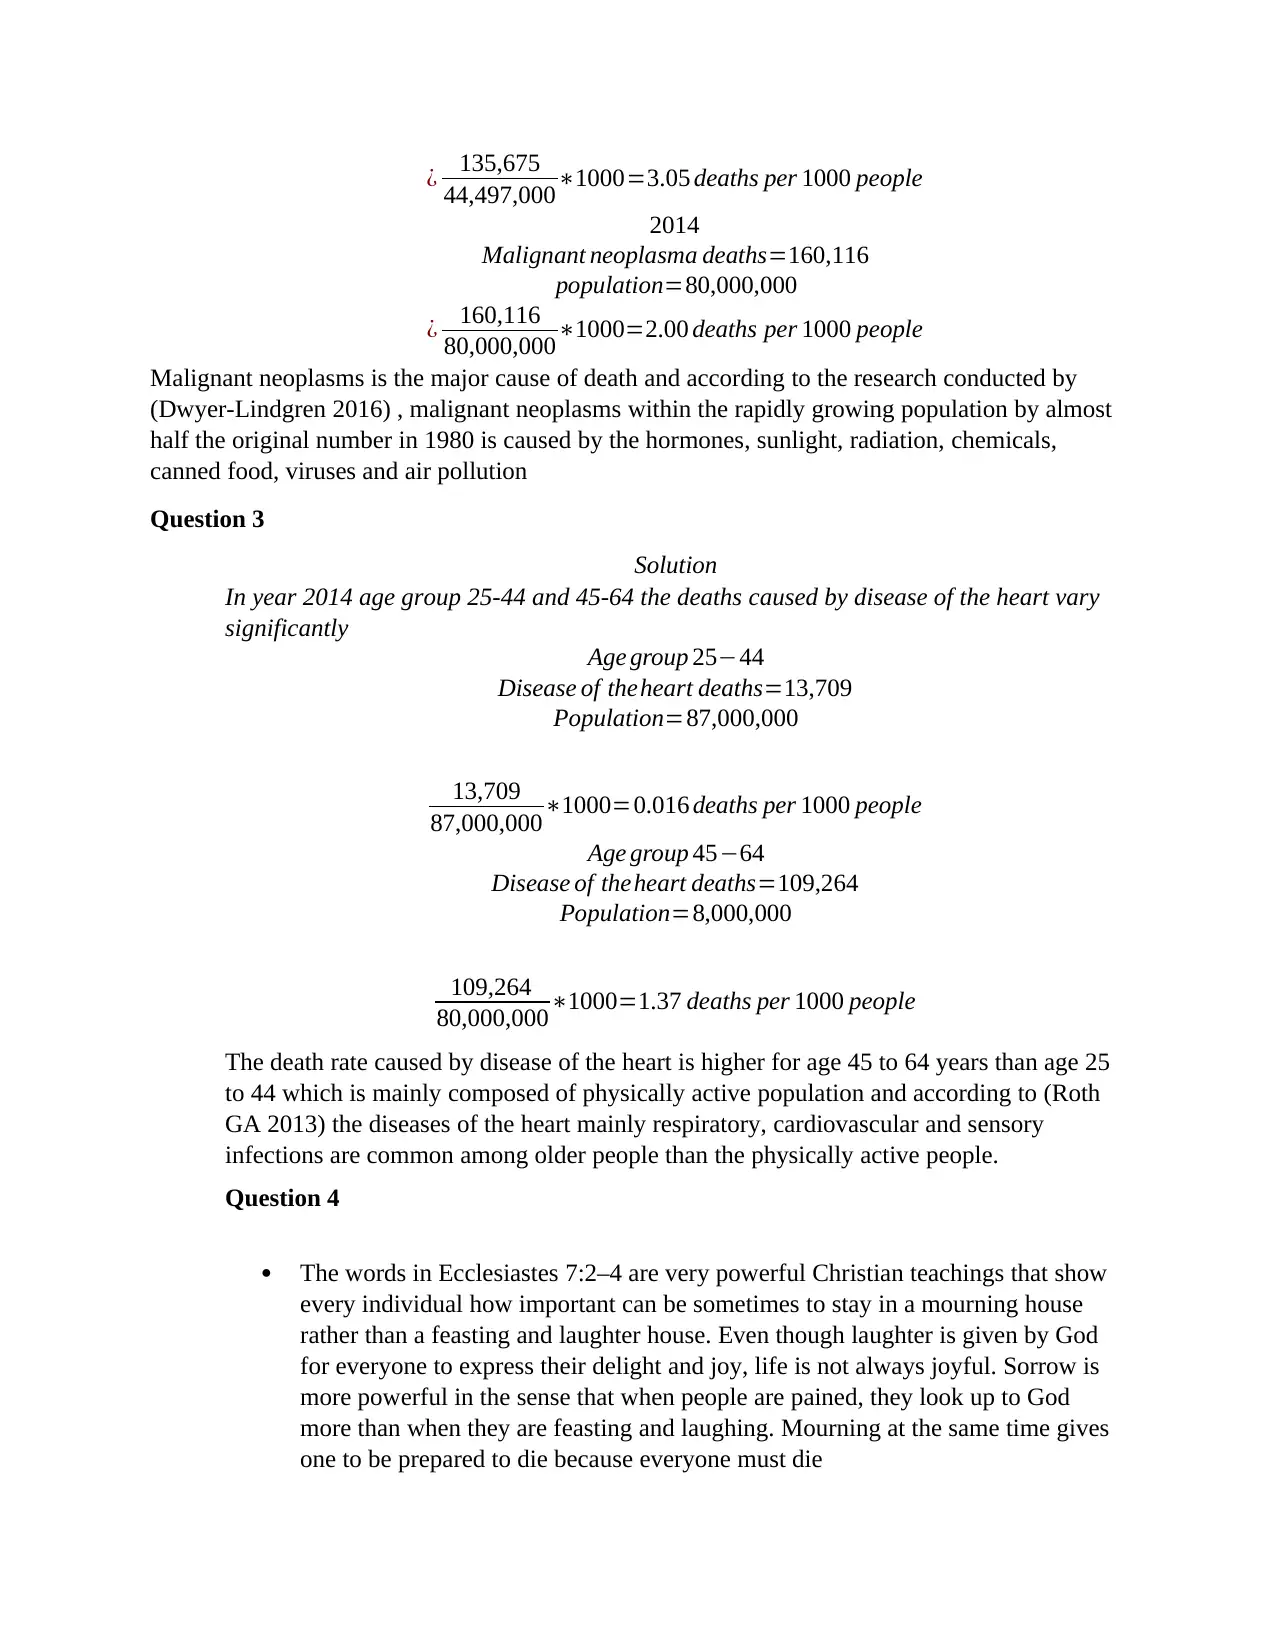
This assignment is a solution to a MATH 114 Discussion Board Forum 2 prompt, focusing on the analysis of death rates and causes of death in the United States between 1980 and 2014. The solution calculates death rates per 1000 people for different age groups (15-24, 25-44, and 45-64) in both years, revealing a decrease in overall death rates. The analysis highlights malignant neoplasms and diseases of the heart as significant causes of death, and the solution discusses the factors contributing to changes in these rates, including advancements in medicine and increased public awareness. The assignment includes calculations and comparisons of death rates for specific causes within different age brackets and provides a reflection on the impact of sorrow and mourning based on Ecclesiastes 7:2-4. The solution references several sources, including the Global Burden of Disease Study and publications from the National Center for Health Statistics.
Document Page
DISCUSSION BOARD FORUM 2 PROMPT
Question 1
solution
Death rate= Number of Deaths
Total population per age group1000
1980
Age group 1524
¿ 49,027
42,475,0001000=1.15 deaths per 1000 people
Age group 2544
¿ 108,658
62,707,0001000=1.73 deaths per 1000 people
Age group 4564
¿ 425,338
44,497,0001000=9.56 deaths per 1000 people
2014
Age group 1524
¿ 28,791
46,000,0001000=0.63 deaths per 1000 people
Age group 2544
¿ 118,173
87,000,0001000=1.36 deaths per 1000 people
Age group 4564
¿ 524,725
80,000,0001000=6.56 deaths per 1000 people
The death rate in the year 1980 for age group 45-64 was higher than in the 2014 with the
main causes of death being malignant neoplasms and disease of the heart. The reduction
in the death rate in the year 2014 according to (GBD 2015) is as a result of advancement
development mainly in the field of medicine through research and provision of better
health care and also raising the public awareness of the importance of keeping a healthy
living.
Question 2
S olution
The age group chosen is 45-64 where the main cause of death being malignant
neoplasms which rose from the second position in the year 1980 and lead in 2014.
1980
Malignant neoplasma deaths=135,675
population=44,497,000
tabler-icon-diamond-filled.svg

Paraphrase This Document

Need a fresh take? Get an instant paraphrase of this document with our AI Paraphraser
Document Page
¿ 135,675
44,497,0001000=3.05 deaths per 1000 people
2014
Malignant neoplasma deaths=160,116
population=80,000,000
¿ 160,116
80,000,0001000=2.00 deaths per 1000 people
Malignant neoplasms is the major cause of death and according to the research conducted by
(Dwyer-Lindgren 2016) , malignant neoplasms within the rapidly growing population by almost
half the original number in 1980 is caused by the hormones, sunlight, radiation, chemicals,
canned food, viruses and air pollution
Question 3
Solution
In year 2014 age group 25-44 and 45-64 the deaths caused by disease of the heart vary
significantly
Age group 2544
Disease of theheart deaths=13,709
Population=87,000,000
13,709
87,000,0001000=0.016 deaths per 1000 people
Age group 4564
Disease of theheart deaths=109,264
Population=8,000,000
109,264
80,000,0001000=1.37 deaths per 1000 people
The death rate caused by disease of the heart is higher for age 45 to 64 years than age 25
to 44 which is mainly composed of physically active population and according to (Roth
GA 2013) the diseases of the heart mainly respiratory, cardiovascular and sensory
infections are common among older people than the physically active people.
Question 4
The words in Ecclesiastes 7:2–4 are very powerful Christian teachings that show
every individual how important can be sometimes to stay in a mourning house
rather than a feasting and laughter house. Even though laughter is given by God
for everyone to express their delight and joy, life is not always joyful. Sorrow is
more powerful in the sense that when people are pained, they look up to God
more than when they are feasting and laughing. Mourning at the same time gives
one to be prepared to die because everyone must die
Document Page
Reference
1. GBD 2015 Mortality Causes of Death Collaborators. Global, regional, and
national life expectancy, all-cause mortality, and cause-specific mortality for 249
causes of death, 1980–2015: a systematic analysis for the Global Burden of
Disease Study 2015. Lancet. 2016;388(10053):
2. Dwyer-Lindgren, Laura, et al. "US county-level trends in mortality rates for major
causes of death, 1980-2014." Jama 316.22 (2016):
3. Roth GA, Huffman MD, Moran AE, et al. Global and Regional Patterns in
Cardiovascular Mortality from 1990 to 2013. Circulation. 2015 Oct 27;132(17):
4. The Holy Bible. New King James Version. Nashville, TN: Thomas Nelson, Inc.,
1982.
chevron_up_icon
1 out of 3
circle_padding
hide_on_mobile
zoom_out_icon
[object Object]