Finance Report: US Economic Analysis and Financial System

Verified

Added on  2023/06/03

|15
|2531
|59
Report
AI Summary
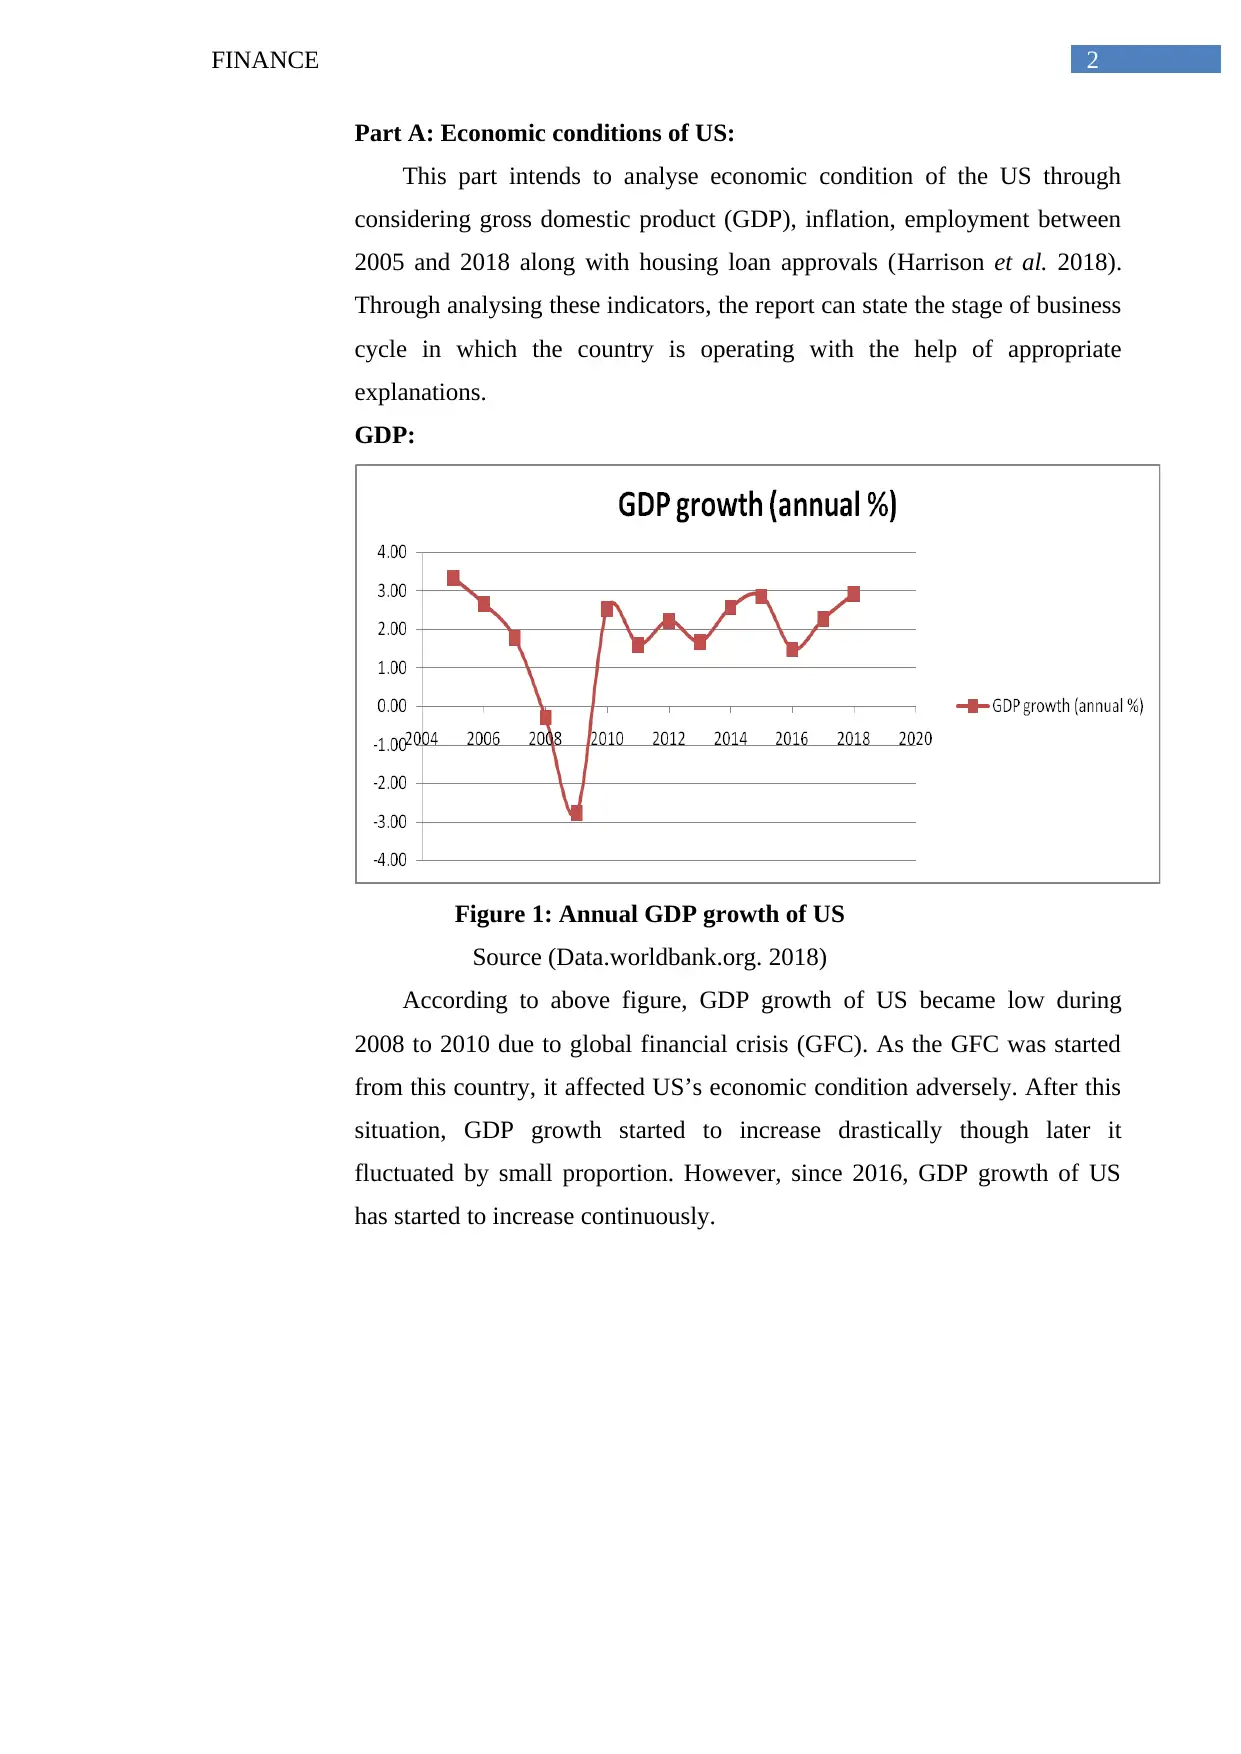
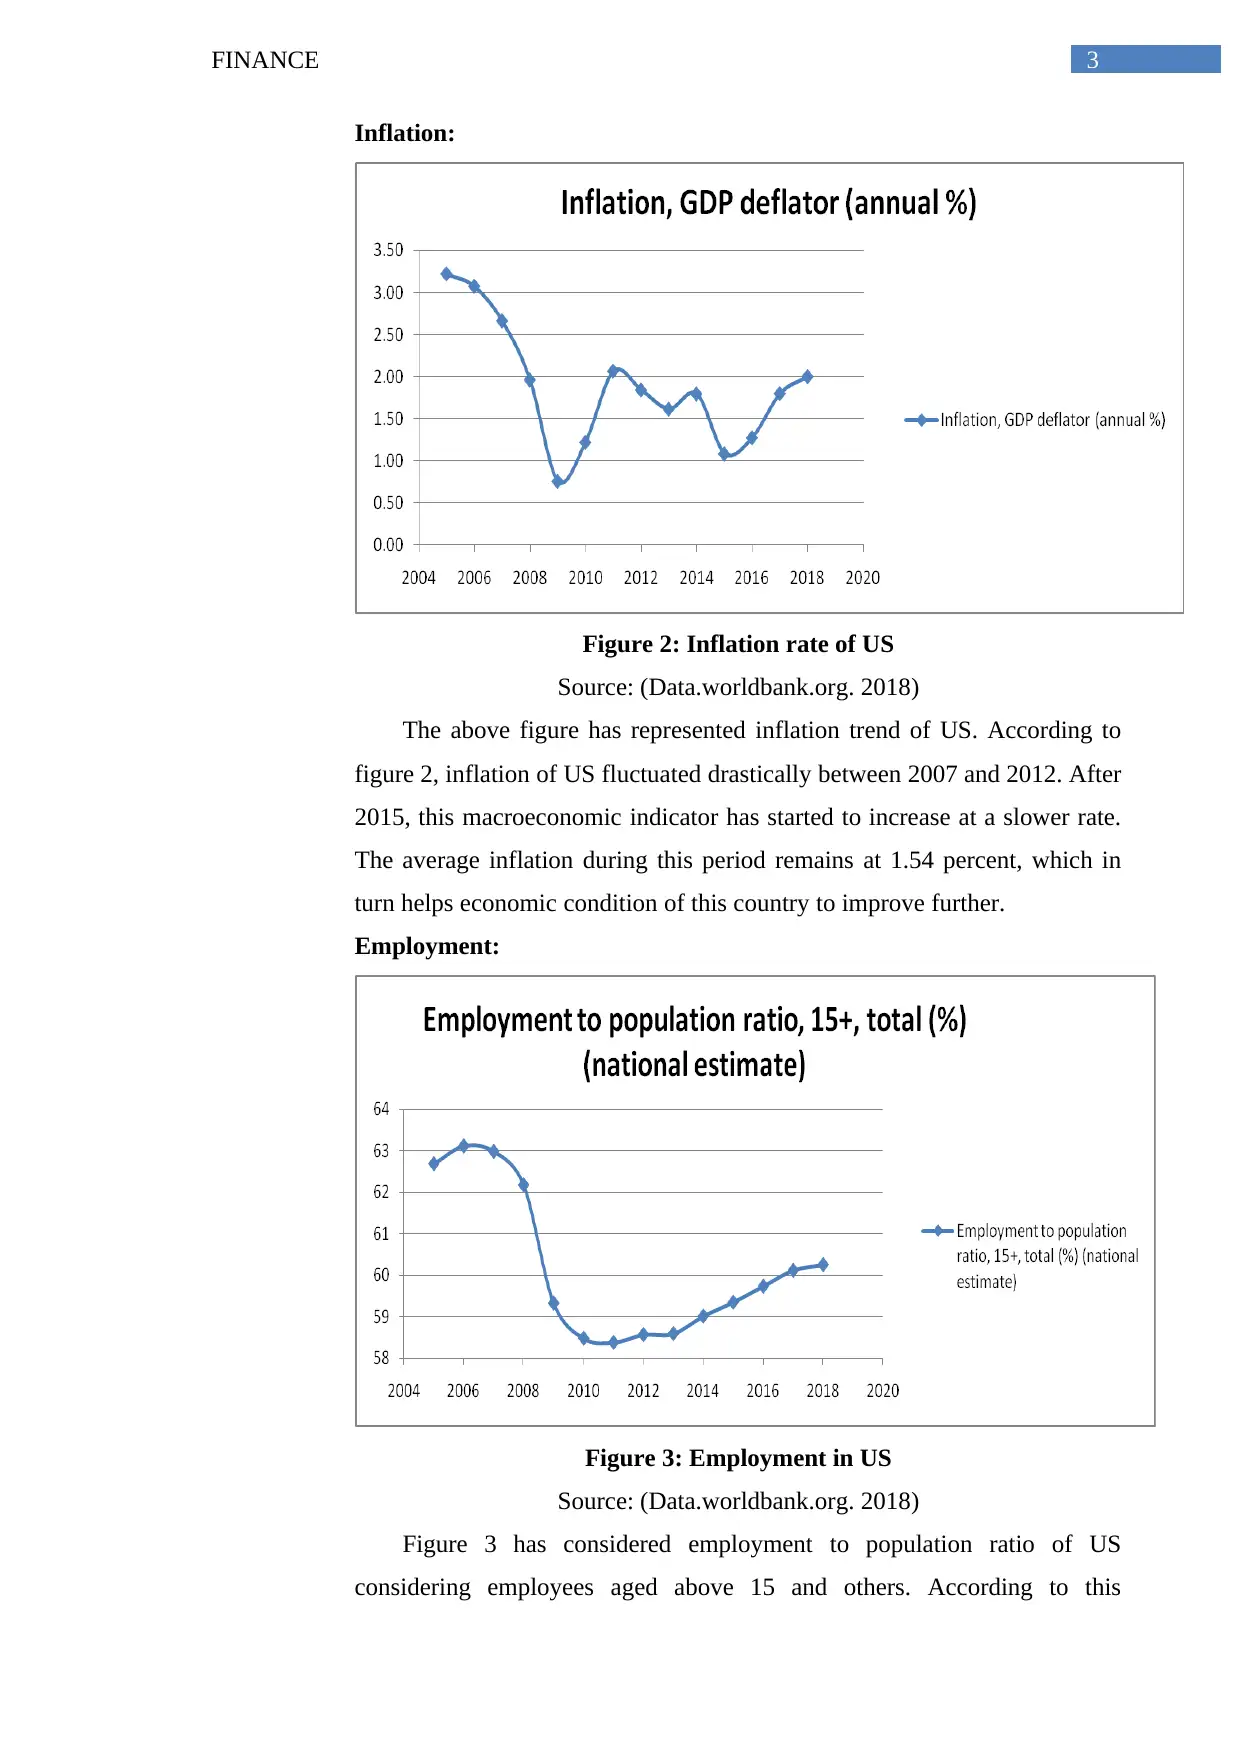
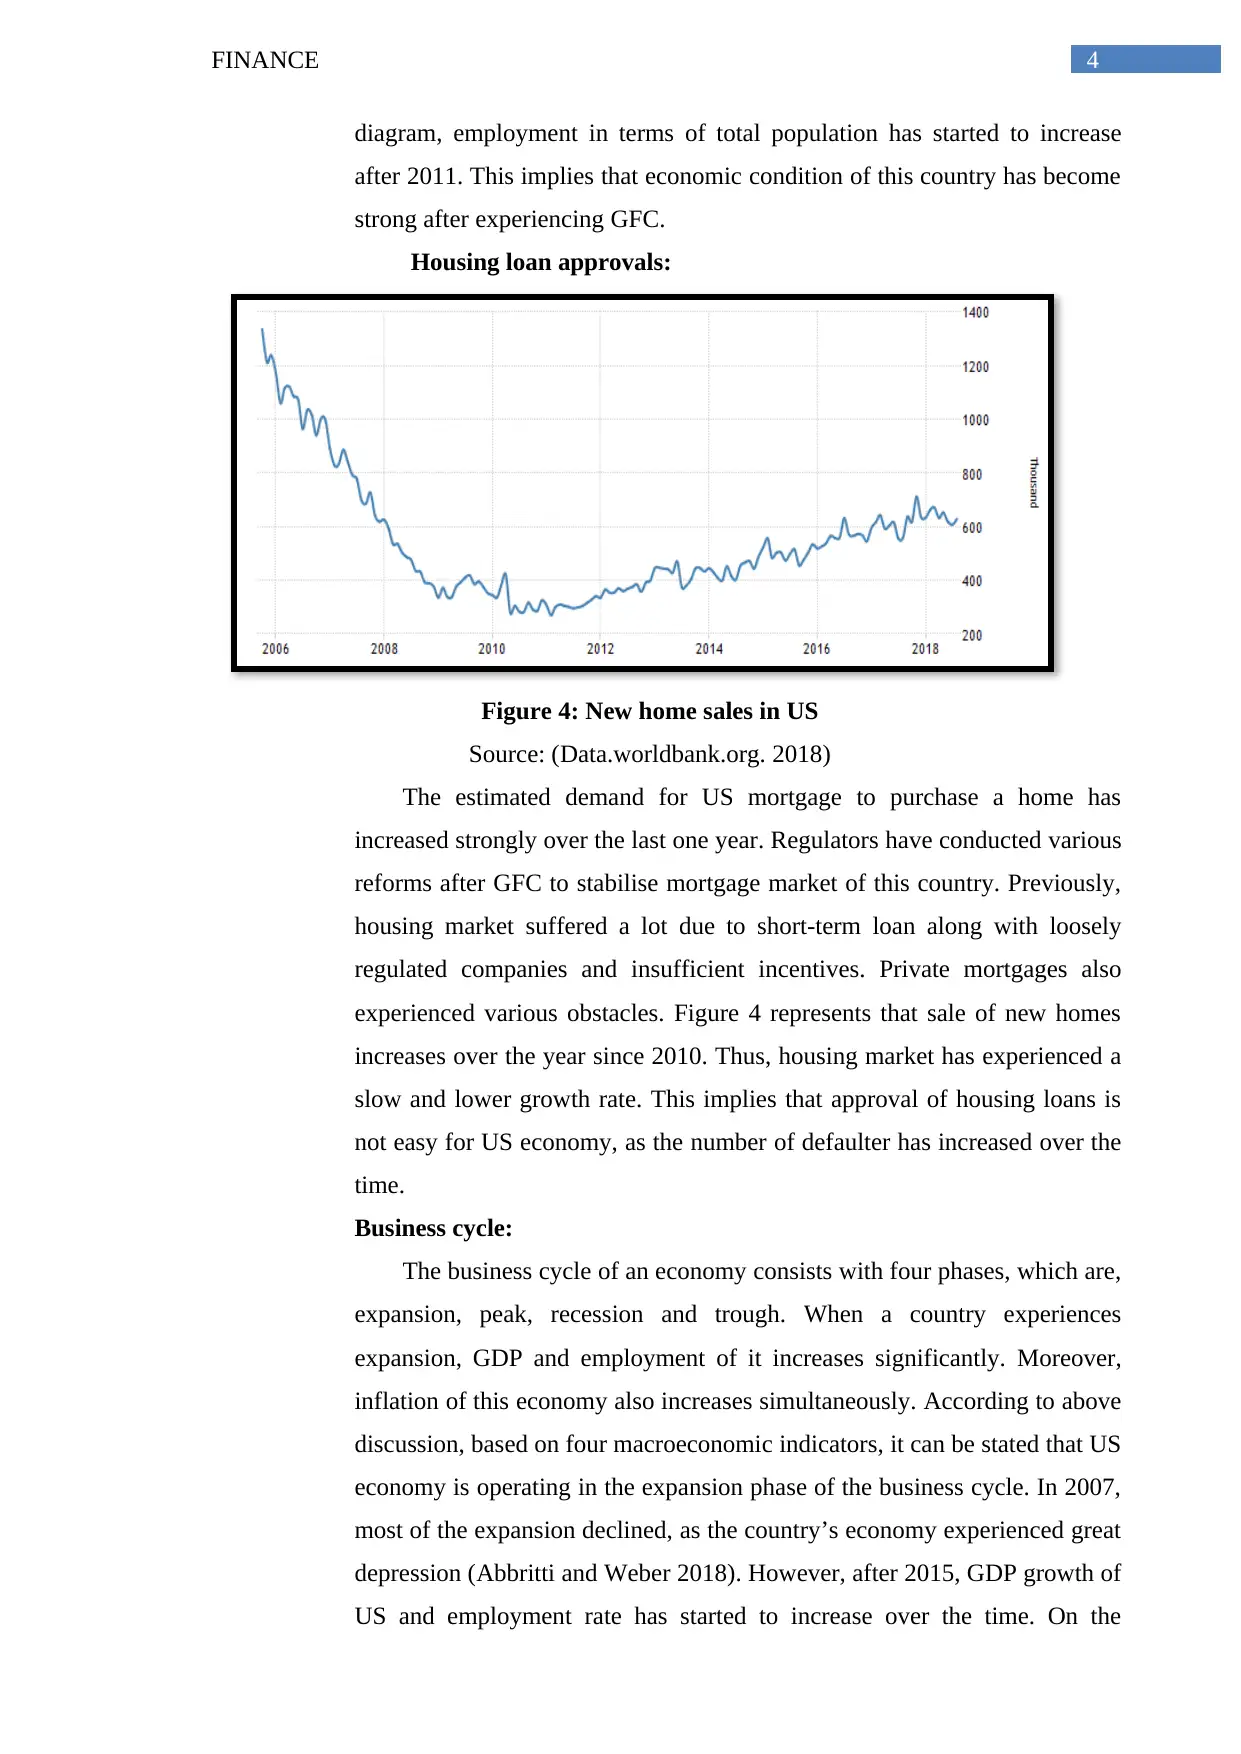
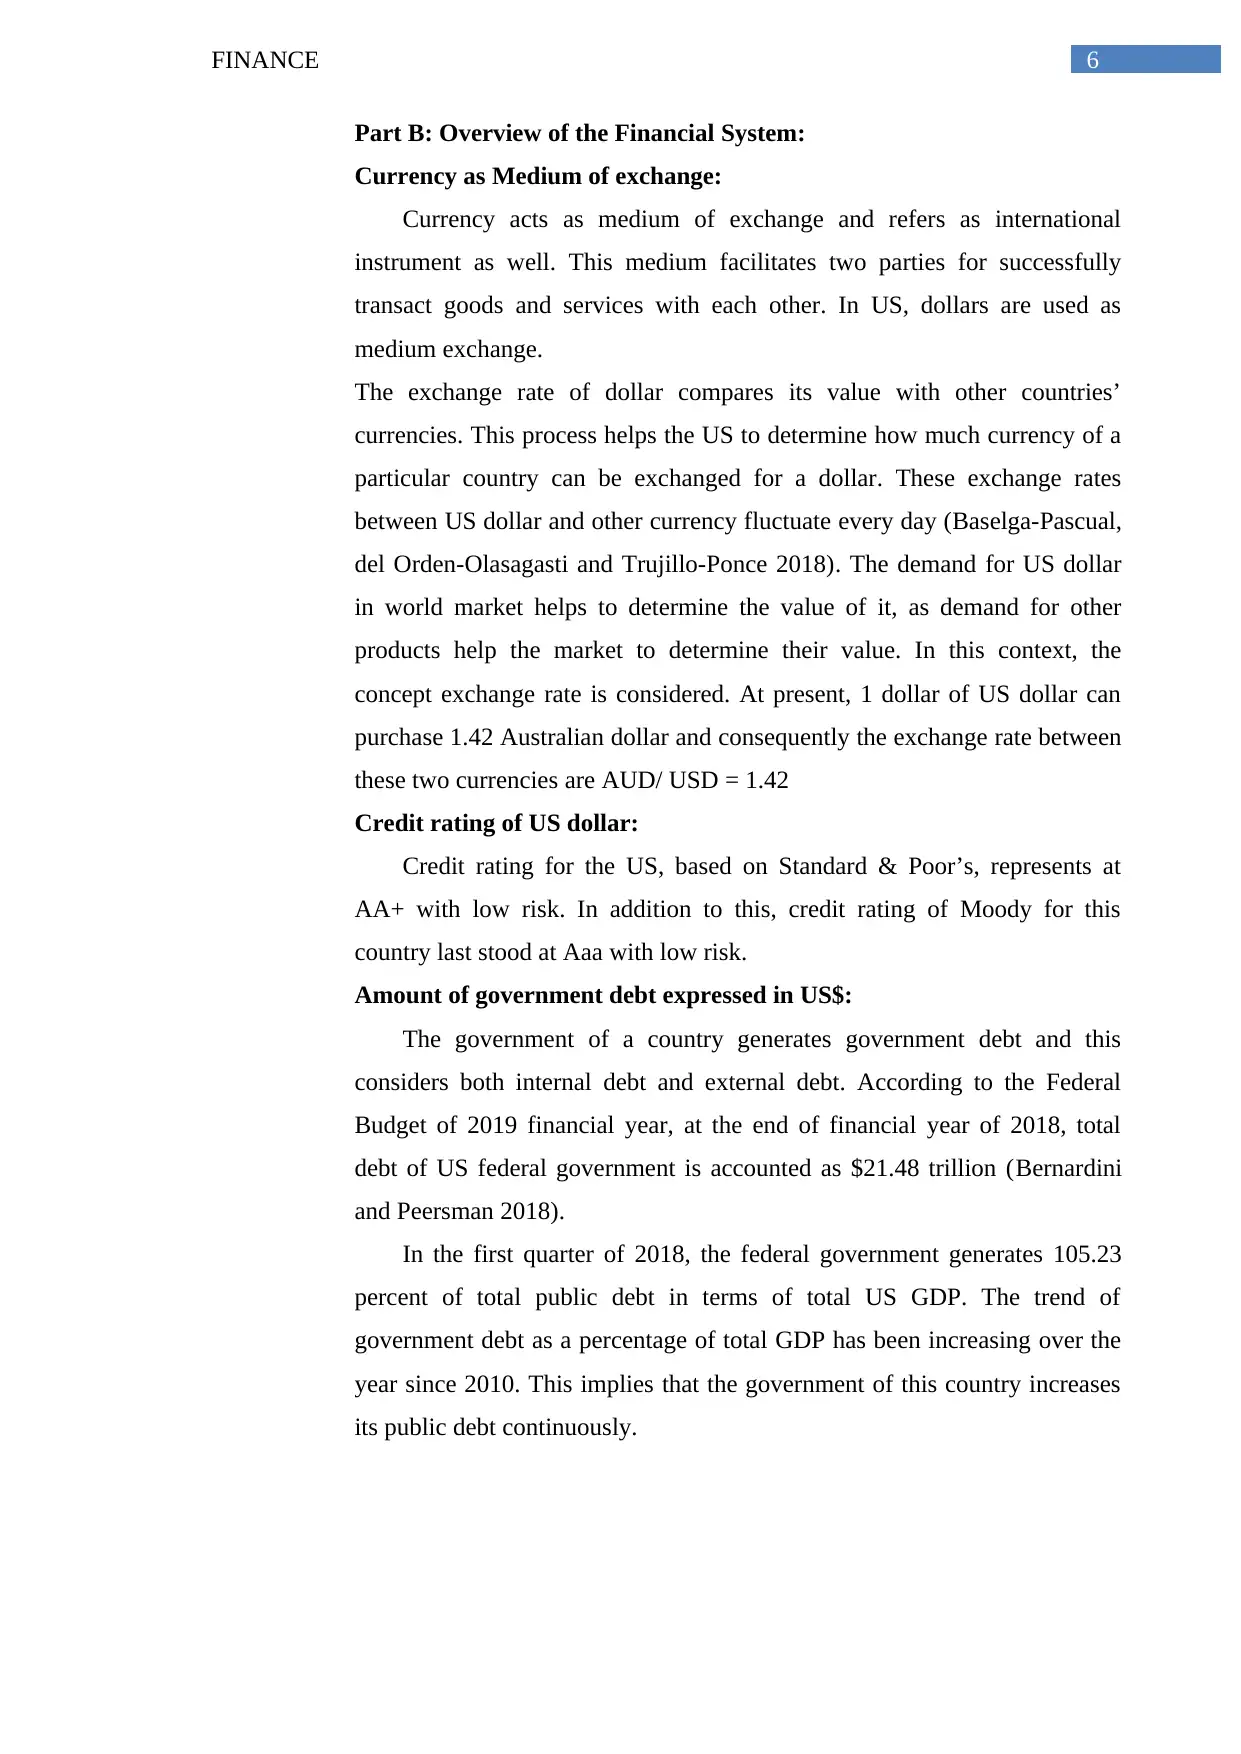
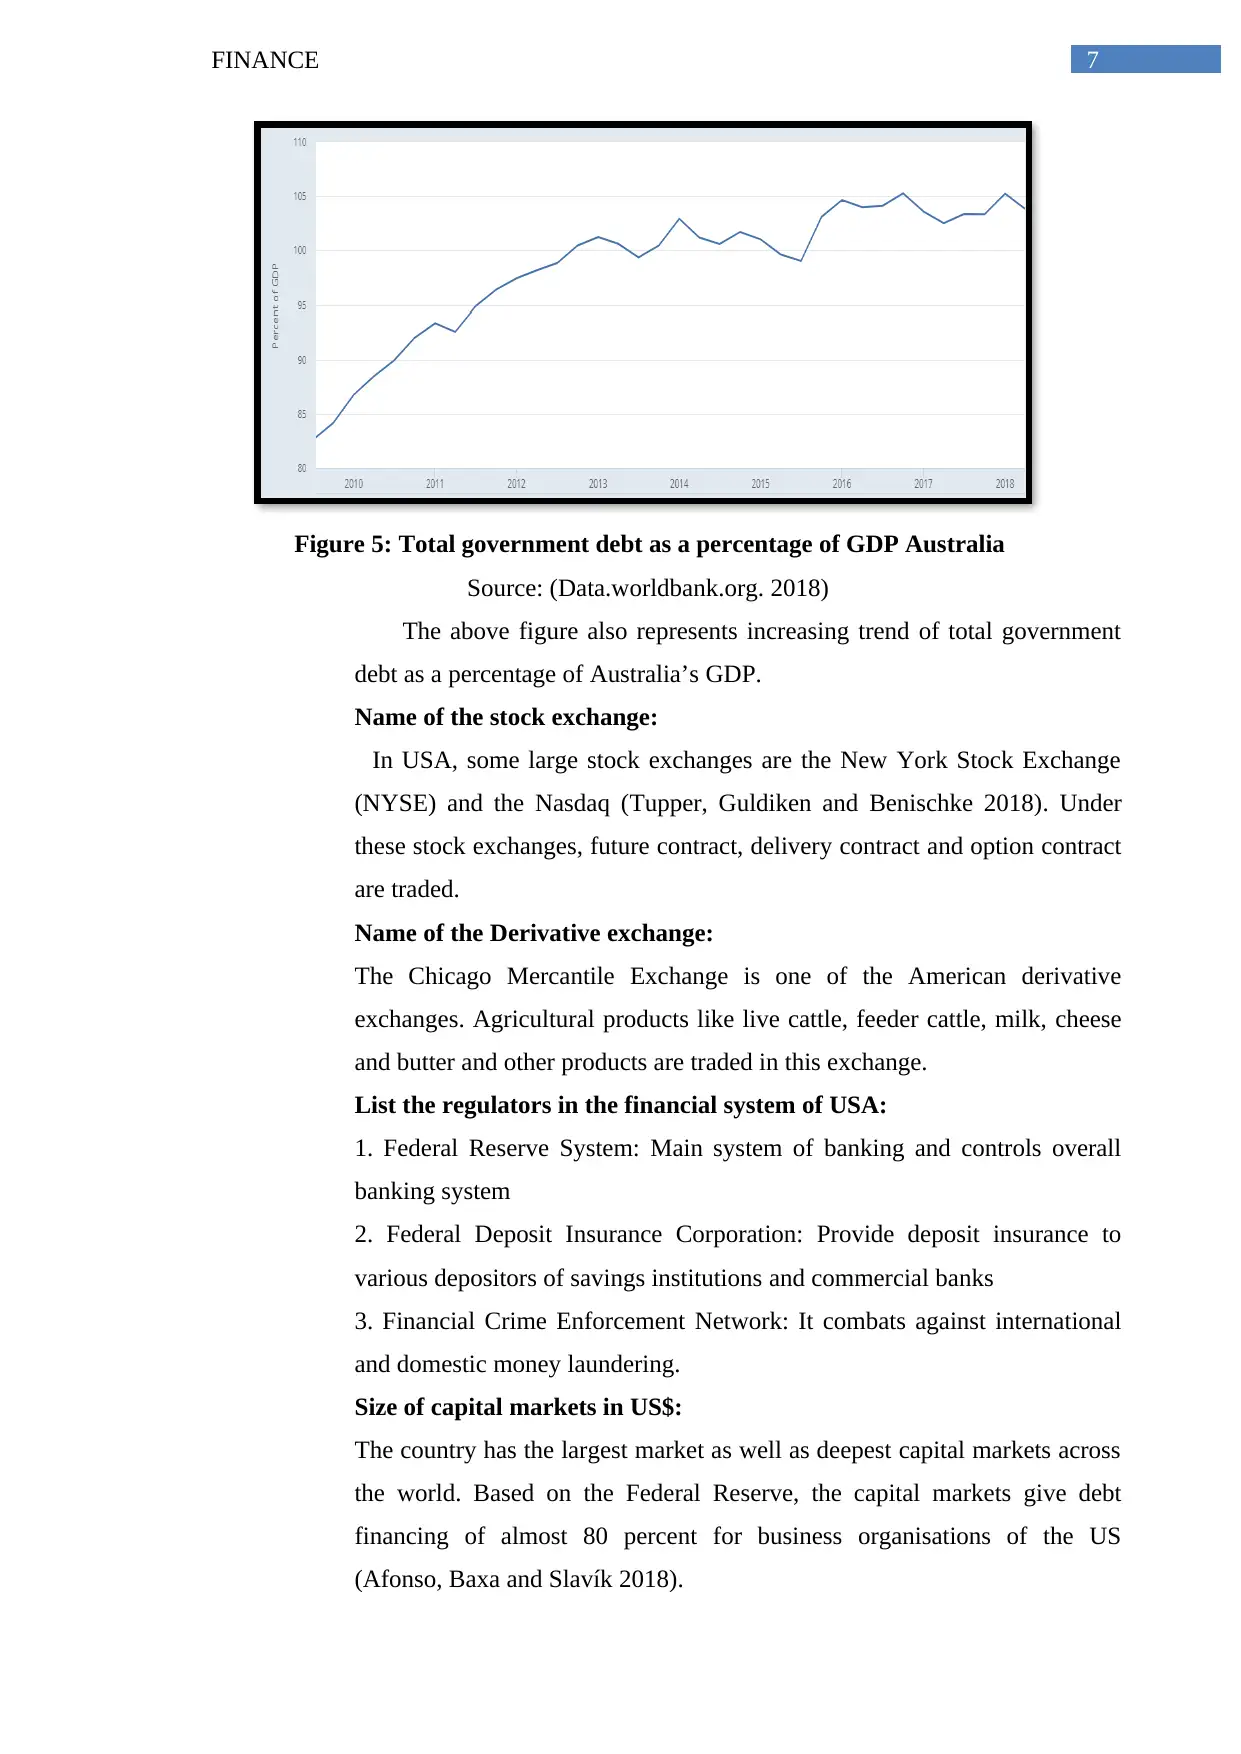
This finance report provides a comprehensive analysis of the US economy, examining key macroeconomic indicators such as GDP, inflation, and employment between 2005 and 2018 to determine the current stage of the business cycle. It then offers an overview of the US financial system, including currency, credit ratings, government debt, stock exchanges, and regulatory bodies. The report further provides practical examples of financial products, including loan calculations, interest calculations, and investment strategies. Finally, it distinguishes between market risk and specific risk, illustrating their impact on financial assets, with references to the 2008 global financial crisis. The report adheres to the requirements of a formal report, including proper formatting and referencing.
Document Page
Running head: FINANCE
Finance
Name of the Student
Name of the University
Author Note
tabler-icon-diamond-filled.svg

Paraphrase This Document

Need a fresh take? Get an instant paraphrase of this document with our AI Paraphraser
Document Page
1FINANCE
Table of Contents
Part A: Economic conditions of US:...........................................................................................2
Part B: Overview of the Financial System:.................................................................................5
Part C: Product examples:...........................................................................................................7
Part D: Market Risk....................................................................................................................8
References:................................................................................................................................10
Document Page
2FINANCE
Part A: Economic conditions of US:
This part intends to analyse economic condition of the US through
considering gross domestic product (GDP), inflation, employment between
2005 and 2018 along with housing loan approvals (Harrison et al. 2018).
Through analysing these indicators, the report can state the stage of business
cycle in which the country is operating with the help of appropriate
explanations.
GDP:
Figure 1: Annual GDP growth of US
Source (Data.worldbank.org. 2018)
According to above figure, GDP growth of US became low during
2008 to 2010 due to global financial crisis (GFC). As the GFC was started
from this country, it affected US’s economic condition adversely. After this
situation, GDP growth started to increase drastically though later it
fluctuated by small proportion. However, since 2016, GDP growth of US
has started to increase continuously.
Document Page
3FINANCE
Inflation:
Figure 2: Inflation rate of US
Source: (Data.worldbank.org. 2018)
The above figure has represented inflation trend of US. According to
figure 2, inflation of US fluctuated drastically between 2007 and 2012. After
2015, this macroeconomic indicator has started to increase at a slower rate.
The average inflation during this period remains at 1.54 percent, which in
turn helps economic condition of this country to improve further.
Employment:
Figure 3: Employment in US
Source: (Data.worldbank.org. 2018)
Figure 3 has considered employment to population ratio of US
considering employees aged above 15 and others. According to this
tabler-icon-diamond-filled.svg

Paraphrase This Document

Need a fresh take? Get an instant paraphrase of this document with our AI Paraphraser
Document Page
4FINANCE
diagram, employment in terms of total population has started to increase
after 2011. This implies that economic condition of this country has become
strong after experiencing GFC.
Housing loan approvals:
Figure 4: New home sales in US
Source: (Data.worldbank.org. 2018)
The estimated demand for US mortgage to purchase a home has
increased strongly over the last one year. Regulators have conducted various
reforms after GFC to stabilise mortgage market of this country. Previously,
housing market suffered a lot due to short-term loan along with loosely
regulated companies and insufficient incentives. Private mortgages also
experienced various obstacles. Figure 4 represents that sale of new homes
increases over the year since 2010. Thus, housing market has experienced a
slow and lower growth rate. This implies that approval of housing loans is
not easy for US economy, as the number of defaulter has increased over the
time.
Business cycle:
The business cycle of an economy consists with four phases, which are,
expansion, peak, recession and trough. When a country experiences
expansion, GDP and employment of it increases significantly. Moreover,
inflation of this economy also increases simultaneously. According to above
discussion, based on four macroeconomic indicators, it can be stated that US
economy is operating in the expansion phase of the business cycle. In 2007,
most of the expansion declined, as the country’s economy experienced great
depression (Abbritti and Weber 2018). However, after 2015, GDP growth of
US and employment rate has started to increase over the time. On the
Document Page
5FINANCE
contrary, inflation rate has increased at a lower rate. However, slow sales of
houses and light vehicle have affected economic growth of this country.
Hence, this mixed outcome based on above analysis clearly represents that
US economy is in slow expansionary phase.
Document Page
6FINANCE
Part B: Overview of the Financial System:
Currency as Medium of exchange:
Currency acts as medium of exchange and refers as international
instrument as well. This medium facilitates two parties for successfully
transact goods and services with each other. In US, dollars are used as
medium exchange.
The exchange rate of dollar compares its value with other countries’
currencies. This process helps the US to determine how much currency of a
particular country can be exchanged for a dollar. These exchange rates
between US dollar and other currency fluctuate every day (Baselga-Pascual,
del Orden-Olasagasti and Trujillo-Ponce 2018). The demand for US dollar
in world market helps to determine the value of it, as demand for other
products help the market to determine their value. In this context, the
concept exchange rate is considered. At present, 1 dollar of US dollar can
purchase 1.42 Australian dollar and consequently the exchange rate between
these two currencies are AUD/ USD = 1.42
Credit rating of US dollar:
Credit rating for the US, based on Standard & Poor’s, represents at
AA+ with low risk. In addition to this, credit rating of Moody for this
country last stood at Aaa with low risk.
Amount of government debt expressed in US$:
The government of a country generates government debt and this
considers both internal debt and external debt. According to the Federal
Budget of 2019 financial year, at the end of financial year of 2018, total
debt of US federal government is accounted as $21.48 trillion (Bernardini
and Peersman 2018).
In the first quarter of 2018, the federal government generates 105.23
percent of total public debt in terms of total US GDP. The trend of
government debt as a percentage of total GDP has been increasing over the
year since 2010. This implies that the government of this country increases
its public debt continuously.
tabler-icon-diamond-filled.svg

Paraphrase This Document

Need a fresh take? Get an instant paraphrase of this document with our AI Paraphraser
Document Page
7FINANCE
Figure 5: Total government debt as a percentage of GDP Australia
Source: (Data.worldbank.org. 2018)
The above figure also represents increasing trend of total government
debt as a percentage of Australia’s GDP.
Name of the stock exchange:
In USA, some large stock exchanges are the New York Stock Exchange
(NYSE) and the Nasdaq (Tupper, Guldiken and Benischke 2018). Under
these stock exchanges, future contract, delivery contract and option contract
are traded.
Name of the Derivative exchange:
The Chicago Mercantile Exchange is one of the American derivative
exchanges. Agricultural products like live cattle, feeder cattle, milk, cheese
and butter and other products are traded in this exchange.
List the regulators in the financial system of USA:
1. Federal Reserve System: Main system of banking and controls overall
banking system
2. Federal Deposit Insurance Corporation: Provide deposit insurance to
various depositors of savings institutions and commercial banks
3. Financial Crime Enforcement Network: It combats against international
and domestic money laundering.
Size of capital markets in US$:
The country has the largest market as well as deepest capital markets across
the world. Based on the Federal Reserve, the capital markets give debt
financing of almost 80 percent for business organisations of the US
(Afonso, Baxa and Slavík 2018).
Document Page
8FINANCE
Document Page
9FINANCE
Size of money markets in US$:
The money markets in the USA are considered as a part of the financial
market, which is used to generate short-term finance. As of 2017, the
primary credit risk in the USA was 1.60.
tabler-icon-diamond-filled.svg

Paraphrase This Document

Need a fresh take? Get an instant paraphrase of this document with our AI Paraphraser
Document Page
10FINANCE
Part C: Product examples:
1. Assuming the length of loan and interest rate:
Particular Value
Loan amount $ 30,000
interest rate 7%
Time 12
PMT $2,595.80
The above calculation indicates that the overall monthly payment of
$2,595.80 can be conducted for the loan amount of $30,000 with the interest
rate of 7% and tenue of 12 months. The time period of the loan can be
altered by the borrower, which would change the monthly payment
structure.
2. Calculating the simple interest on the loan taken by the bank:
Particular Value
Loan amount 5,000,000
interest rate 1.48%
Total
Interest
$74,000.00
Banks uses LIBOR rate for gathering short term loans, which is current
valued at 1.48% and for the investment period of 48hours the bank has to
pay the interest of $74,000 for acquiring the loan of $5,000,000 (DeFusco
and Paciorek 2017).
3. Government funding a budget deficit:
The government mainly uses bond for acquiring the relevant fund from
the market and minimize the budget deficit, which occurs while conducting
operations.
Document Page
11FINANCE
4. Predicting how the engineer could have saved by the specified time in
the future:
Particular Value
PMT 300
PV 8000
Interest 0.26%
Time 240
FV $84,714.43
The overall interest rate is mainly at the level of 3.10% annually, where
the time period of investment is mainly calculated at 20 years. The
consideration of the overall time period and interest rate would directly
result in a future value of $84,714.43
5. Specifying the three products that can be used in the investment:
The risk of non-performing equities can be reduced with the help of
adequate hedging measure, where the investor can use options, futures and
delivery stock for reducing the risk from the portfolio (Diserens et al. 2018).
The options contract can be used for reducing the risk from the portfolio by
hedging the index contract. Investor with the help of broker can initiate the
contract.
chevron_up_icon
1 out of 15
circle_padding
hide_on_mobile
zoom_out_icon
[object Object]