An In-depth Analysis of the United States Economy (2008-2018)
VerifiedAdded on 2022/10/12
|13
|2830
|341
Report
AI Summary
This report provides a comprehensive analysis of the United States economy from 2008 to 2018, focusing on key economic indicators. It examines the trends in real GDP, highlighting the impact of the 2008 financial crisis and subsequent recovery, along with government interventions like the Troubled Asset Relief Program. The report also delves into the labor market, discussing unemployment concepts, various forms of unemployment (structural, cyclical, and frictional), and the government's measures to achieve full employment. Furthermore, it analyzes price level dynamics, explaining inflation causes (demand-pull and cost-push) and trends, along with the Federal Reserve's monetary policy strategies to stabilize prices. The report concludes by summarizing the overall economic performance, emphasizing the government's continuous efforts to maintain stability and growth. This report is available on Desklib, a platform offering past papers and solved assignments for students.
Running head: ECONOMICS
Economics
Name of the Student
Name of the University
Course ID
Economics
Name of the Student
Name of the University
Course ID
Paraphrase This Document
Need a fresh take? Get an instant paraphrase of this document with our AI Paraphraser
1ECONOMICS
1.Introduction
United States of America is world’s one of the most progressive nation of the world.
The country records highest nominal GDP and second higher per capita adjusted GDP in
world. The economy holds the position of one of the most powerful nations globally. The
economy follows principles of a mixed economy. Economic progress of the USA economy
has been fueled by the abundant stock of natural resources, highly developed infrastructure
and high productivity. The economy possess stock of natural resources valued nearly $45
trillion. The nation has a large stock of natural gas, copper, iron, phosphate, gold, silver,
mercury, lead, bauxite, nickel, petroleum, uranium, potash and others (Desai, 2013). USA is a
service dominated economy with share of service sector in the GDP being 80.2 percent
followed by 18.9 percent share of industry and 0.9 percent share of agriculture.
USA is second largest manufacturing industry in the world producing a wide variety
of goods using advanced technology and resources. The top five manufacturing product of
USA are electrical equipment, fabricated metal products, medical equipment, sporting goods
and miscellaneous, primary metal and food. Major services of USA include financial service,
telecommunication, computer service retail distribution, environmental service and others
(Ustr.gov, 2019). Moreover, USA is a world’s leading producer of natural gas and oil.
USA not only has a strong internal economy but also it holds a strong position in
global market through trade and investment. Top five exported commodities of the nation are
Refined and Crude Petroleum, Lumber, Gold, Aluminum and Coffee with five major export
destination of European Union, Canada, Mexico, China and Japan (Businessinsider.com,
2019). Of the several major companies operating in USA, top five are Walmart, Berkshire
Hathaway, Apple, ExxonMobil and McKesson.
2ECONOMICS
2. Production output performance
Real GDP, growth in real GDP and per capita real GDP
The most convenient measure for aggregate output of a nation is the gross domestic
product. GDP is defined as a measure estimating monetary values of goods and services that
a nation produces in an accounting year. Real GDP is the computed GDP which is adjusted
for inflation and a fixed base price is used in computing values of produced goods and
services in an economy. Growth in real GDP measures the percentage change in real GDP
between two years (Heijdra, 2017). Growth in real GDP is used to measure actual economic
growth of the nation. In order to measure average output within the nation, per capita real
GDP is used. It is a measure obtained by dividing real GDP with total population of the
nation.
Analysis of trend in real GDP
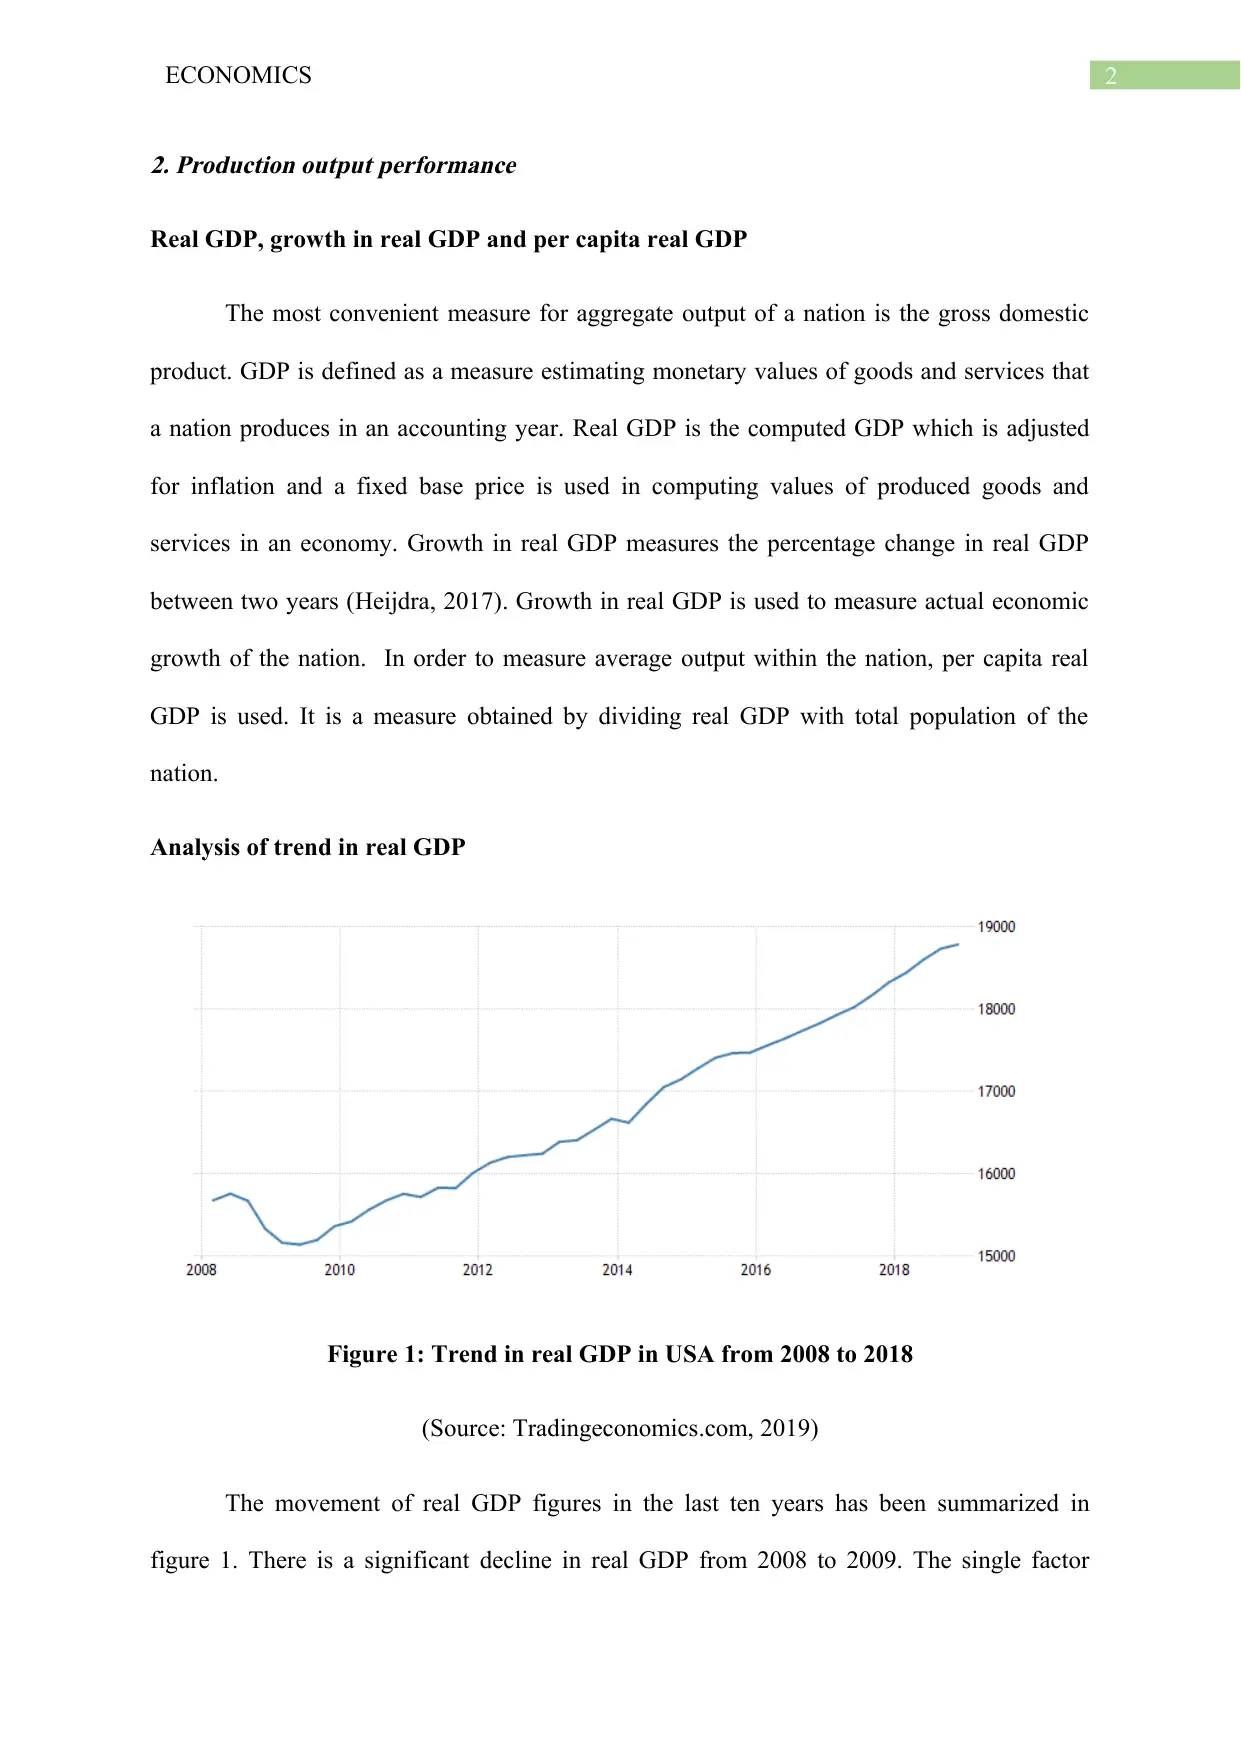
Figure 1: Trend in real GDP in USA from 2008 to 2018
(Source: Tradingeconomics.com, 2019)
The movement of real GDP figures in the last ten years has been summarized in
figure 1. There is a significant decline in real GDP from 2008 to 2009. The single factor
2. Production output performance
Real GDP, growth in real GDP and per capita real GDP
The most convenient measure for aggregate output of a nation is the gross domestic
product. GDP is defined as a measure estimating monetary values of goods and services that
a nation produces in an accounting year. Real GDP is the computed GDP which is adjusted
for inflation and a fixed base price is used in computing values of produced goods and
services in an economy. Growth in real GDP measures the percentage change in real GDP
between two years (Heijdra, 2017). Growth in real GDP is used to measure actual economic
growth of the nation. In order to measure average output within the nation, per capita real
GDP is used. It is a measure obtained by dividing real GDP with total population of the
nation.
Analysis of trend in real GDP
Figure 1: Trend in real GDP in USA from 2008 to 2018
(Source: Tradingeconomics.com, 2019)
The movement of real GDP figures in the last ten years has been summarized in
figure 1. There is a significant decline in real GDP from 2008 to 2009. The single factor
⊘ This is a preview!⊘
Do you want full access?
Subscribe today to unlock all pages.
Trusted by 1+ million students worldwide
3ECONOMICS
explaining economic downturn during this time was outbreak of global financial crisis caused
mainly due to subprime mortgage crisis in United States. After few years of continuous
increase, housing price reached to the highest level in 2006, However, since the fourth
quarter of 2007 housing price experienced a steep downfall resulting in an economy wide
debt crisis (Chen et al., 2016). The economy though recovered thereafter but the pace of
recovery was relatively slow.
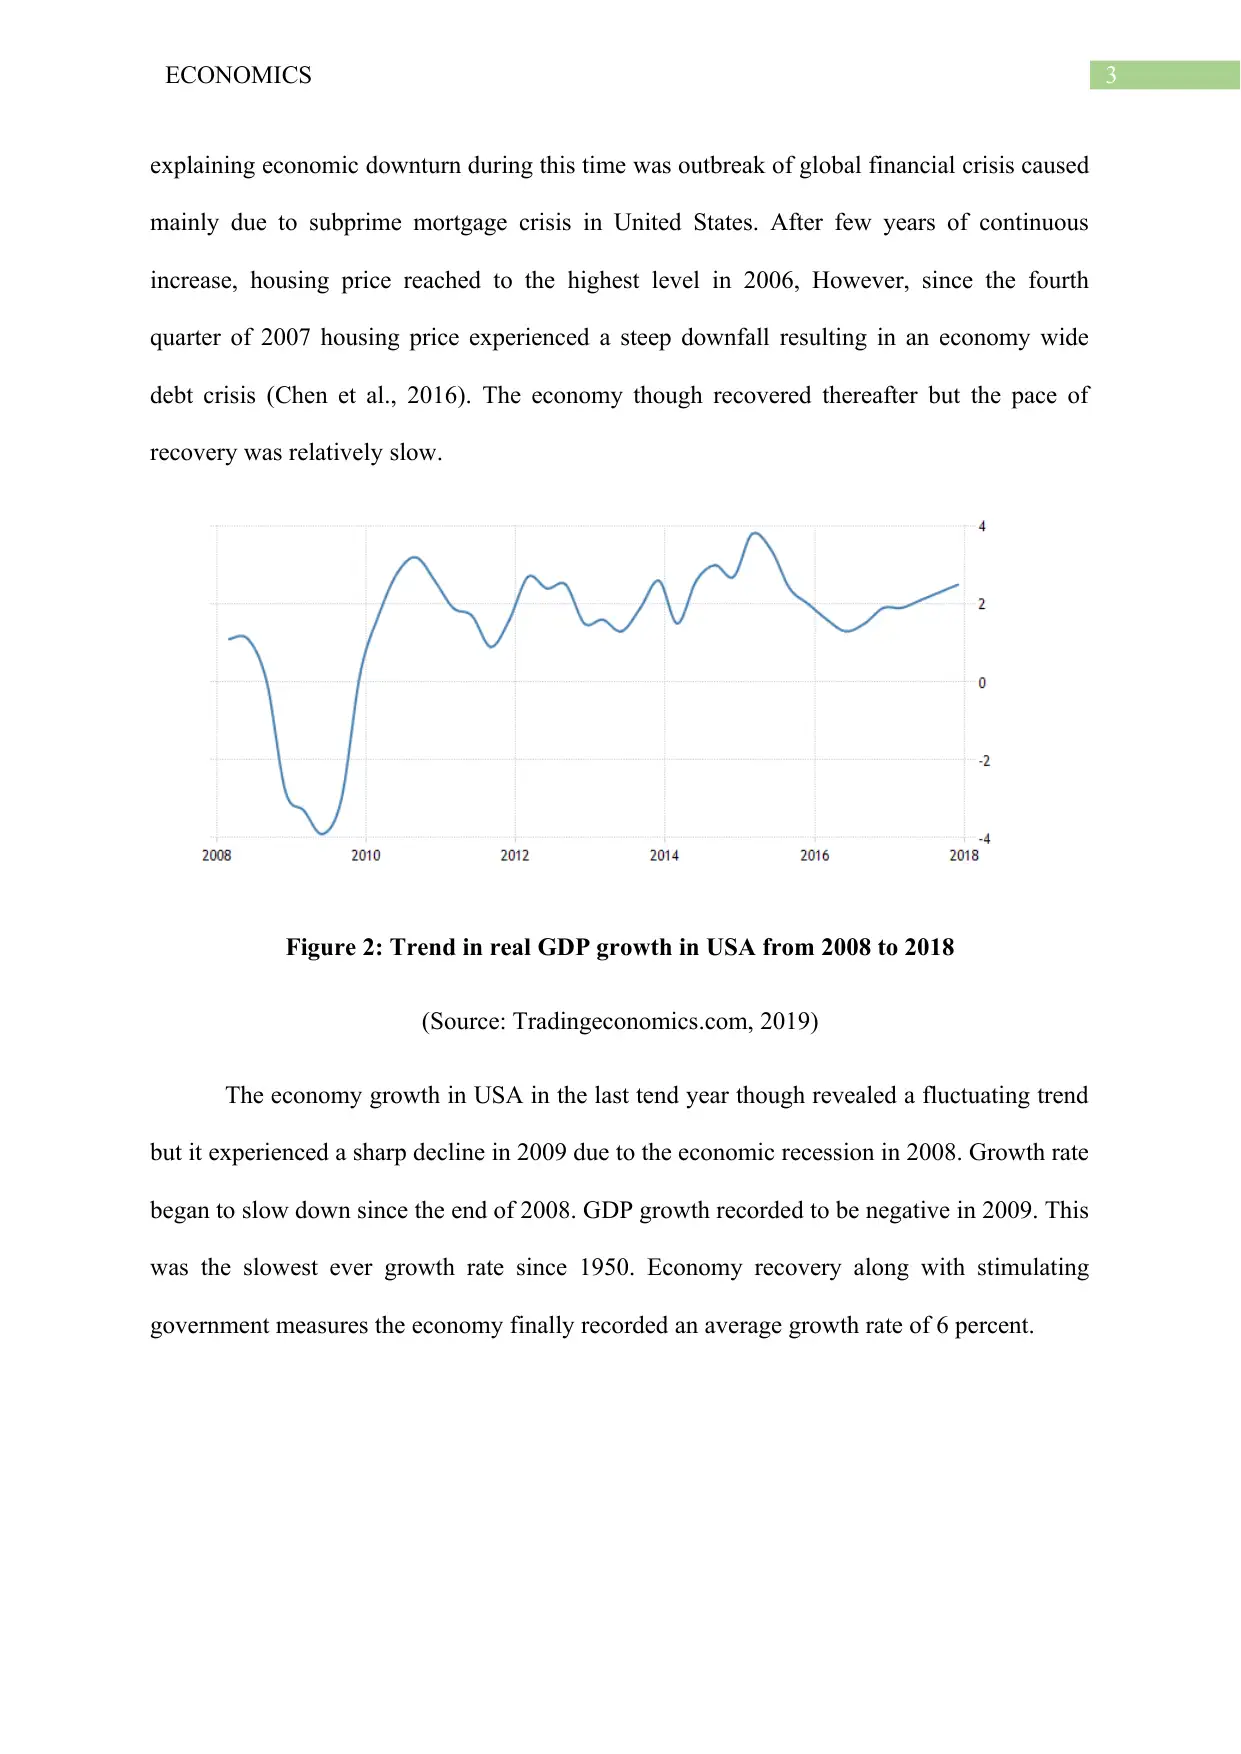
Figure 2: Trend in real GDP growth in USA from 2008 to 2018
(Source: Tradingeconomics.com, 2019)
The economy growth in USA in the last tend year though revealed a fluctuating trend
but it experienced a sharp decline in 2009 due to the economic recession in 2008. Growth rate
began to slow down since the end of 2008. GDP growth recorded to be negative in 2009. This
was the slowest ever growth rate since 1950. Economy recovery along with stimulating
government measures the economy finally recorded an average growth rate of 6 percent.
explaining economic downturn during this time was outbreak of global financial crisis caused
mainly due to subprime mortgage crisis in United States. After few years of continuous
increase, housing price reached to the highest level in 2006, However, since the fourth
quarter of 2007 housing price experienced a steep downfall resulting in an economy wide
debt crisis (Chen et al., 2016). The economy though recovered thereafter but the pace of
recovery was relatively slow.
Figure 2: Trend in real GDP growth in USA from 2008 to 2018
(Source: Tradingeconomics.com, 2019)
The economy growth in USA in the last tend year though revealed a fluctuating trend
but it experienced a sharp decline in 2009 due to the economic recession in 2008. Growth rate
began to slow down since the end of 2008. GDP growth recorded to be negative in 2009. This
was the slowest ever growth rate since 1950. Economy recovery along with stimulating
government measures the economy finally recorded an average growth rate of 6 percent.
Paraphrase This Document
Need a fresh take? Get an instant paraphrase of this document with our AI Paraphraser
4ECONOMICS
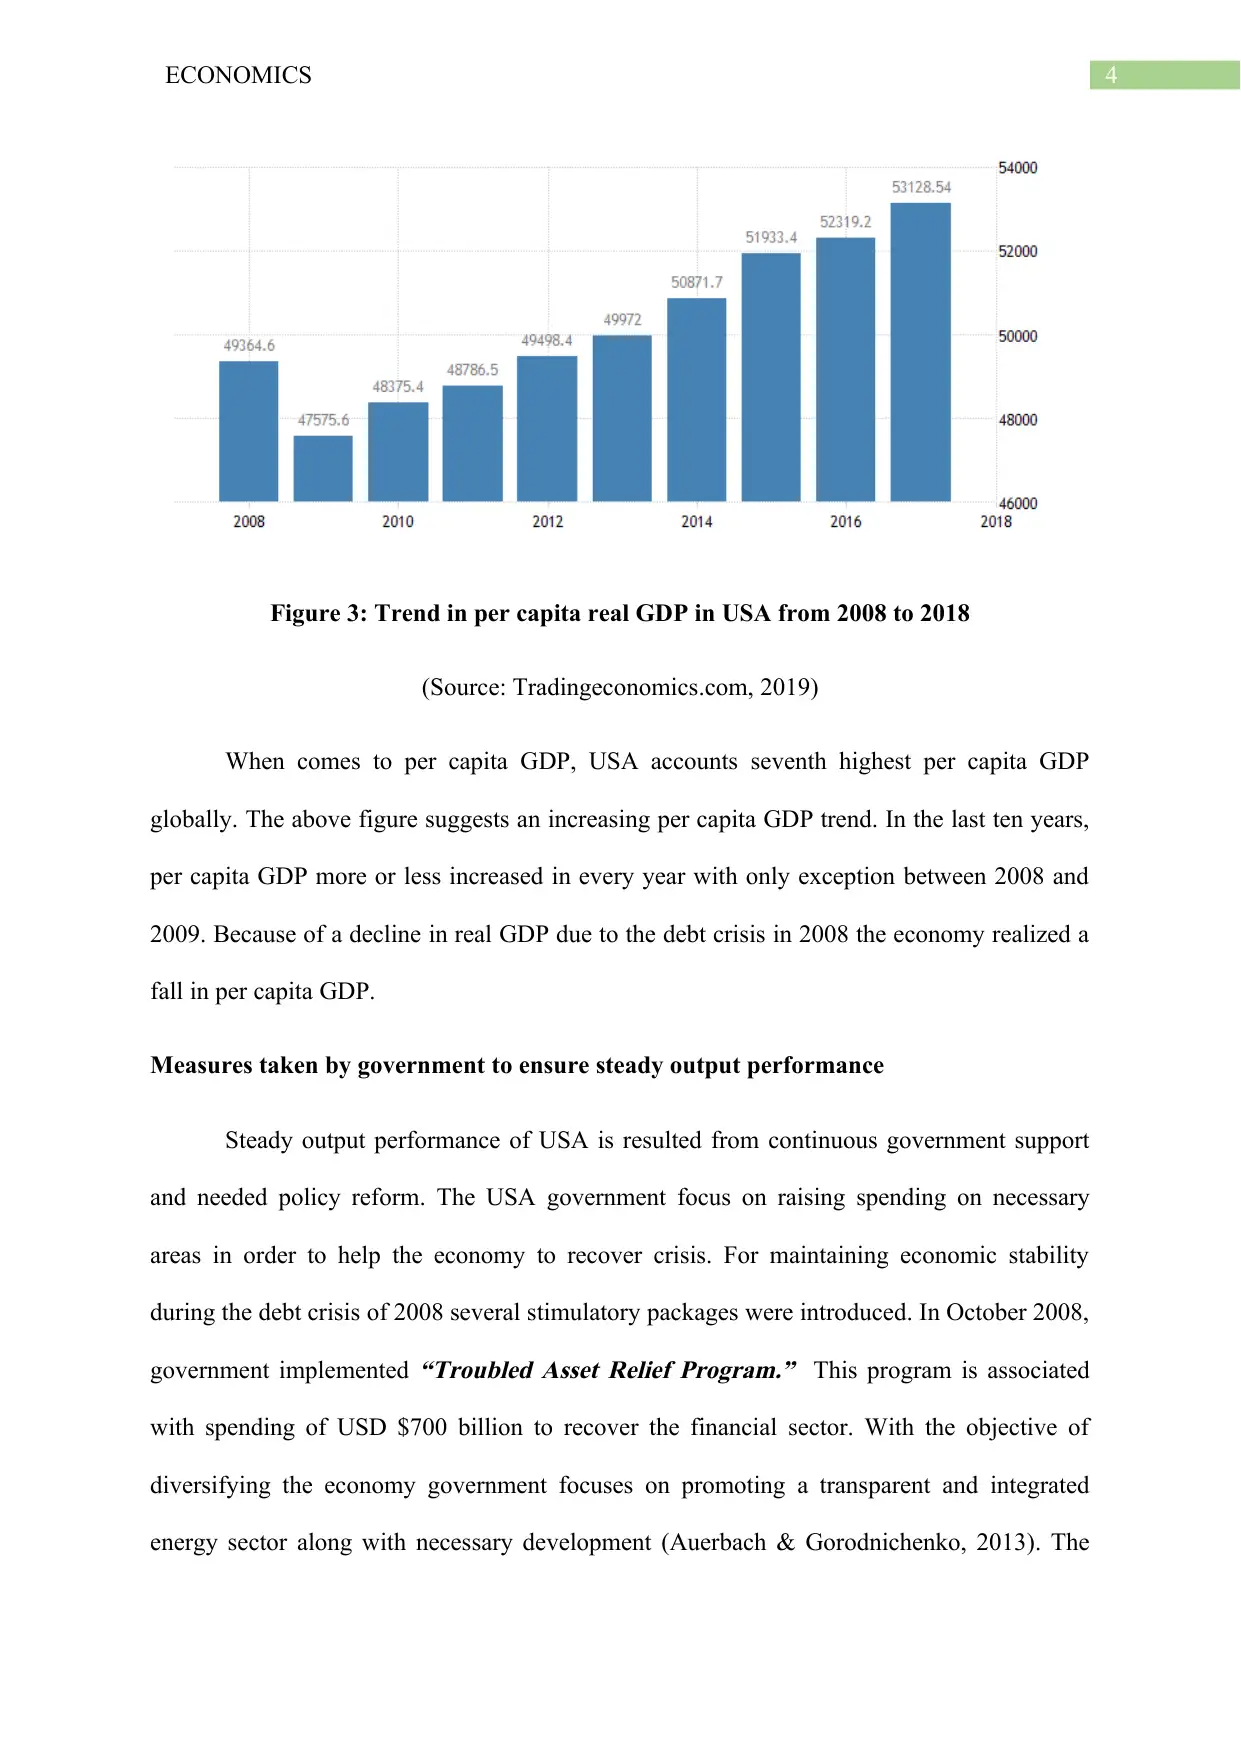
Figure 3: Trend in per capita real GDP in USA from 2008 to 2018
(Source: Tradingeconomics.com, 2019)
When comes to per capita GDP, USA accounts seventh highest per capita GDP
globally. The above figure suggests an increasing per capita GDP trend. In the last ten years,
per capita GDP more or less increased in every year with only exception between 2008 and
2009. Because of a decline in real GDP due to the debt crisis in 2008 the economy realized a
fall in per capita GDP.
Measures taken by government to ensure steady output performance
Steady output performance of USA is resulted from continuous government support
and needed policy reform. The USA government focus on raising spending on necessary
areas in order to help the economy to recover crisis. For maintaining economic stability
during the debt crisis of 2008 several stimulatory packages were introduced. In October 2008,
government implemented
“Troubled Asset Relief Program.” This program is associated
with spending of USD $700 billion to recover the financial sector. With the objective of
diversifying the economy government focuses on promoting a transparent and integrated
energy sector along with necessary development (Auerbach & Gorodnichenko, 2013). The
5ECONOMICS
government has made continuous effort to strengthen the private sector that can help to
ensure steady business growth. Additionally, government relaxes regulatory barriers to allow
businesses to grow steadily. Recently, USA government has sanctioned $200 billion for
investment in infrastructural development.
3. Labor market performance
Unemployment concept and various forms of unemployment
The most important indicator of measuring labor market performance is the incidence
of unemployment in the labor force. A member of the labor force is considered as
unemployed when despite actively looking for jobs the person cannot find an appropriate
jobs. Depending on various reasons, unemployment are classified into three main forms –
structural unemployment, cyclical unemployment and frictional unemployment.
Structural unemployment
In an economy, structural unemployment is created due to any structural shift
occurred within the economy. The main reason behind structural unemployment is mismatch
between skills of the existing workforce and those demanded by the employers. People suffer
structural unemployment when manual works are replaced by machineries.
Cyclical unemployment
This kind of unemployment is related to fluctuation related to business cycle. When
an economy suffers a recession, there is a contraction in overall economic activity resulting in
a decline in labor demand (Minford & Peel, 2019). As labor demand falls, incidence of
unemployed increases.
⊘ This is a preview!⊘
Do you want full access?
Subscribe today to unlock all pages.
Trusted by 1+ million students worldwide
6ECONOMICS
Frictional unemployment
Frictional unemployment are created when people moves from one job to another.
This is the time when a worker leaves the existing job and looks for a new job.
Unemployment types in USA
Like every other economies, USA experiences different forms of unemployment.
There are two main reasons for which the economy suffers structural unemployment. One is
employment of advanced technology in different industries and another is trade agreement.
People suffering from frictional unemployment are mostly students just completing their
college degree, housewives rejoining the labor market and construction workers who are
shifting to Arizona during winter. Cyclical unemployment in the economy created during the
phase of economic recession. USA economy suffered cyclical unemployment during several
recessionary phase such as great depression created in 1929, tech bubble bust in 2000 and
global financial crisis occurred in 2008.
Unemployment trend in USA economy
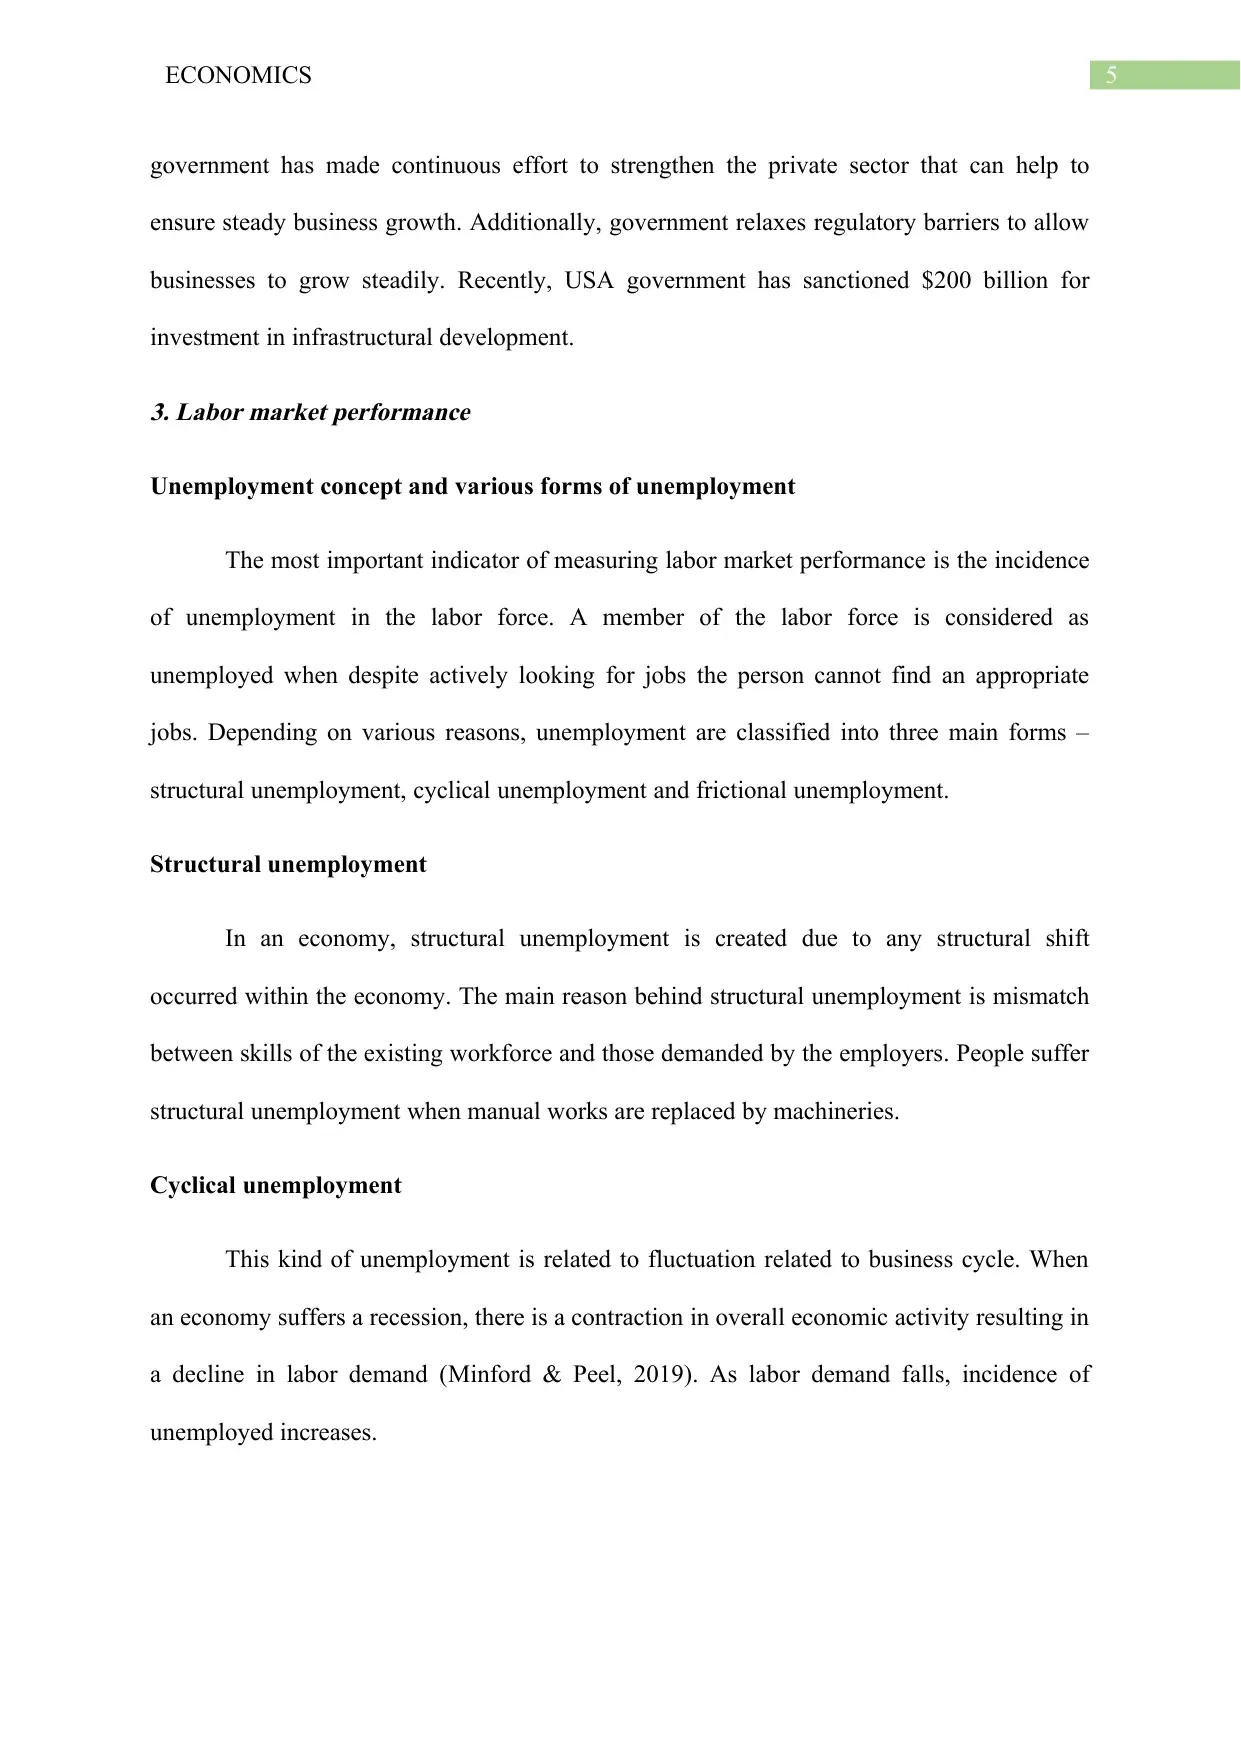
Figure 4: Trend in rate of unemployment in USA from 2008 to 2018
(Source: Tradingeconomics.com, 2019)
Frictional unemployment
Frictional unemployment are created when people moves from one job to another.
This is the time when a worker leaves the existing job and looks for a new job.
Unemployment types in USA
Like every other economies, USA experiences different forms of unemployment.
There are two main reasons for which the economy suffers structural unemployment. One is
employment of advanced technology in different industries and another is trade agreement.
People suffering from frictional unemployment are mostly students just completing their
college degree, housewives rejoining the labor market and construction workers who are
shifting to Arizona during winter. Cyclical unemployment in the economy created during the
phase of economic recession. USA economy suffered cyclical unemployment during several
recessionary phase such as great depression created in 1929, tech bubble bust in 2000 and
global financial crisis occurred in 2008.
Unemployment trend in USA economy
Figure 4: Trend in rate of unemployment in USA from 2008 to 2018
(Source: Tradingeconomics.com, 2019)
Paraphrase This Document
Need a fresh take? Get an instant paraphrase of this document with our AI Paraphraser
7ECONOMICS
Trend unemployment rate in USA decline sharply since 2010. Unemployment
increased sharply from 4.7% in 2008 to 10.1% in 2009. This was the time when debt crisis in
housing market caused a severe recession in the economy resulting in a contraction in
economic activity. Realizing growing problem of unemployment government introduced
several kind of employment support program along with increased spending on different
social security schemes. The gradual economic recovery came with the improvement of labor
market performance. With strengthening labor market condition unemployment started to
decline. Finally, the unemployment rate fell back to level where it was before the crisis. Fall
in unemployment during this time was resulted from creation of jobs in different areas such
as management, services and others.
Measures taken by government to attain full employment
Continuous effort of government in USA has helped the nation to achieve full
employment in the economy. During economic recession, the economy experiences cyclical
unemployment. To reduce unemployment in terms of creating new employment opportunities
government consider either monetary or fiscal policy expansion. Monetary policy expansion
is taken by lowering the fund rate. In time of expansionary fiscal policy government focus on
increasing expenditure on different employment generation program. After the financial crisis
of 2008, government introduced stimulatory packages and several new deal to support
employment generation (Nakamura & Steinsson, 2014). Federal government organizes
training and development program for supporting disadvantaged and displaced workers.
Majority of the programs are funded by education and labor department. Federal government
also makes funds available in order to provide necessary assistance for reemployment
service.
8ECONOMICS
4. Price level analysis
Inflation and different causes of inflation
The most important indicator for analyzing price level in the economy is the rate of
inflation. It indicates a state of continuous increase in overall price level. Two main factors
explaining rate of inflation in the economy are increase in aggregate demand or decrease in
aggregate supply. The former is known as demand-pull inflation and the latter is known as
cost-push inflation.
Demand-pull inflation
Any further increase in aggregate demand when the economy already in full
employment results in demand-pull inflation (Argy, 2013). When firms already reach to full
employment, resources are already been fully utilized. Therefore, when demand increases
firms increase price of their goods and services.
Cost-push inflation
Cost push inflation in the economy is created due to a rise in production cost of firms.
When cost of production of firms increases there is a decrease in aggregate supply causing
price level to increase.
Reasons of inflation in USA
Inflation in USA is caused both due to demand and supply side factors. One factor
causing demand-pull inflation in the economy is the fiscal policy expansion taken by the
government. Examples of expansionary fiscal policy include a decrease in corporate and
personal income tax. Increase in government expenditures increases aggregate demand
resulting in demand-pull inflation. Higher wage growth in the economy results in a cost-push
inflation (Summers, 2014). As wage increases there is an increase in cost of production
⊘ This is a preview!⊘
Do you want full access?
Subscribe today to unlock all pages.
Trusted by 1+ million students worldwide
9ECONOMICS
causing aggregate supply to decrease. When aggregate supply decreases, price level increases
resulting in cost-push inflation.
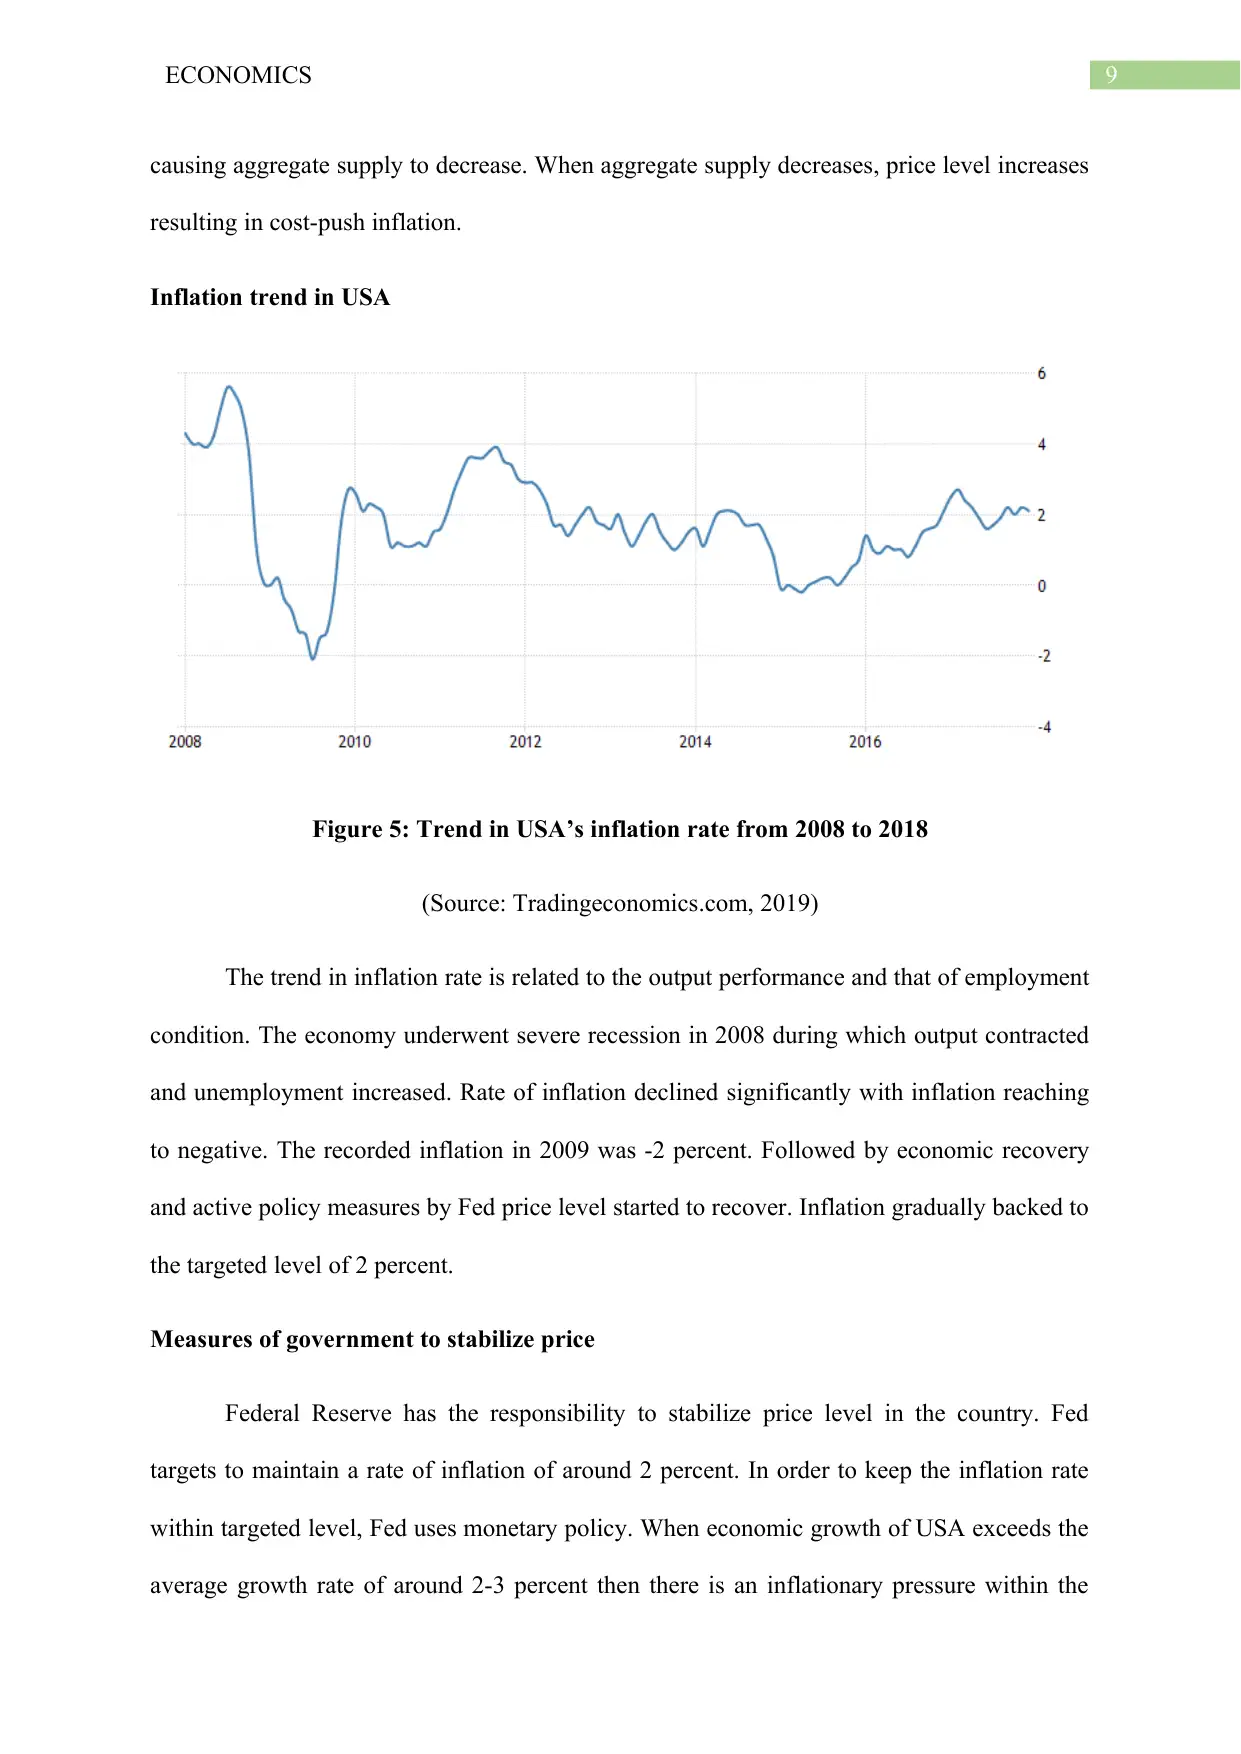
Inflation trend in USA
Figure 5: Trend in USA’s inflation rate from 2008 to 2018
(Source: Tradingeconomics.com, 2019)
The trend in inflation rate is related to the output performance and that of employment
condition. The economy underwent severe recession in 2008 during which output contracted
and unemployment increased. Rate of inflation declined significantly with inflation reaching
to negative. The recorded inflation in 2009 was -2 percent. Followed by economic recovery
and active policy measures by Fed price level started to recover. Inflation gradually backed to
the targeted level of 2 percent.
Measures of government to stabilize price
Federal Reserve has the responsibility to stabilize price level in the country. Fed
targets to maintain a rate of inflation of around 2 percent. In order to keep the inflation rate
within targeted level, Fed uses monetary policy. When economic growth of USA exceeds the
average growth rate of around 2-3 percent then there is an inflationary pressure within the
causing aggregate supply to decrease. When aggregate supply decreases, price level increases
resulting in cost-push inflation.
Inflation trend in USA
Figure 5: Trend in USA’s inflation rate from 2008 to 2018
(Source: Tradingeconomics.com, 2019)
The trend in inflation rate is related to the output performance and that of employment
condition. The economy underwent severe recession in 2008 during which output contracted
and unemployment increased. Rate of inflation declined significantly with inflation reaching
to negative. The recorded inflation in 2009 was -2 percent. Followed by economic recovery
and active policy measures by Fed price level started to recover. Inflation gradually backed to
the targeted level of 2 percent.
Measures of government to stabilize price
Federal Reserve has the responsibility to stabilize price level in the country. Fed
targets to maintain a rate of inflation of around 2 percent. In order to keep the inflation rate
within targeted level, Fed uses monetary policy. When economic growth of USA exceeds the
average growth rate of around 2-3 percent then there is an inflationary pressure within the
Paraphrase This Document
Need a fresh take? Get an instant paraphrase of this document with our AI Paraphraser
10ECONOMICS
country. To curb the inflation government then takes tight monetary policy. One way of
implementing monetary policy is open market operation (Federalreserve.gov, 2019). The
open market operation involves exchange of government securities. Other alternatives to
implement monetary policy include changing reserve requirement or change in federal fund
rate.
Conclusion
This essay briefly summarizes USA’s economic performance for the last ten years
ranged from 2008 to 2018. In order to describe overall performance of the economy
performances are considered for output, labor market and price level. USA being one of the
most powerful nations of the world has recorded an overall steady performances. The
economy recorded a considerable downturn during 2008. The debt crisis created in housing
market spread all over the nation causing an economic slowdown. Real GDP during this time
declined considerably along with an increase in unemployment and decrease in inflation rate.
With economic recovery thereafter the economy again recorded a steady performances. In the
economic recovery, government plays an important role. During recession, government
introduced different stimulatory packages to boost output, lower unemployment and inflation.
Successful policy implication along with stable economic performances has helped the nation
ensure a steady progress globally.
11ECONOMICS
References
Argy, V. (2013). International macroeconomics: theory and policy. Routledge.
Auerbach, A. J., & Gorodnichenko, Y. (2013). Output spillovers from fiscal
policy. American Economic Review, 103(3), 141-46.
Businessinsider.com (2019) MADE IN USA: The Top 10 Manufactured Products In
America's $2 Trillion Export Industry. Business Insider. Retrieved 2 August 2019, from
https://www.businessinsider.com/usa-manufactured-products-exports-america-2012-3?IR=T)
Chen, Q., Filardo, A., He, D., & Zhu, F. (2016). Financial crisis, US unconventional
monetary policy and international spillovers. Journal of International Money and
Finance, 67, 62-81.
Desai, R. (2013). Geopolitical economy: After US hegemony, globalization and empire (the
future of world capitalism). London: Pluto Press.
Federalreserve.gov (2019).The Fed - What are the Federal Reserve's objectives in conducting
monetary policy? Board of Governors of the Federal Reserve System. Retrieved 2 August
2019, from https://www.federalreserve.gov/faqs/money_12848.htm
Heijdra, B. J. (2017). Foundations of modern macroeconomics. Oxford university press.
Minford, P., & Peel, D. (2019). Advanced macroeconomics: a primer. Edward Elgar
Publishing.
Nakamura, E., & Steinsson, J. (2014). Fiscal stimulus in a monetary union: Evidence from
US regions. American Economic Review, 104(3), 753-92.
Summers, L. H. (2014). US economic prospects: Secular stagnation, hysteresis, and the zero
lower bound. Business Economics, 49(2), 65-73.
⊘ This is a preview!⊘
Do you want full access?
Subscribe today to unlock all pages.
Trusted by 1+ million students worldwide
1 out of 13
Related Documents


Your All-in-One AI-Powered Toolkit for Academic Success.
+13062052269
info@desklib.com
Available 24*7 on WhatsApp / Email
![[object Object]](/_next/static/media/star-bottom.7253800d.svg)
Unlock your academic potential
Copyright © 2020–2026 A2Z Services. All Rights Reserved. Developed and managed by ZUCOL.